Abstract
A maximum a posteriori approach is proposed for X-ray diffraction tomography for reconstructing three-dimensional spatial distribution of crystallographic phases and orientations of polycrystalline materials. The approach maximizes the a posteriori density which includes a Poisson log-likelihood and an a priori term that reinforces expected solution properties such as smoothness or local continuity. The reconstruction method is validated with experimental data acquired from a section of the spinous process of a porcine vertebra collected at the 1-ID-C beamline of the Advanced Photon Source, at Argonne National Laboratory. The reconstruction results show significant improvement in the reduction of aliasing and streaking artefacts, and improved robustness to noise and undersampling compared to conventional analytical inversion approaches. The approach has the potential to reduce data acquisition times, and significantly improve beamtime efficiency.
Keywords: diffraction tomography, image reconstruction, maximum a posteriori estimation, crystalline phases, biomineralization
1. Introduction
X-ray powder diffraction is a routine analytical tool for material characterization; when combined with tomography, it becomes a powerful technique for studying three-dimensional (3D) spatial distribution of crystallographic phases and orientations of polycrystalline materials [1]. When a monochromatic X-ray beam irradiates a specimen containing a multitude of single crystals which have various orientations, the diffraction pattern consists of concentric Debye cones from the different crystallographic planes, characterized by the index triplet hkl, the so-called Miller indices [2]. For a narrow, pencil-shaped incident X-ray beam, and an area detector positioned normal to the beam, the cones intersect the detector plane as a series of concentric rings whose opening angles, i.e. diffraction angles 2θhkl, depend on X-ray wavelength λ and inter-planar spacing dhkl (and lattice parameters) through Bragg's law:  [3]. In X-ray diffraction tomography (XDT), the pencil beam is translated across the specimen, producing ‘projection’ image data, and the process is repeated for the projection angles required for reconstruction. Often a scalar, additive quantity is required for each raster scan location as an input to the reconstruction algorithms, and the conventional approach is to integrate the diffraction rings radially, converting the two-dimensional (2D) diffraction patterns into one-dimensional (1D) radial diffraction patterns. Each 2θ bin then produces a separate reconstruction I2θ(x,y) of the sample's cross section, where I is the intensity of the volume element or voxel at position x, y within the slice. Then, for a single x, y one can combine I from the different 2θ reconstructions to produce a 1D diffraction pattern for that voxel.
Analytical methods like filtered back projection (FBP) [4] have been the traditional methods of choice for reconstructing the 3D crystallographic phases within a specimen. While FBP provides fairly quick and robust results, the reconstruction quality is severely affected with increasing undersampling and noise. Statistical approaches, on the other hand, often provide better quality images, because they allow for incorporating better models of the imaging physics and also allow for using prior information about possible solutions when the data are incomplete [5]. This provides a great flexibility in inverse modelling when dealing with sub-optimal data acquisition schemes. Many similar problems are formulated by modelling a cost function corresponding to a probability distribution over model parameters, and the goal is to obtain the maximum a posteriori (MAP) model estimates that are consistent with existing data and prior assumptions about the solution [6–8]. In this paper, a similar approach is proposed for XDT for reconstructing 3D spatial distribution of crystallographic phases and orientations of polycrystalline materials. The approach maximizes the a posteriori density which includes a Poisson log-likelihood and a priori term that reinforces expected solution properties such as smoothness or local continuity [9]. The reconstruction method is validated with experimental data acquired from a section of the spinous process of a porcine vertebra to image the spatial crystalline orientations in the sample. The advantage of this approach is that the prior knowledge such as smoothness or roughness can be imposed on the reconstructed diffraction patterns, which in turn improves the accuracy of the reconstructed phases.
Similar to other statistical iterative algorithms, the proposed method also demands significant computational resources in order to obtain reconstructions within a reasonable time. Each iteration requires solution of the forward problem, which calculates the Radon integrals along each beam path for a given diffraction angle. This process is a highly compute-intensive task and needs efficient parallel algorithms and high-end computing systems. We implemented our reconstruction algorithms on a high-performance data-intensive computing middleware [10] and performed image reconstruction at Argonne Leadership Computing Facility. Specifically, we ran our experiments on Mira, a 10-petaflops IBM Blue Gene/Q system. We used up to 1200 nodes where each node consists of 16 physical cores (19 200 cores in total) and 16 GiB memory, and HDF5 data format for parallel data I/O [11]. The execution time of 3D reconstruction takes only about 240 ms per single MAP iteration on average including I/O operations, which indicates that the reconstruction can be performed near real time. The following sections describe the performed diffraction experiment, and the individual data processing steps to obtain the final crystalline phases of the material.
2. Material and methods
(a). Measurement set-up
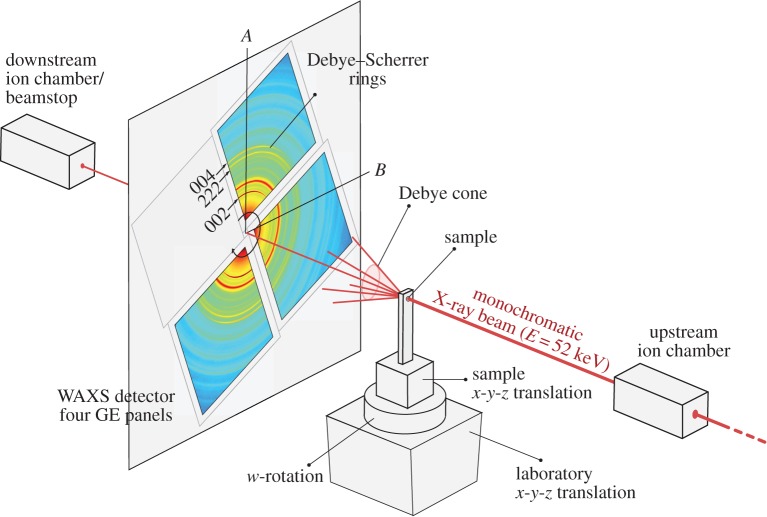
XDT measurements were acquired from a spinous process of a porcine vertebra acquired at the 1-ID-C beamline of the Advanced Photon Source, at Argonne National Laboratory, using an X-ray energy of 52 keV formed by an undulator and brilliance-preserving monochromator (see figure 1 for schematic illustration). The X-ray beam was horizontally defined by slits along B-axis, and vertically focused along A-axis using refractive lenses to provide a beam size of 25×50 (A–B) μm at the sample location. Diffraction data were recorded using four GE RT-41 panels, arranged as shown in figure 1 to collect different portions of Debye rings, nominally perpendicular to the direct beam, and at a sample–detector distance of 2165 mm. The detectors were calibrated (tilt/beam centre) using a National Institute of Standards and Technology ceria standard. To collect an XDT dataset for a given layer (A-position), detector images were taken at 1 s intervals, over 180° in w at 2° steps (Nw=91). The sample was then translated 200 μm along B-axis and this process repeated for a total of 110 positions (NB=110) to cover the entire sample cross section, for a total collection time of about 3 h per layer. Multiple layers (NA=5) were recorded; here we focus on results from a single layer.
Figure 1.
Schematic of synchrotron instrumentation at the 1-ID-C beamline in the Advanced Photon Source, at Argonne National Laboratory. High-energy X-rays incident on the sample are forward-scattered into Debye cones, which are measured with four GE detectors. The sample is translated along B-axis and rotated in w to provide diffraction tomography data. Transmission data are collected simultaneously with ion chambers before and after the sample. (Online version in colour.)
(b). Data preprocessing
The recorded intensity maps at a particular beam position are shown in figure 2. At first, the input data are transformed from polar to Cartesian coordinates to perform radial integration over the highlighted triangular regions around the vertical and horizontal directions. The radial positions are then transformed to d-spacings using geometric parameters given in the previous section. Often the powder diffraction curve follows a smooth trajectory along the radial direction, consisting of Bragg peaks resting on a smooth background. This can be mathematically expressed by
 |
2.1 |
According to this expression, the measured intensity I has both a contribution from the background signal Ib, and each of the Bragg reflections Ip near peak locations. Note that the background signals are considered as statistically independent from the crystalline diffraction processes. This allows for a straightforward background subtraction over a specified range as follows:
 |
2.2 |
where r and η are the total number of pixels in radius and azimuth axes, respectively, and the term in brackets is the background. The scalar e determines the number of boundary pixels on each side of the radial image to be used for calculation of the background, and usually selected a few pixels in size. In this expression, we assume the approximation  holds, which is generally a valid argument assuming slow variations in background intensity. These
  values, i.e. the background corrected intensity distributions for each diffraction, are then used for tomographic image reconstruction as described in the next section.
Figure 2.
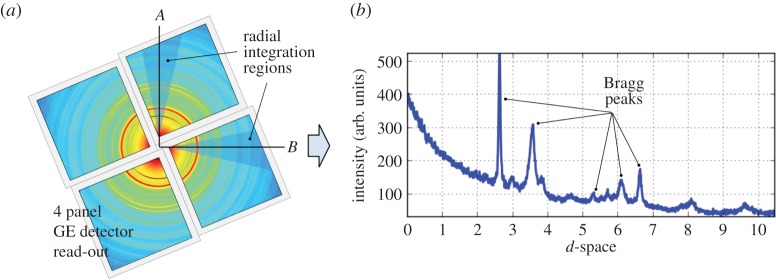
(a) Powder diffraction measurement that was recorded using four GE RT-41 panels at a particular beam position. A radial integration is performed along the highlighted vertical (A-axis) and horizontal (B-axis) directions to obtain the corresponding 1D diffraction patterns at each beam position. (b) Often this pattern follows a smooth trajectory along the radial direction, consisting of Bragg peaks resting on a smooth background. (Online version in colour.)
(c). Image reconstruction
This section describes the process of reconstructing the crystalline phases for each point in the sample from the background corrected diffraction data. We formulate the problem in an MAP framework by combining the data likelihood and prior terms, which leads to a discrete optimization problem in the general form of [12]
| 2.3 |
where xMAP is the so-called MAP estimate.  and
and  are, respectively, the discrete model and data parameters. The objective function consists of a Poisson log-likelihood
  and prior terms
  to regularize variations among the local neighbourhood of the model parameters. The regularization parameter β is to control the trade-off between the data likelihood and the prior terms. The MAP estimator formulated in this way can also be interpreted as a penalized maximum-likelihood estimator [13]. With this approach, instead of directly maximizing the data likelihood [14], a number of prior terms can be used to reinforce desired (e.g. smoothness, sharpness) and or certain (e.g. non-negativity) properties of the solution [15]. A common form of a prior term is [16]
 |
2.4 |
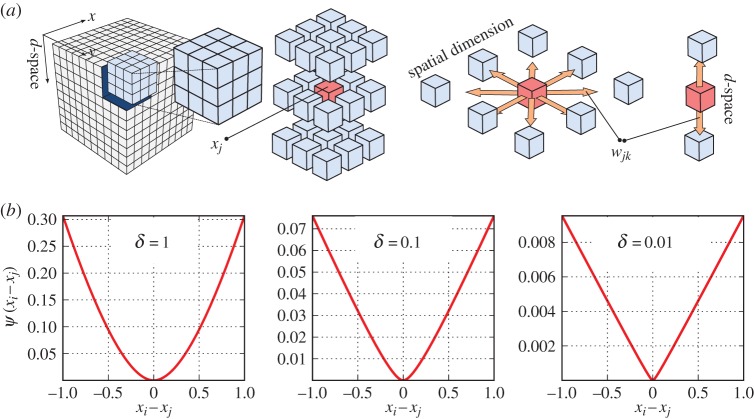
where ψ(.) is a user-defined functional with dependency only on the difference values of parameters in a set of voxels (N) in a neighbourhood of the ith voxel, that is, eight neighbouring voxels in the spatial cross section, and two voxels in the neighbouring d-spacings (see figure 3 for a visual illustration of the prior model). The constants wij are non-negative weights that satisfy wij=wji for all i and j. The weights are normally set inversely proportional to the Euclidean distance between the neighbouring voxels. Often, ψ(x) is selected from monotonically non-decreasing functions of quadratic forms, that is, (xi−xj)2, which leads to smooth images while greatly reducing the likelihood of sharp transitions of the model parameter across adjacent voxels. Non-quadratic forms can as well be used, particularly to favour preservation of sharp boundaries. In this paper, we used the following function [17]:
| 2.5 |
which provides smooth solutions for large δ values, but favours piecewise-constant structures for finite values of δ, thus allowing either a quadratic or a quasi-linear model to describe parameter variations. Owing to the contributions from both instrument and sample-dependent factors, powder diffraction patterns generally show a broadening of the Bragg peaks, and can be modelled as smooth functions [18]. Thus, a natural choice for the solution is to use larger δ values to impose smoothness in the diffraction domain (i.e. d-space) and to use smaller δ for the spatial domain. A closed form expression for the solution of the optimization problem was obtained using the optimization transfer principle [19] (see appendix A for details).
Figure 3.
(a) A 3D ‘data cube’ (with 2D spatial and 1D d-space variations), and the interactions among neighbouring voxels in spatial coordinates and d-spacings. (b) The regularization function for various δ values. (Online version in colour.)
(d). Image analysis
After the diffraction data are fully reconstructed, an identification procedure is applied along the radial axis to determine individual crystalline phases. Typically, a region-of-interest (ROI) analysis by summing the values along a given azimuthal range is sufficient to localize known phases. The following expression describes the process:
 |
2.6 |
where K is used for indexing the phases, xi is the reconstructed scalar value of a given pixel, rs and rf are the starting and ending radii of a given ROI, with Δr as the corresponding difference. Similar to the background subtraction in the preprocessing phase, the second term in the brackets is the contribution from a slowly changing background, and e is used to determine the number of boundary pixels on each side of the radial image. The final phase reconstructions associated with various ROIs can be constructed by forming an image by assembling the xi values in a 2D image matrix in spatial cross section of the specimen.
3. Results
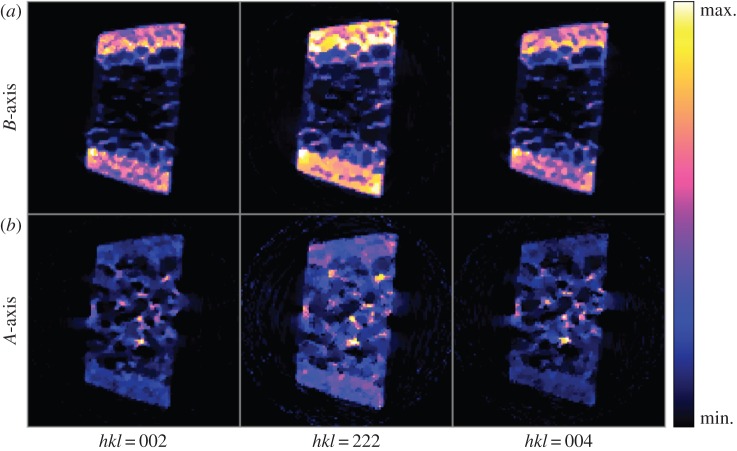
We initially performed radial integrations in the vertical and horizontal directions on image data to obtain individual 1D diffraction patterns for every beam scan position (as previously described in figure 2). We then removed the background from diffraction data using equation (2.6) with e=3. This provided 3D projection data (2D for the spatial dimensions, and 1D for the d-space) as input to the reconstruction algorithm. The voxel sizes for the corresponding input data were 200 μm and 5 millidegrees in spatial and diffraction dimensions, respectively. MAP reconstructions are obtained after 200 iterations, and the results are presented in figure 4. The resolutions of data and reconstruction model parameters were 93×1200×110 (projections, d-spacings, raster locations) and 155×155×1200 (grid size, grid size, d-spacings), respectively. The cross-sectional image corresponds to the reconstruction at 2θ=3.59° on vertical axis. Figure 4b and figure 4c, respectively, correspond to the reconstructed vertical and horizontal diffraction patterns at a particular voxel within the specimen highlighted with the red arrow. The plots clearly demonstrate the differences between diffraction patterns along vertical (figure 4b) and horizontal (figure 4c) directions, particularly at the Bragg peaks of hkl=002, 004 and 222. Figure 5 shows the effect of algorithm parameters (i.e. β and δ) on reconstructed images. Larger δ values lead to smoother images, whereas using smaller δ values provides sharp and clear images. With increased regularization, i.e. for larger β values, the corresponding effect is amplified. Figure 6 shows the comparison of MAP estimation with the conventionally used FBP method for different undersampling or data compression ratios. We used the regridding algorithm for FBP implementation, where the interpolations are carried out in the Fourier domain rather than in spatial domain [20]. Aliasing and streaking artefacts are clearly visible in images obtained with FBP, even when using the complete dataset with 93 projections. MAP reconstruction removed these artefacts, while preserving a remarkable image sharpness. Reducing data sizes by two and four times did not produce significant quality degradation in MAP reconstruction, and maintained good image quality even with data having as low as 24 projections. Figure 7 shows the crystallographic phases for hkl=002, 004 and 222 that were obtained by integrating the corresponding Bragg peaks according to equation (2.6). The external cortex is present on opposite sides of the specimen and is where muscles attach. The interior of the specimen contains trabeculae which brace the cortex. The cortical and trabecular bone experience very different loading states in vivo and are expected to possess very different carbonated hydroxyapatite (cAp) preferred orientations, i.e. hkl=002,222.
Figure 4.

Image (a) corresponds to the reconstruction of the cross section at 2θ=3.59°. The plots (b,c) are the reconstructed diffraction patterns at a particular voxel pointed with the red arrow on image (a). The reconstructed Bragg peaks for hkl=002, 004 and 222 are highlighted with arrows on the plots. (Online version in colour.)
Figure 5.
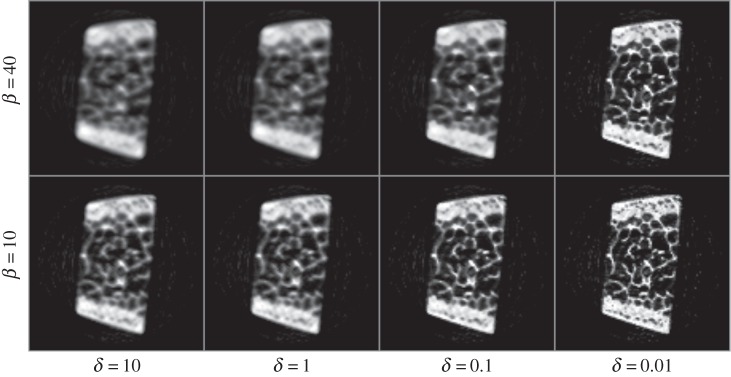
Demonstration of the effect of algorithm parameters (i.e. β and δ) on reconstructed images.
Figure 6.
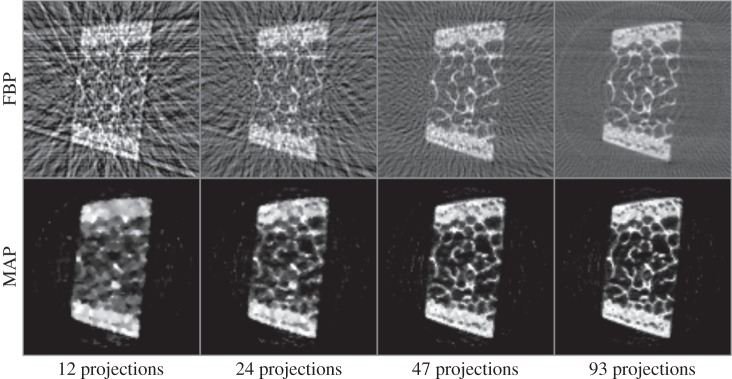
Comparison of MAP reconstruction with FBP for different undersampling ratios.
Figure 7.
Reconstructed crystallographic phases for hkl=002, 004 and 222 from the integrated areas of the associated Bragg peaks. Phases obtained by integrating the corresponding Bragg peaks within the reconstructions for the (a) vertical and (b) horizontal diffraction directions. The external cortex is present on opposite sides of the specimen and is where muscles attach. The interior of the specimen contains trabeculae which brace the cortex. The cortical and trabecular bone experience very different loading states in vivo and are expected to possess very different carbonated hydroxyapatite (cAp) preferred orientations. (Online version in colour.)
4. Discussions
Absorption-based reconstructions are widely used in bone studies and have added greatly in the understanding of degraded bone structures in maladies as diverse as osteoporosis and osteolytic lesions in bone metastases. As discussed above, XDT of bone provides very different information compared to that of absorption tomography, not just where the bone mass is present but how that mineral is organized. Preferred orientation of mineral (nanoplatelets of cAp) within bone, for example, greatly affects functionality and is an important input for numerical models. One could section the specimen and quantify mineral orientation versus position via a raster scan, but that would not allow repeated non-invasive interrogation of the sample as it was loaded. The specimen is of interest from a biomineralization standpoint, as it exhibits considerable heterogeneity including crystallographic texture, but also from the perspective of developing XDT.
One challenge in inverse modelling of X-ray tomographic data is that the samples may come in various shapes, features, and properties. This necessitates having a wider range of priors, or constraints, that must individually be set according to the sample type for optimal results. The proposed MAP approach for X-ray tomography allows the necessary flexibility for defining priors on general model properties like smoothness, edginess, non-negativity, etc., and also the inclusion of other non-trivial prior distributions by training to further reveal the subtle local statistics about the sample (e.g. porosity, crack propagation, fluid diffusion, etc.). Currently, we are exploring ways for classifying high-dimensional X-ray datasets and samples, not only for the case of XDT, but also for other tomographic techniques like X-ray fluorescence tomography [21] and time-resolved micro-computed tomography [22].
Another challenge is the optimal selection of regularization parameters (e.g. β and δ in this case) that yield the desired image. Automatic parameter optimization is very desirable for an easy use of the algorithm, since, as for many iterative methods, this one also requires the solution of the inverse problem many times, and this is computationally not very feasible for practical datasets. Therefore, we typically set the parameters heuristically based on experience. However, we noted that a ratio of these two parameters can be used to simplify the parameter tuning process. Usually, a β/δ ratio between 100 and 1000 gives satisfactory results.
Smart tomographic systems with integrated software (i.e. reconstruction algorithm) and instrument control software are of particular interest allowing for the optimization of experimental parameters while data are being collected. XDT is particularly suitable for such in situ and in transit data analysis, because the data acquisition is typically slow due to the raster scanning of the sample with a pencil beam. An integrated approach, launching MAP iterations during data collection on a subset of data, will progressively reduce the uncertainty of the reconstructions at each iteration when new data are available. This combined approach of data acquisition and data analysis allows for many new possibilities in the optimal design of experiments, and in the overall improvement of the experiment efficiency.
5. Conclusion
In this paper, we introduced a MAP approach for XDT to perform 3D reconstruction of crystallographic phases and orientations of polycrystalline materials. This multidimensional inversion approach is to yield the full diffraction spectrum for each spatial voxel in the sample, and avoids conventional reconstruction artefacts. We tested the reconstruction method with experimental diffraction data acquired from a bone sample. The preliminary results show significant improvement on reduction of aliasing and streaking artefacts, and robustness to noise and undersampling than the conventional analytical inversion approaches. Future work includes using factorization methods to better represent model–data relationships, and to further improve the computational efficiency of the algorithm.
Appendix A
Optimization transfer refers to the methods which replace the original cost function, like given in expression (2.3), at each step with an alternative or surrogate function, which when maximized is guaranteed to also increase the value of the original function [13]. Here we only present the update equations of the algorithm, but one can refer to [19] for details.
 |
A 1 |
 |
A 2 |
 |
A 3 |
 |
A 4 |
where  (note that ψ(x) is given in equation (2.5)). It is implicitly assumed that F(k)=0 if β=0. When β=0, the iteration is equivalent to the maximum likelihood expectation-maximization solution. The presented MAP algorithm is publicly available as part of the TomoPy software package [23].
Funding statement
This research used resources of the US Department of Energy (DOE) Office of Science User Facilities operated for the DOE Office of Science by Argonne National Laboratory under contract no. DE-AC02-06CH11357. S.R.S. acknowledges support from NICDR grant no. DE001374.
References
- 1.Abbey B, Hofmann F, Belnoue J, Rack A, Tucoulou R, Hughes G, Eve S, Korsunsky AM. 2011. Mapping the dislocation sub-structure of deformed polycrystalline Ni by scanning microbeam diffraction topography. Scr. Mater. 64, 884–887. ( 10.1016/j.scriptamat.2011.01.024) [DOI] [Google Scholar]
- 2.Cullity BD, Stock SR. 2001. Elements of X-ray diffraction. Upper Saddle River, NJ: Prentice Hall. [Google Scholar]
- 3.Dinnebier RE, Billinge SJL. (eds). 2008. Powder diffraction: theory and practice. Cambridge, UK: RSC Publishing. [Google Scholar]
- 4.Kak AC, Slaney M. 2001. Principles of computerized tomographic imaging. Philadelphia, PA: SIAM. [Google Scholar]
- 5.Kaipo J, Somersalo E. 2004. Statistical and computational inverse problems. New York, NY: Springer. [Google Scholar]
- 6.Geman S, Geman D. 1984. Stochastic relaxation, Gibbs distributions, and the Bayesian restoration of images. IEEE Trans. Pattern Anal. 6, 721–741. ( 10.1109/TPAMI.1984.4767596) [DOI] [PubMed] [Google Scholar]
- 7.Besag J. 1986. On the statistical analysis of dirty pictures. J. R. Stat. Soc. 48, 259–302. ( 10.2307/2345426) [DOI] [Google Scholar]
- 8.Tarantola A. 2004. Inverse problem theory and methods for model parameter estimation. Philadelphia, PA: SIAM. [Google Scholar]
- 9.Green PJ. 1990. Bayesian reconstructions from emission tomography data using a modified EM algorithm. IEEE Trans Med. Imaging 9, 84–93. ( 10.1109/42.52985) [DOI] [PubMed] [Google Scholar]
- 10.Biçer T. 2014. Supporting data-intensive scientific computing on bandwidth and space constrained environments. PhD dissertation, Ohio State University, USA. [Google Scholar]
- 11.De Carlo F. et al.2014. Scientific data exchange: a schema for HDF5-based storage of raw and analyzed data. J. Synchrotron Radiat. 21, 1224–1230. ( 10.1107/S160057751401604X) [DOI] [PubMed] [Google Scholar]
- 12.Hansen PC. 2010. Discrete inverse problems: insight and algorithms. Philadelphia, PA: SIAM. [Google Scholar]
- 13.De Pierro A. 1995. A modified expectation maximization algorithm for penalized likelihood estimation in emission tomography. IEEE Trans. Med. Imaging 14, 132–137. ( 10.1109/42.370409) [DOI] [PubMed] [Google Scholar]
- 14.Shepp LA, Vardi Y. 1982. Maximum likelihood reconstruction for emission tomography. IEEE Trans. Med. Imaging 1, 113–122. ( 10.1109/TMI.1982.4307558) [DOI] [PubMed] [Google Scholar]
- 15.Qi J, Leahy RM. 2006. Iterative reconstruction techniques in emission computed tomography. Phys. Med. Biol. 51, R541 ( 10.1088/0031-9155/51/15/R01) [DOI] [PubMed] [Google Scholar]
- 16.Moussouris J. 2014. Gibbs and Markov random systems with constraints. J. Stat. Phys. 10, 11–33. ( 10.1007/BF01011714) [DOI] [Google Scholar]
- 17.Lange K. 1990. Convergence of EM image reconstruction algorithms with Gibbs smoothing. IEEE Trans. Med. Imaging 9, 439–446. ( 10.1109/42.61759) [DOI] [PubMed] [Google Scholar]
- 18.Rietveld HM. 1969. A profile refinement method for nuclear and magnetic structures. J. Appl. Cryst. 2, 65–71. ( 10.1107/S0021889869006558) [DOI] [Google Scholar]
- 19.Chang JH, Anderson JMM, Votaw JR. 2004. Regularized image reconstruction algorithms for positron emission tomography. IEEE Trans. Med. Imaging 23, 1165–1175. ( 10.1109/TMI.2004.831224) [DOI] [PubMed] [Google Scholar]
- 20.Dowd BA, Campbell GH, Marr RB, Nagarkar V, Tipnis S, Axe L, Siddons DP. 1999. Developments in synchrotron X-ray computed microtomography at the National Synchrotron Light Source. Proc. SPIE 3772, 224–236. ( 10.1117/12.363725) [DOI] [Google Scholar]
- 21.Gürsoy D, Biçer T, Lanzirotti A, Newville MG, De Carlo F. 2015. Hyperspectral image reconstruction for X-ray fluorescence tomography. Opt. Express 23, 9014–9023. ( 10.1364/OE.23.009014) [DOI] [PubMed] [Google Scholar]
- 22.Duke DJ, Swantek AB, Sovis N, Tilocco FZ, Gürsoy D, Powell CF. 2015. Time-resolved X-ray tomography of gasoline direct injection sprays. JSAE/SAE Powertrains, Fuels and Lubricants International Meeting, Kyoto, Japan.
- 23.Gürsoy D, De Carlo F, Xiao X, Jacobsen C. 2014. TomoPy: a framework for the analysis of synchrotron tomographic data. J. Synchrotron Radiat. 21, 1188–1193. ( 10.1117/12.2061373) [DOI] [PMC free article] [PubMed] [Google Scholar]


