

Abstract
Recovery of natural populations occurs often with simultaneous or subsequent range expansions. According to population genetic theory, genetic structuring emerges at the expansion front together with decreasing genetic diversity, owing to multiple founder events. Thereupon, as the expansion proceeds and connectivity among populations is established, homogenization and a resurgence of genetic diversity are to be expected. Few studies have used a fine temporal scale combined with genetic sampling to track range expansions as they proceed in wild animal populations. As a natural experiment, the historical eradication of large terrestrial carnivores followed by their recovery and recolonization may facilitate empirical tests of these ideas. Here, using brown bear (Ursus arctos) as model species, we tested predictions from genetic theory of range expansion. Individuals from all over Finland were genotyped for every year between 1996 and 2010 using 12 validated autosomal microsatellite markers. A latitudinal shift of about 110 km was observed in the distribution and delineation of genetic clusters during this period. As the range expansion proceeded, we found, as theory predicts, that the degree of genetic structure decreased, and that both genetic variation and admixture increased. The genetic consequences of range expansions may first be detected after multiple generations, but we found major changes in genetic composition after just 1.5 generations, accompanied by population growth and increased migration. These rapid genetic changes suggest an ongoing concerted action of geographical and demographic expansion combined with substantial immigration of bears from Russia during the recovery of brown bears within the large ecosystem of northern Europe.
Keywords: brown bear, Ursus arctos, DNA, population, spatial, temporal
1. Introduction
Range expansions, retractions and shifts are reported from a multitude of species from various different taxa [1–4]. Identifying the genetic mechanisms and patterns associated with changes in the geographical ranges of species is a challenge in conservation genetics [5–8]. Detailed genetic knowledge may be needed to understand the dynamics and consequences of range shifts and the impact of biological invasions in the light of climate change and human-caused proliferation [2–4,9]. It is also important for making predictions on the progress of population recovery and recolonization following conservation efforts (e.g. when previously isolated populations reconnect again) [10–12]. However, apart from historical events, range expansion processes have not been extensively documented using genetic methods.
Previous studies have suggested that range expansions may lead to changes in population genetic structure and diversity that are different from genetic changes, which are caused by demographic growth alone [5,6,10,11,13–16]. Theoretical studies simulating range expansion have shown that genetic structuring is expected to be initially founded at the expansion front together with decreasing genetic diversity due to repeated bottleneck effects [5,10,11,15,16]. Over time in range expansions new areas are occupied, connectivity among territories may be established and spatial population structure might decrease due to balanced gene flow among populations, causing homogenization and increased genetic diversity within populations [5,10,12]. Range expansions are also characterized by allele surfing and asymmetric introgressions, which may be mistaken as a result of adaptive processes that may similarly change the genetic composition [5,17]. By contrast, pure demographic expansion is expected to maintain stable allele frequencies due to inferior genetic drift compared with stable populations [18], show excess of rare alleles and homozygosity, and have little linkage disequilibrium in the population [5]. Increasing connectivity and population size are both supposed to lead to an increase in genetic diversity and long-term viability of populations eventually [19–21].
Using particularly dedicated sampling designs and appropriate model systems, it may be possible to identify when, where and how genetic changes arise and erode during expansions or contractions. For instance, spatially extensive studies at fine temporal scales may allow for close tracking of the genetic changes as they emerge [12,22,23]. Few population genetic studies have investigated range expansions at a fine temporal scale in nature, especially in wild animal populations and over larger areas [23–26]. Consequently, the empirical relationship between genetic changes and abundance range of a species and population is often ambiguous in wildlife populations. This is especially the case in many larger mammals that experienced extensive population bottlenecks due to extirpation in the past (e.g. [26–28]).
Wild and currently recovering populations of large terrestrial carnivores are potentially good model systems for investigating the processes of population recovery and range expansion. Large predators were persecuted during recent centuries and hunted down to near extinction worldwide (e.g. [28]). In some countries in Europe, populations of large carnivores now seem to be recovering, owing to conservation-driven legislation and controlled harvest. Along with this population growth, an increasing number of individuals have expanded into some areas where they were once extirpated [29]. The historic eradication of large carnivore populations represents natural experiments facilitating analyses of how genetic structure and diversity change temporally as population recovery and expansion proceeds. Demographic and genetic bottlenecks in the past, long generation times and possible conflicts with humans make large carnivore populations still vulnerable [30]. Currently, there is limited knowledge on the population genetic consequences of demographic recovery in large carnivores, especially across broad geographical scales.
Our objective here was to take advantage of the recent carnivore comeback in northern Europe [29] as a model system to investigate the genetic patterns occurring during population recovery and expansion. As model species, we used the brown bear (Ursus arctos) in Finland, owing to the population's central placement and potential role in connectivity between Russian and Scandinavian populations [31–33]. Moreover, observations and hunting bag data indicate that the recovery, growth and geographical expansion of the Finnish brown bear population represent an ongoing process. According to recent data analysed, gene flow from Russia to Finland (i.e. immigration of bears into the southeastern parts of the country) is one of the drivers of the expansion [31].
We used continuous geographical coverage and high temporal resolution during sampling from 1996 to 2010, which corresponds to a time of 1.5 generations in brown bears [34]. On the basis of theoretical simulation studies, we expected to find a higher degree of genetic structure and lower genetic variation at the beginning of the study period. We also expected admixture and genetic diversity due to gene flow among populations to increase as the process of expansion proceeded.
2. Material and methods
(a). Study area
Our study area encompasses the whole of Finland, which has an area of 338 424 km2, and the largest linear distance from south to north is 1160 km (figure 1a). About 86% of the terrestrial area is covered by forest, where pine, spruce and birch are the most common trees. Roughly 25% of the country is covered by lakes. The rest contains mires, farm land, urban areas and some tundra in the northernmost part.
Figure 1.
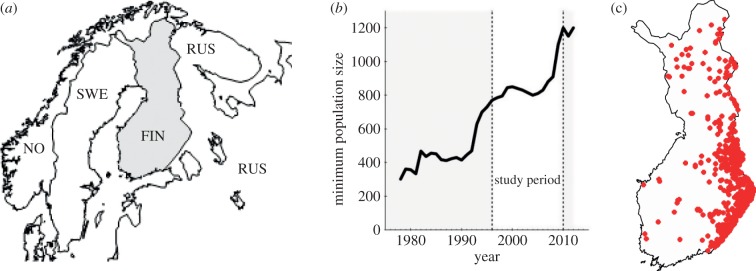
(a) Overview map of northern Europe showing Finland (FIN) and its neighbouring countries Russia (RUS), Sweden (SWE) and Norway (NO). (b) Annual estimates of minimum population size for brown bear in Finland from 1978 to 2012 [35] (data adapted from 2011 and 2012 by the Finnish Game and Fisheries Research). (c) Geographical locations of the 819 brown bear samples collected in Finland during 1996–2010.
(b). Demographic history
The brown bear was distributed throughout Finland at the end of the nineteenth century, and suffered a demographic bottleneck due to persecution between 1875 and 1910, with at least 5500 individuals killed during that time [36]. The remaining population was assumedly very small until it begun to recover 40–50 years later. Estimates based on observations suggest that the remaining population recovered from approximately 150 to approximately 1150–1950 bears between 1963 and 2009 [35]. Bear immigration from Russia has been assumed to have supported the recovery process [37] and the population size increased over the last 30 years (figure 1b). Previous studies on the population structure showed that bears in Finland are subdivided into a northern and southern genetic cluster. Bears in southern Finland and Russian Karelia belong to the same genetic unit and gene flow from the east (Russia) to the west (Finland) appeared to be high [31–33]. Currently, both overall bear density and the proportion of females are highest in the southeast along the Finnish–Russian border [35].
(c). Sampling
Sampling was carried out according to the annual hunting quota of brown bears in Finland, which is based on the number of estimated bears in an area and hunting district [38]. All samples were collected according to this quota (i.e. the number of samples from an area was representative to the estimated number of bears for that area/year). These included tissue samples from 772 legally harvested bears (271 females, 500 males, one unknown sex), and 47 bears (20 females, 27 males) that had been sampled non-invasively. Thus, we analysed a total of 819 bears (figure 1c), collected annually during 1996 through 2010, of which 333 samples from 2005 to 2010 were used previously in spatial genetic analyses [31,32].
(d). Molecular analysis
Tissue samples were stored in 95% ethanol until extraction with DNeasy Tissue Kit (Qiagen) following the manufacturer's instructions. For genotyping, we used 12 dinucleotide markers (short-tandem-repeats, STRs) developed for bears: G1A, G1D, G10B, G10L [39,40], Mu05, Mu09, Mu10, Mu15, Mu23, Mu50, Mu51 and Mu59 [41]. This particular set of markers has been applied and validated for sensitivity, precision and statistical power previously [31–33,42]. The protocols for PCR and fragment analysis followed Andreassen et al. [42]. Our laboratory procedures followed the guidelines for the analysis of non-human forensic DNA material [42,43]. We verified the uniqueness of all genotypes by calculating their probability of identity using the software Gimlet v. 1.3.3 [44]. Possible genotyping errors due to stuttering or large allelic dropout and presence of null alleles were tested with Micro-Checker v. 2.2.3 [45].
(e). Population structure
To study population structure in the Finnish bear population, we used the individual-based Bayesian clustering approach Structure v. 2.3.3 [46]. Since earlier studies have shown a restricted number of genetic clusters in Finland [31–33,47], we used a maximum number of K = 10 clusters, and assumed population admixture and correlated allele frequencies within the population. Ten independent runs for each K-value between one and 10 were performed. For each run, we set a burn-in period of 100 000 Markov chain Monte Carlo (MCMC) iterations, followed by sampling of 1 000 000 iterations. The results were post-processed with the ad hoc approach of Evanno et al. [48] to estimate the number of genetic clusters in the lowest hierarchical level. This approach identified one clearly most supported model of spatial genetic structure, which returned a consistent between-run cluster assignment of the individuals, and was used as a basis for all further analyses and inferences. We used a membership coefficient of q > 0.7, as this has been applied in earlier population genetic studies on bears [31–33,47,49].
(f). Temporal changes in population structure and genetic diversity
To reveal temporal changes in genetic parameters describing the population genetic diversity and structure, we estimated the following parameters for each clusters suggested by the program Structure [46] on a yearly basis. We used Spagedi v. 1.3 [50] to investigate possible isolation by distance (IBD) among pairs of brown bears for each year of harvest using the kinship coefficient by Loiselle et al. [51]. Arlequin v. 3.5.1.2 [52] was used to estimate pairwise FST-values between clusters, number of alleles, and expected and observed heterozygosities. Allelic richness was estimated with FSTAT v. 2.9.3.2 software [53]. We estimated inbreeding coefficients with Genetix v. 4.05.2 software [54]. Deviations from Hardy–Weinberg equilibrium were tested for all loci and genetic clusters in Genepop v. 4.0 [55]. The tests used unbiased p-values by a Markov chain method of 1000 burn-in iterations, 500 batches and 1000 iterations per batch. We estimated the number of migrants per generation (corrected for sample size) using private allele method [56] implemented in Genepop. We tested for linkage disequilibrium between pairs of loci with software Genetix v. 4.05.2 [54] using the method of Black & Krafsur [57]. We then performed linear regressions of the parameters from the annual analyses against year of harvest using the R statistical package [58]. The annual mean latitude for the detected clusters was regressed against year of harvest to test for directional movement (i.e. range expansion).
(g). Temporal relationships between changes in population structure and population size
In a final step, we investigated the temporal relationship between population size and genetic structure parameters. We related annual estimates of pairwise FST-values and number of migrants detected using the private allele method (see above) between clusters to the annual bear population size estimates, which are reported each year by the Finnish Game and Fisheries Research Institute. These estimates are based on the observed number of females with cubs-of-the-year using sightings recorded by 1700 large carnivore contact persons, and data on movements and home ranges by GPS-collared females followed by the cubs-of-the-year. Population size estimates are achieved by multiplying the number of the litters-of-the-year by 10 [59].
3. Results
(a). Population structure
Prior to Bayesian cluster assignment, the 819 bears were grouped according to year of harvest into three temporal samples of 5 years: 1996–2000 (n = 247), 2001–2005 (n = 286) and 2006–2010 (n = 286). Five years is approximately equivalent to the average age of primiparity of female Scandinavian bears (4.8 ± 0.7 years [60]). As expected from earlier studies [31,47], Bayesian cluster assignment of the individuals identified two genetic clusters in each temporal sample (figure 2a; electronic supplementary material, figure S1a–c), but indicated both increasing admixture (figure 2a) and increasing geographical overlap (figure 2b) between these clusters during the study period. Further, while one cluster was spread throughout the country, the other cluster was restricted to the southern part (figure 2b). Genotypes which were not assigned unambiguously to the identified clusters (membership coefficient q < 0.7, 68% males and 32% females; 1996–2000: 21, 8.5%; 2001–2005: 34, 11.9%; 2006–2010: 40, 14.0%) were also located mainly in southern Finland (figure 2b). We hereafter refer to the two genetic clusters identified as the ‘northern’ and ‘southern’ subpopulations, which corresponds to previously published studies [31,47].
Figure 2.

(a) Results from Bayesian cluster assignment for K = 2 clusters with the program Structure [46] of 819 brown bears in Finland grouped according to year of harvest into three temporal samples. The y-axis shows the estimated cluster membership coefficient (q). Individuals are sorted by latitude from north (left) to south (right). Green represents the ‘northern’ cluster, blue the ‘southern cluster’. (b) Maps of individual bear sample locations with cluster membership indicated by colour: Green dots, ‘northern’ cluster; blue dots, ‘southern cluster’, whereas brown dots represent genotypes which could not be assigned unambiguously (q < 0.7) to any of the populations.
(b). A northwards geographical shift of the northern and southern subpopulations with time
The annual mean latitude of both genetic clusters, and hence also the delineation between them, shifted northwards with about 1° latitude, or 7.4 km per year during the study period (figure 3a–c; electronic supplementary material, tables S1 and S4). Further, the average latitude of bears assigned ambiguously also shifted northwards (figure 3b).
Figure 3.

(a–c) Range expansion in the Finnish brown bear population during 1996–2010 as indicated by directional changes in the relationship between annual mean latitude of the detected genetic clusters and year of harvest: (a) southern subpopulation (b = 0.088 (CI 0.060, 0.166); R2 = 0.76; p < 0.001); (b) individuals not assigned unambiguously (q < 0.7); (c) northern subpopulation (b = 0.086 (CI 0.032, 0.139); R2 = 0.44; p < 0.01). (d–f) Temporal changes in parameters describing the population genetic structure of the Finnish brown bear population: (d) pairwise FST between the two subpopulations (b = −0.002 (CI −0.002, −0.001); R2 = 0.71; p < 0.001); (e) proportion of individuals assigned ambiguously (q < 0.7) to both of the two subpopulation (b = 0.054 (CI 0.005, 0.105), z = 2.12; p < 0.05); (f) number of migrants per generation between the two subpopulations (b = 0.090 (CI 0.042, 0.138); R2 = 0.52; p < 0.01).
(c). Temporal changes in population structure and genetic diversity
As the geographical range shift proceeded, there were several associated changes in population genetic structure. The pairwise FST between the northern and the southern clusters declined from 0.05 to 0.01 (p < 0.001; figure 3d; electronic supplementary material, tables S2 and S4). The proportion of individuals that was not clearly assigned to either subpopulation (membership coefficient q < 0.7) increased by 5% (figure 3e; electronic supplementary material, tables S1 and S4). The estimated number of migrants per generation between the subpopulations increased from 1.6 to 3.6 (p < 0.01; figure 3f; electronic supplementary material, tables S3 and S4). Furthermore, genetic structure was influenced by IBD (figure 4a), but the degree of IBD displayed a temporal change across years (figure 4b–d). The average kinship across the Finnish population among individuals at the mean geographical distance (approx. 418 km) increased (figure 4b), documenting that genetic differentiation occurred at increasingly longer distances. Moreover, the intercepts and slopes from the annual IBD models showed, respectively, a temporal decrease (figure 4c), pointing to gradually increasing admixture locally, and a temporal increase (figure 4d), indicating that the average kinship across population decreased slower with geographical distance with time. Thus, the overall result suggested gradually decreasing genetic structuring between subpopulations closely tracking the ongoing range expansion.
Figure 4.
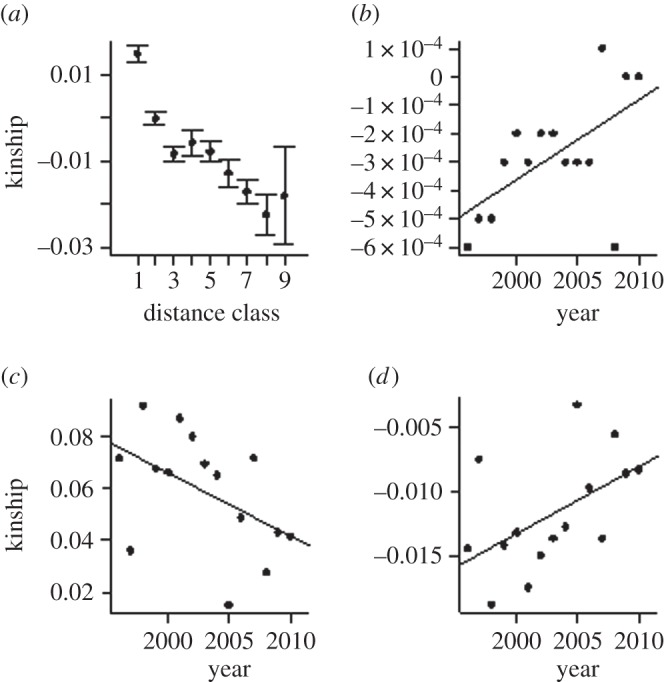
Temporal development in parameters describing isolation by distance (IBD; i.e. the relationship between kinship and geographical distance) in the Finnish brown bear population during 1996–2010. (a) Mean annual IBD for average distances classes 1–9 (approx. 54–833 km). (b) Mean kinship across the population at the mean geographical distance (approx. 418 km) (b = 2.8 × 10−05 (CI = 5.54 × 10−06, 5.09 × 10−05); R2 = 0.3572; p < 0.019). (c) Intercepts from the annual IBD models (b = −0.0024 (CI −0.0050, 0.00016); R2 = 0.24; p < 0.063). (d) Slopes from the annual IBD models (b = 0.000514 (CI 0.000021, 0.0010); R2 = 0.28; p < 0.042).
Additionally, the range expansion process was associated with changes in genetic diversity. While being temporally stable in the northern subpopulation, both HE (p < 0.001) and HO (p < 0.01) increased gradually over the years in the southern subpopulation (figure 5a,b; electronic supplementary material, tables S3 and S4). The average number of different alleles for the 12 STRs showed a similar pattern, increasing gradually across years in the south, from A = 6.1 to A = 7.6 (p < 0.01; figure 5c; electronic supplementary material, tables S3 and S4). However, no temporal change in allele numbers was detected in the north (figure 5d; electronic supplementary material, tables S3 and S4). The results on allelic richness indicated an increase in the southern cluster, while being stable in the northern cluster, but these observations were not statistically significant (figure 5e,f; electronic supplementary material, tables S3 and S4). Inbreeding coefficients were generally low and did not indicate any temporal change, although four loci showed positive overall FIS (electronic supplementary material, tables S3 and S4). After sequential Bonferroni correction, significant linkage disequilibrium (p < 0.01) was detected in 23, 21 and 3 out of 66 marker pairs in the temporal samples 1996–2000, 2001–2005 and 2006–2010, respectively. Two marker pairs within temporal samples 1996–2000 (MU05–MU59, G1D–MU59) and 2001–2005 (MU05–MU09, MU51–G10L) showed linkage disequilibrium across both clusters identified. For all other marker combinations, significant linkage disequilibrium found was not consistent across all samples and all genetic clusters found.
Figure 5.
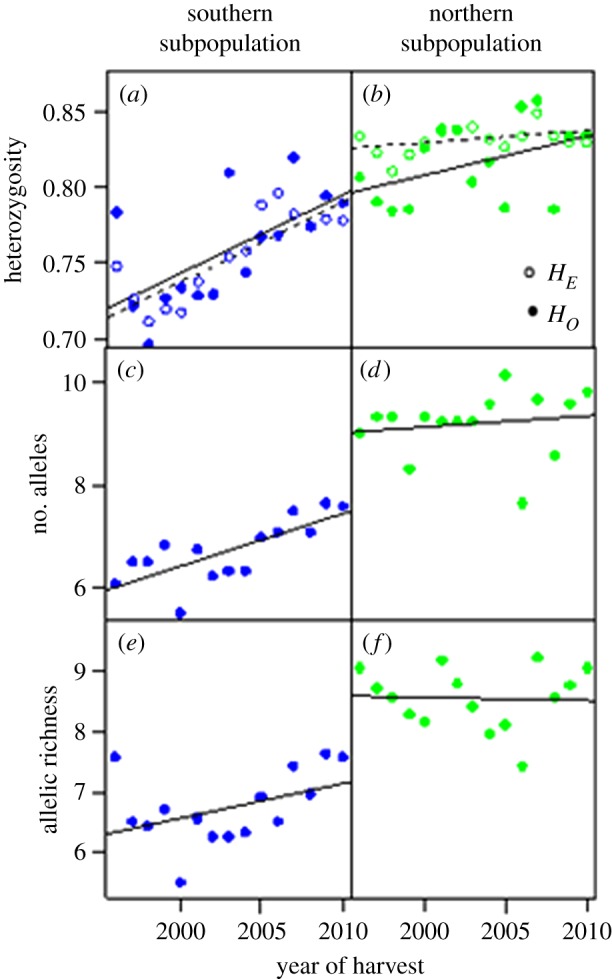
Annual change in genetic diversity parameters during 1996–2010 in the Finnish brown bear population (n = 819). (a,b) Expected and observed heterozygosity: southern subpopulation (HE: b = 0.0055 (CI 0.0035, 0.0075); R2 = 0.73; p < 0.001, HO: b = 0.0061 (CI 0.0028, 0.0093); R2 = 0.55; p < 0.01) and northern subpopulation (n.s. for both HE or HO). (c,d) Number of alleles per locus: southern subpopulation (b = 0.103 (CI 0.050, 0.157); R2 = 0.54; p < 0.01) and northern subpopulation (n.s.). (e,f) Allelic richness: southern subpopulation (n.s.) and northern subpopulation (n.s.).
(d). Temporal relationships between changes in population structure and population size
Finally, we explored if population growth may be the driving force behind the observed range expansion process and the associated temporal genetic changes. Bear population size estimates (minimum and total) in Finland, as well as the number of legally shot bears, increased between 1996 and 2010 (figure 6a–c). The increase in population size occurred mainly during the last 3–5 years of the study, with little or no increase the first 10–12 years (figure 6a,b). The numbers of legally shot bears were very stable from 1996 to 2006, while more recently they showed an increase (figure 6c). We found that increasing population size was associated with decreasing annual pairwise FST between the subpopulations (p = 0.054; figure 6d; electronic supplementary material, table S4) and with increasing estimated yearly number of migrants between the subpopulations (p < 0.001; figure 6e; electronic supplementary material, table S4). However, these correlations showed a lot of residual scatter compared with correlations using year of harvest as explanatory variable (see above), indicating that population growth alone was not a good predictor of the observed genetic changes.
Figure 6.

(a,b) Annual population size estimates for brown bear in Finland during 1996–2010. (c) Number of bears killed per year in Finland from 1996 to 2010. (d) Regression of pairwise FST between the two subpopulations identified against minimum bear population size in Finland during 1996–2010 (b = −0.00005 (CI −0.000095, −0.000003); R2 = 0.20; p = 0.054). (e) Regression of number of migrants between the two subpopulations identified and minimum bear population size in Finland during 1996 (b = 0.004 (CI 0.002, 0.005); R2 = 0.60; p < 0.001).
4. Discussion
We have shown that there is a clear structuring and later homogenization in a geographically expanding large carnivore population, which is expected on the basis of theoretical models of range expansion [5,10–12,15,16]. Our intensive genetic screening in the growing brown bear population of Finland provided evidence of range expansion and suggested gradual disappearance of population substructure, owing to changes in IBD, and increasing genetic diversity and admixture as the range expansion proceeded. Assignment probabilities of individuals suggested expansion from the south, which was supported by gradually increasing heterozygosity, allelic richness and average numbers of alleles in the southern subpopulation. Heterozygosity, allelic richness and allele numbers did not increase correspondingly in the northern subpopulation; however, this also is expected in the leading edge of a geographically expanding population [10,12].
The average latitude of both subpopulations shifted northwards during the study period by 1° latitude, which corresponds to a linear distance of approximately 110 km, or an average of 7.4 km per year. Further, the proportion of individuals that was not clearly assigned to either subpopulation, possibly due to advanced admixture and gene flow from neighbouring populations [31], was found further north as time progressed. Previous studies and meta-analyses have summarized the speed of range shifts. These studies showed that range shift projections are dependent on the dispersal velocity of a species and permeability of the landscape [4]. Carnivores were among the species displaying the highest velocity in latitudinal shifts polewards as a response to climate change [3,4]. In this study, we detected gradual genetic changes accompanied by an ongoing geographical range expansion within a time frame of 15 years (approx. 1.5 brown bear generations). Theoretical studies simulating range shifts and expansions have shown similar molecular signatures after tens of generations [14]. However, genetic studies on adaptation have shown that substantial genetic changes may occur within only a single generation [61]. Our results may therefore suggest that genetic changes caused by range expansion may occur very fast in natural systems when accompanied by other driving forces such as population growth and immigration.
Genetic diversity is strongly linked to the population size of a species, with increasing population size supporting panmixis, enriching the gene pool and improving the viability eventually (e.g. [19]). In our study, gradual genetic changes without any leaps were observed as the range expansion proceeded, whereas annual population size estimates showed an increase primarily at the end of the study period. Thus, our results may indicate that the growth of the bear population can only partly explain the observed genetic changes. This may be supported by the fact that we did not find any clear relationship between the population growth alone and the decreasing genetic differentiation between the clusters. By contrast, we found a clear correlation between the increase in the number of migrants and population growth. As previously mentioned, the latter may decrease founder effects [10] and only slightly higher rates of long distance dispersal events preserve genetic diversity by reshuffling alleles across the landscape [19,62]. Population growth alone should give an excess of rare alleles, an excess of homozygosity and little linkage disequilibrium [5], but none of these three characteristics were observed in our study.
Genetic structure may arise very rapidly at the leading edge of a range expansion. Our study on brown bears is one of the first studies performed in a natural system that actually tests how a geographical expansion of a species temporally proceeds. Their historic eradication and recent re-expansion make brown bears in northern Europe an exemplary research target for such a study using continuous sampling. First of all, we find that the dynamic and ongoing genetic processes are surprisingly accelerated during the observed range shift, extending over just 1.5 generations in this natural empirical model system. We also find that during the range shift, population growth may also be important, however only in the final stages. Hence, we believe that the continuous and substantial immigration of Russian bears into the Finnish bear population [31,32] may be a strong driver behind the rapid genetic changes observed within the brief time period of 1.5 generations. Internal long-distance dispersal and migration from other subpopulations in the region seem to have increased diversity, and hence reduced the structuring at the leading edge of the expansion rapidly (i.e. the reshuffling effect of alleles must have been intensive).
As of the middle of the twentieth century, the brown bears were virtually absent from the country, with the exception of the area along the Finnish–Russian border in the north and the southeast parts of the country, for which regular observations of bears indicated more or less permanent abundance [35–37]. For the brown bears in Finland, the range contraction a century ago led to at least two different populations [31,47]. Conservation-minded changes in legislation during the second part of the last century led to a controlled harvest of the species and, accompanied by immigration from Russia, resulted in increasing numbers of bears, which dispersed further north and west over time [31,63]. The contraction process may have occurred within just 40–50 years (four to five generations, see §2b). Simulations on more than 10 generations indicate that fast range contractions have less severe effect on genetic diversity than slow contraction processes, and also better preserve the initial genetic diversity and leave the isolated populations with fewer genetic differences [14]. A very low number of bears were left in Finland in the 1960s, but within a similar time frame of 40–50 years the population recovered (figure 1b). Our results indicate that at least two genetic clusters merged, accompanied by range shifts, within a relatively short period. Again, simulations on multiple generations (more than 10) indicate that such fast range expansions may lead to lower levels of genetic diversity than slow shifts. Our results are in part contradictory to this, but this may be biased by a simultaneous gene flow from other populations (i.e. Russia) [31]. This is especially evident in the southern population, where the number of genetically unassigned individuals as well as the diversity is increasing during the study period. This (as well as previous studies) supports that there has been an ongoing influx of individuals from areas further east [31,32] due to potential long dispersal range of brown bears [64]. Also in prehistoric times, bears have dispersed through that area in the southeast, as shown by a recent study on the mitochondrial genome of brown bears in Eurasia that indicated similar, historical migration routes of bears from the east into Fennoscandia after the last glaciation [65].
Assuming the geographical expansion proceeds within the next 20–30 years, the population may continue to exhibit typical genetic effects of range expansions. Based on theoretical studies by others [5,14] as well as the increasing admixture observed in this study, we may predict further homogenization of the two clusters and increased genetic diversity in the core areas. We may also expect novel substructuring and loss of genetic diversity at the leading edges of the expansion. Furthermore, we predict that an increasing number of bears will enter areas with less or no bear abundance in the northern and western parts of Finland. This prediction includes that the leading edges will expand into areas with more human inhabitants and infrastructure (western Finland) or areas with semi-domestic reindeer herding (northern Finland), thus causing more conflicts.
The bear population in Finland is part of the large ecosystem of northern Europe [31–33], and our findings must be interpreted in this context. Substantial migration between neighbouring populations can make it difficult to separate between range expansions and demographic expansions based on genetic data [5,14]. Thus, the remarkable speed of the genetic change seems to be the result of a concerted action of range shift, population growth and substantial immigration. Our study exemplifies how continuous sampling combined with molecular methods has the potential to track the recovery of a species and the merging of formerly subdivided populations with higher precision than using classical monitoring methods alone. We believe that our approach may be used as a guideline for future wildlife monitoring and endangered species conservation (e.g. to evaluate impacts of climatic change, anthropogenic disturbance and management actions, such as improving habitat conservation and adapting local harvest quotas to maintain connectivity).
Acknowledgements
We would like to thank Camilla Tobiassen for assistance in the laboratory and Julia Schregel for helpful comments on the manuscript. Further, we would like to thank the Finnish hunters as well as the Finnish Hunters' Association for collecting the bear samples used in this study.
Ethics statement
All samples were collected from dead animals, harvested legally in Finland. Legal harvest of bears in Finland in the different hunting districts follows an annual quota corresponding to the estimated abundance and distribution of brown bears in those areas, and the sampling in this study follows this distribution throughout Finland. Tissue samples were collected by the Finnish Game and Fisheries Research Institute. No ethic permit was required, as the sample collection did not involve live animals.
Data accessibility
The raw data (i.e. the genetic profiles) have been deposited in the corresponding author's institutional repository (i.e. Bioforsk—Norwegian Institute for Agricultural and Environmental Research) and can be made available by contacting the corresponding author.
Authors' contributions
S.B.H., A.K., H.G.E. and J.A. designed and conceived the study. I.K. collected, compiled and quality controlled the brown bear samples and data. Main analyses were performed by S.B.H., A.K. and H.G.E. The manuscript has been written by S.B.H., A.K. and H.G.E. with input from J.A. and I.K.
References
- 1.Berthouly-Salazar C, Hui C, Blackburn TM, Gaboriaud C, van Rensburg BJ, van Vuuren BJ, Le Roux JJ. 2013. Long-distance dispersal maximizes evolutionary potential during rapid geographic range expansion. Mol. Ecol. 22, 5793–5804. ( 10.1111/mec.12538) [DOI] [PubMed] [Google Scholar]
- 2.Chen IC, Hill JK, Ohlemuller R, Roy DB, Thomas CD. 2011. Rapid range shifts of species associated with high levels of climate warming. Science 333, 1024–1026. ( 10.1126/science.1206432) [DOI] [PubMed] [Google Scholar]
- 3.Parmesan C, Yohe G. 2003. A globally coherent fingerprint of climate change impacts across natural systems. Nature 421, 37–42. ( 10.1038/nature01286) [DOI] [PubMed] [Google Scholar]
- 4.Schloss CA, Nunez TA, Lawler JJ. 2012. Dispersal will limit ability of mammals to track climate change in the Western Hemisphere. Proc. Natl Acad. Sci. USA 109, 8606–8611. ( 10.1073/pnas.1116791109) [DOI] [PMC free article] [PubMed] [Google Scholar]
- 5.Excoffier L, Foll M, Petit RJ. 2009. Genetic consequences of range expansions. Annu. Rev. Ecol. Evol. Syst. 40, 481–501. ( 10.1146/annurev.ecolsys.39.110707.173414) [DOI] [Google Scholar]
- 6.Mona S, Ray N, Arenas M, Excoffier L. 2014. Genetic consequences of habitat fragmentation during a range expansion. Heredity 112, 291–299. ( 10.1038/hdy.2013.105) [DOI] [PMC free article] [PubMed] [Google Scholar]
- 7.Petit RJ. 2011. Early insights into the genetic consequences of range expansions. Heredity 106, 203–204. ( 10.1038/hdy.2010.60) [DOI] [PMC free article] [PubMed] [Google Scholar]
- 8.Ray N, Currat M, Excoffier L. 2003. Intra-deme molecular diversity in spatially expanding populations. Mol. Biol. Evol. 20, 76–86. ( 10.1093/molbev/msg009) [DOI] [PubMed] [Google Scholar]
- 9.McInerny GJ, Turner JR, Wong HY, Travis JM, Benton TG. 2009. How range shifts induced by climate change affect neutral evolution. Proc. R. Soc. B 276, 1527–1534. ( 10.1098/rspb.2008.1567) [DOI] [PMC free article] [PubMed] [Google Scholar]
- 10.Austerlitz F, Jung-Muller B, Godelle B, Gouyon PH. 1997. Evolution of coalescence times, genetic diversity and structure during colonization. Theor. Popul. Biol. 51, 148–164. ( 10.1006/tpbi.1997.1302) [DOI] [Google Scholar]
- 11.Ibrahim KM, Nichols RA, Godfrey MH. 1996. Spatial patterns of genetic variation during expansion. Heredity 77, 282–291. ( 10.1038/sj.hdy.6880320) [DOI] [Google Scholar]
- 12.Ramakrishnan AP, Musial T, Cruzan MB. 2010. Shifting dispersal modes at an expanding species’ range margin. Mol. Ecol. 19, 1134–1146. ( 10.1111/j.1365-294X.2010.04543.x) [DOI] [PubMed] [Google Scholar]
- 13.Arenas M, François O, Currat M, Ray N, Excoffier L. 2012. Influence of admixture and Paleolithic range contractions on current European diversity gradients. Mol. Biol. Evol. 30, 57–61. ( 10.1093/molbev/mss203) [DOI] [PubMed] [Google Scholar]
- 14.Arenas M, Ray N, Currat M, Excoffier L. 2012. Consequences of range contractions and range shifts on molecular diversity. Mol. Biol. Evol. 29, 207–218. ( 10.1093/molbev/msr187) [DOI] [PubMed] [Google Scholar]
- 15.DeGiorgio M, Degnan JH, Rosenberg NA. 2011. Coalescence–time distributions in a serial founder model of human evolutionary history. Genetics 189, 579–593. ( 10.1534/genetics.111.129296) [DOI] [PMC free article] [PubMed] [Google Scholar]
- 16.Le Corre V, Kremer A. 1998. Cumulative effects of founding events during colonisation on genetic diversity and differentiation in an island and stepping-stone model. J. Evol. Biol. 11, 495–512. ( 10.1007/s000360050102) [DOI] [Google Scholar]
- 17.Currat M, Excoffier L, Maddison W, Otto SP, Ray N, Whitlock MC, Yeaman S. 2006. Comment on ‘Ongoing adaptive evolution of ASPM, a brain size determinant in Homo sapiens’ and ‘Microcephalin, a gene regulating brain size, continues to evolve adaptively in humans’. Science 313, 172; author reply 172 ( 10.1126/science.1122712) [DOI] [PubMed] [Google Scholar]
- 18.Kimura M, Crow JF. 1963. Measurement of effective population number. Evolution 17, 279–288. ( 10.2307/2406157) [DOI] [Google Scholar]
- 19.Frankham R. 1996. Relationship of genetic variation to population size in wildlife. Conserv. Biol. 10, 8 ( 10.1046/j.1523-1739.1996.10061500.x) [DOI] [Google Scholar]
- 20.Reed DH, O'Grady JJ, Brook BW, Ballou JD, Frankham R. 2003. Estimates of minimum viable population sizes for vertebrates and factors influencing those estimates. Biol. Conserv. 113, 23–34. ( 10.1016/s0006-3207(02)00346-4) [DOI] [Google Scholar]
- 21.Traill L, Bradshaw C, Brook B. 2007. Minimum viable population size: a meta-analysis of 30 years of published estimates. Biol. Conserv. 139, 159–166. ( 10.1016/j.biocon.2007.06.011). [DOI] [Google Scholar]
- 22.Estoup A, Beaumont M, Sennedot F, Moritz C, Cornuet J-M, Bonhomme F. 2004. Genetic analysis of complex demographic scenarios: spatially expanding populations of the cane toad, Bufo marinus. Evolution 58, 2021–2036. ( 10.1554/03-584) [DOI] [PubMed] [Google Scholar]
- 23.Short KH, Petren K. 2011. Fine-scale genetic structure arises during range expansion of an invasive gecko. PLoS ONE 6, 1–9. ( 10.1371/journal.pone.0026258) [DOI] [PMC free article] [PubMed] [Google Scholar]
- 24.Castric V, Bernatchez L. 2003. The rise and fall of isolation by distance in the anadromous brook charr (Salvelinus fontinalis Mitchill). Genetics 163, 983–996. [DOI] [PMC free article] [PubMed] [Google Scholar]
- 25.Herborg LM, Weetman D, van Oosterhout C, Hanfling B. 2007. Genetic population structure and contemporary dispersal patterns of a recent European invader, the Chinese mitten crab, Eriocheir sinensis. Mol. Ecol. 16, 231–242. ( 10.1111/j.1365-294X.2006.03133.x) [DOI] [PubMed] [Google Scholar]
- 26.Nussey DH, Coltman DW, Coulson T, Kruuk LE, Donald A, Morris SJ, Clutton-Brock TH, Pemberton J. 2005. Rapidly declining fine-scale spatial genetic structure in female red deer. Mol. Ecol. 14, 3395–3405. ( 10.1111/j.1365-294X.2005.02692.x) [DOI] [PubMed] [Google Scholar]
- 27.Amos W, Harwood J. 1998. Factors affecting levels of genetic diversity in natural populations. Proc. R. Soc. Lond. B 353, 177–186. ( 10.1098/rstb.1998.0200) [DOI] [PMC free article] [PubMed] [Google Scholar]
- 28.Cardillo M, Mace GM, Jones KE, Bielby J, Bininda-Emonds ORP, Sechrest W, Orme CDL, Purvis A. 2005. Multiple causes of high extinction risk in large mammal species. Science 309, 1239–1241. ( 10.1126/science.1116030) [DOI] [PubMed] [Google Scholar]
- 29.Chapron G, et al. 2014. Recovery of large carnivores in Europe's modern human-dominated landscapes. Science 346, 1517–1519. ( 10.1126/science.1257553) [DOI] [PubMed] [Google Scholar]
- 30.Crooks KR. 2002. Relative sensitivities of mammalian carnivores to habitat fragmentation. Biol. Conserv. 16, 488–502. ( 10.1046/j.1523-1739.2002.00386.x) [DOI] [Google Scholar]
- 31.Kopatz A, Eiken HG, Aspi J, Kojola I, Tobiassen C, Tirronen KF, Danilov PI, Hagen SB. 2014. Admixture and gene flow from Russia in the recovering Northern European brown bear (Ursus arctos). PLoS ONE 9, e97558 ( 10.1371/journal.pone.0097558.g001) [DOI] [PMC free article] [PubMed] [Google Scholar]
- 32.Kopatz A, et al. 2012. Connectivity and population subdivision at the fringe of a large brown bear (Ursus arctos) population in North Western Europe. Conserv. Genet. 13, 681–692. ( 10.1007/s10592-011-0312-z) [DOI] [Google Scholar]
- 33.Schregel J, et al. 2012. Limited gene flow among brown bear populations in far Northern Europe? Genetic analysis of the east–west border population in the Pasvik Valley. Mol. Ecol. 21, 3474–3488. ( 10.1111/j.1365-294X.2012.05631.x) [DOI] [PubMed] [Google Scholar]
- 34.Tallmon DA, Bellemain E, Swenson J, Taberlet P. 2004. Genetic monitoring of Scandinavian brown bear effective population size and immigration. J. Wildl. Manage 68, 960–965. ( 10.2193/0022-541X(2004)068[0960:GMOSBB]2.0.CO;2) [DOI] [Google Scholar]
- 35.Wikman M. 2010. Riistakannat 2010. Riistaseurantojen tulokset. In Riista- ja kalatalous—selvityksiä (ed. Wikman M.), pp. 1–47. Helsinki: Riista- ja kalatalouden tutkimuslaitos. [Google Scholar]
- 36.Ermala A. 2003. A survey of large predators in Finland during the 19th–20th centuries. Acta Zool. Lit. 13, 15–20. ( 10.1080/13921657.2003.10512538) [DOI] [Google Scholar]
- 37.Pulliainen E. 1990. Recolonization of Finland by the brown bear in the 1970s and 1980s. Aquilo Zool. 27, 21–25. [Google Scholar]
- 38.Kojola I, Laitala HM. 2000. Changes in the structure of an increasing brown bear population with distance from core areas: another example of presaturation female dispersal? Ann. Zool. Fenn. 37, 59–64. [Google Scholar]
- 39.Paetkau D, Calvert W, Stirling I, Strobeck C. 1995. Microsatellite analysis of population structure in Canadian polar bears. Mol. Ecol. 4, 347–354. ( 10.1111/j.1365-294X.1995.tb00227.x) [DOI] [PubMed] [Google Scholar]
- 40.Paetkau D, Strobeck C. 1994. Microsatellite analysis of genetic variation in black bear populations. Mol. Ecol. 3, 489–495. ( 10.1111/j.1365-294X.1994.tb00127.x) [DOI] [PubMed] [Google Scholar]
- 41.Taberlet P, Camarra JJ, Griffin S, Uhres E, Hanotte O, Waits LP, Dubois-Paganon C, Burke T, Bouvet J. 1997. Noninvasive genetic tracking of the endangered Pyrenean brown bear population. Mol. Ecol. 6, 869–876. ( 10.1111/j.1365-294X.1997.tb00141.x) [DOI] [PubMed] [Google Scholar]
- 42.Andreassen R, et al. 2012. A forensic DNA profiling system for Northern European brown bears (Ursus arctos). Forensic Sci. Int. Genet. 6, 798–809. ( 10.1016/j.fsigen.2012.03.002) [DOI] [PubMed] [Google Scholar]
- 43.Linacre A, Gusmao L, Hecht W, Hellmann AP, Mayr WR, Parson W, Prinz M, Schneider PM, Morling N. 2011. ISFG: Recommendations regarding the use of non-human (animal) DNA in forensic genetic investigations. Forensic Sci. Int. Genet. 5, 501–505. ( 10.1016/j.fsigen.2010.10.017) [DOI] [PubMed] [Google Scholar]
- 44.Valière N. 2002. GIMLET: a computer program for analysing genetic individual identification data. Mol. Ecol. Notes 2, 377–379. ( 10.1046/j.1471-8286.2002.00228.x) [DOI] [Google Scholar]
- 45.Van Oosterhout C, Hutchinson WF, Wills DPM, Shipley P. 2004. MICRO-CHECKER: software for identifying and correcting genotyping errors in microsatellite data. Mol. Ecol. Notes 4, 535–538. ( 10.1111/j.1471-8286.2004.00684.x) [DOI] [Google Scholar]
- 46.Pritchard JK, Stephens M, Donnelly P. 2000. Inference of population structure using multilocus genotype data. Genetics 155, 945–959. [DOI] [PMC free article] [PubMed] [Google Scholar]
- 47.Tammeleht E, Remm J, Korsten M, Davison J, Tumanov I, Saveljev A, Mannil P, Kojola I, Saarma U. 2010. Genetic structure in large, continuous mammal populations: the example of brown bears in northwestern Eurasia. Mol. Ecol. 19, 5359–5370. ( 10.1111/j.1365-294X.2010.04885.x) [DOI] [PubMed] [Google Scholar]
- 48.Evanno G, Regnaut S, Goudet J. 2005. Detecting the number of clusters of individuals using the software STRUCTURE: a simulation study. Mol. Ecol. 14, 2611–2620. ( 10.1111/j.1365-294X.2005.02553.x) [DOI] [PubMed] [Google Scholar]
- 49.Pelletier A, Obbard ME, Mills K, Howe EJ, Burrows FG, White BN, Kyle CJ. 2012. Delineating genetic groupings in continuously distributed species across largely homogeneous landscapes: a study of American black bears (Ursus americanus) in Ontario, Canada. Can. J. Zool. 90, 999–1014. ( 10.1139/z2012-068) [DOI] [Google Scholar]
- 50.Hardy OJ, Vekemans X. 2002. SPAGeDi: a versatile computer program to analyse spatial genetic structure at the individual or population levels. Mol. Ecol. Notes 2, 618–620. ( 10.1046/j.1471-8278) [DOI] [Google Scholar]
- 51.Loiselle BA, Sork VL, Nason J, Graham C. 1995. Spatial genetic structure of a tropical understory shrub, Psychotria officinalis (Rubiaceae). Am. J. Bot. 82, 1420–1425. ( 10.2307/2445869) [DOI] [Google Scholar]
- 52.Excoffier L, Lischer HEL. 2010. Arlequin suite ver 3.5: a new series of programs to perform population genetics analyses under Linux and Windows. Mol. Ecol. Resour. 10, 564–567. ( 10.1111/j.1755-0998.2010.02847.x) [DOI] [PubMed] [Google Scholar]
- 53.Goudet J. 2001. FSTAT: a program to estimate and test gene diversities and fixation indices (version 2.9.3). See http://www.unil.ch/izea/softwares/fstat.html.
- 54.Belkhir K, Borsa P, Chikhi L, Raufaste N, Bonhomme F. 1996–2004. GENETIX 4.05, logiciel sous Windows pour la génétique des populations. Montpellier, France: Laboratoire Génome, Populations, Interactions,CNRS UMR 5171, Université de Montpellier II. [Google Scholar]
- 55.Rousset F. 2008. GENEPOP 007: a complete re-implementation of the GENEPOP software for Windows and Linux. Mol. Ecol. Resour. 8, 103–106. ( 10.1111/j.1471-8286.2007.01931.x) [DOI] [PubMed] [Google Scholar]
- 56.Barton NH, Slatkin M. 1986. A quasi-equilibrium theory of the distribution of rare alleles in a subdivided population. Heredity 56, 409–411. ( 10.1038/hdy.1986.63) [DOI] [PubMed] [Google Scholar]
- 57.Black WC, Krafsur ES. 1985. A FORTRAN software for the calculation and analysis of two-locus linkage disequilibrium coefficients. Theor. Appl. Genet. 70, 491–496. ( 10.1007/BF00305981) [DOI] [PubMed] [Google Scholar]
- 58.R Development Core Team 2013. R: a language and environment for statistical computing. Vienna, Austria: R Foundation for Statistical Computing. [Google Scholar]
- 59.Swenson JE, Wabakken P, Sandegren F, Bjärvall A, Franzén R, Söderberg A. 1995. The near extinction and recovery of brown bears in Scandinavia in relation to the bear management policies of Norway and Sweden. Wildl. Biol. 1, 11–25. [Google Scholar]
- 60.Støen OG, Zedrosser A, Wegge P, Swenson JE. 2006. Socially induced delayed primiparity in brown bears Ursus arctos. Behav. Ecol. Sociobiol. 61, 1–8. ( 10.1007/s00265-006-0231-z) [DOI] [Google Scholar]
- 61.Christie MR, Marine ML, French RA, Blouin MS. 2012. Genetic adaptation to captivity can occur in a single generation. Proc. Natl Acad. Sci. USA 109, 238–242. ( 10.1073/pnas.1111073109) [DOI] [PMC free article] [PubMed] [Google Scholar]
- 62.Bialozyt R, Ziegenhagen B, Petit RJ. 2006. Contrasting effects of long distance seed dispersal on genetic diversity during range expansion. J. Evol. Biol. 19, 12–20. ( 10.1111/j.1420-9101.2005.00995.x) [DOI] [PubMed] [Google Scholar]
- 63.Kojola I, Heikkinen S. 2006. The structure of the expanded brown bear population at the edge of the Finnish range. Ann. Zool. Fenn. 43, 258–262. [Google Scholar]
- 64.Støen OG, Zedrosser A, Saebo S, Swenson JE. 2006. Inversely density-dependent natal dispersal in brown bears Ursus arctos. Oecologia 148, 356–364. ( 10.1007/s00442-006-0384-5) [DOI] [PubMed] [Google Scholar]
- 65.Keis M, et al. 2012. Complete mitochondrial genomes and a novel spatial genetic method reveal cryptic phylogeographical structure and migration patterns among brown bears in north-western Eurasia. Journal of Biogeography 40, 915–927. ( 10.1111/jbi.12043) [DOI] [Google Scholar]
Associated Data
This section collects any data citations, data availability statements, or supplementary materials included in this article.
Data Availability Statement
The raw data (i.e. the genetic profiles) have been deposited in the corresponding author's institutional repository (i.e. Bioforsk—Norwegian Institute for Agricultural and Environmental Research) and can be made available by contacting the corresponding author.