Abstract
Glioblastoma, the most aggressive type of brain cancer, has median survival time of 1 year after diagnosis. It is characterized by alternating modes of rapid proliferation and aggressive invasion in response to metabolic stress in the microenvironment. A particular microRNA, miR-451, and its downstream signalling molecules, AMPK complex, are known to be key determinants in switching cell fate. These components form a core control system determining a balance between cell growth and migration which is regulated by fluctuating glucose levels in the microenvironment. An important factor from the treatment point of view is that low levels of glucose affect metabolism and activate cell migration through the miR-451-AMPK control system, creating ‘invisible’ migratory cells and making them inaccessible by conventional surgery. In this work, we apply optimal control theory to deal with the problem of maintaining upregulated miR-451 levels that prevent cell infiltration to surrounding brain tissue and thus induce localization of these cancer cells at the surgical site. The model also considers the effect of a drug that blocks inhibitive pathways of miR-451 from AMPK complex. Glucose infusion control and drug infusion control are chosen to represent dose rates of glucose and drug intravenous administrations, respectively. The characteristics of optimal control lead us to investigate the structure of optimal intravenous infusion regimen under various circumstances and predict best clinical outcomes with minimum expense possible.
Keywords: glioblastoma multiforme, optimal control theory, cell proliferation and invasion, glucose intravenous infusion, drug intravenous infusion
1. Introduction
Glioblastoma multiforme is notably an aggressive form of primary brain tumour characterized by anaplastic, nuclear atypia, cellular pleomorphism, mitotic activity and, more importantly, alternating phases of rapid proliferation and aggressive invasion into surrounding brain tissue, which leads to inevitable and critical recurrence after surgical resection of the primary tumour mass [1,2]. The tricarboxylic acid or Krebs cycle is a key step for producing an energy source, adenosine triphosphate (ATP), and survival in non-hypoxic normal cells. While differentiated cells favour this effective metabolism, cancerous cells adapt ineffective aerobic glycolysis [3] producing relatively large amounts of waste product (lactic acid) and consuming considerable amounts of glucose, the Warburg effect [4]. Cancer cells may have an advantage of not having to rely on oxygen for energy in a hostile tumour microenvironment leading to longer survival [4,5]. Inhibition of glycolysis may prevent drug resistance [6]. Therefore, better understanding of glycolysis may lead to better treatment options for better clinical outcomes. Adapting appropriate cellular responses to glucose withdrawal is a critical event for cancer cells to survive in the given, not necessarily friendly, microenvironment where glucose supply may fluctuate. To ensure an adequate glucose supply and reduce metabolic stress, cancer cells adapt cell migration and angiogenesis [7]. In order to maintain viability as cancer cells grow and accumulate, cells develop strategies of metabolic adaptation in the period of metabolic stress [8]. The 5′-adenosine monophosphate-activated protein kinase (AMPK) pathway is the key cellular sensor of energy availability and is activated in the event of metabolic stress to enhance energy conservation and glucose uptake [9]. Therefore, cancer cells can avoid the bioenergetic challenge and cell death through AMPK pathways. At certain stages of the tumorigenic process, AMPK activation provides a survival advantage to tumour cells [10] such as highly invasive glioma cells in response to harsh metabolic stress [7]. Activation of AMPK is a key event in the sequential tumorigenic process, and AMPK is the major contributor to the metabolic reprogramming (Warburg effect [3]). AMPK plays a major role in overcoming anoikis, programmed cell death under a loss of attachment to the basement membrane [11]. Thus, at critical stages of glioma infiltration, AMPK inhibition rather than activation may present therapeutic potential [10]. For instance, compound C, a cell-permeable pyrrazolopyrimidine compound, has become a great candidate for reversible and ATP-competitive inhibitor of AMPK [12]. MicroRNAs (miRNAs), approximately 22 nucleotide single-stranded non-coding RNAs, are now well known to function as key regulators of gene expression [13]. Dysregulation of miRNAs is associated with oncogenic activities and tumour suppressor [14] in various types of cancer, including glioblastoma [15,16]. Increasing numbers of miRNAs are also known to regulate aerobic glycolysis in cancer development [17] and in proliferation/migration in glioblastoma (miR-18a [18], miR-656 [19] and miR-16 [20]) and other functions (miR-152 [21] and miR-143 [22]). For example, cell migration is promoted by miR-21 through downregulation of MMP inhibitors in glioma [23] but is inhibited by miR-145 [24].
Godlewski et al. [7] have recently identified a novel mechanism of glioma cell migration and proliferation where a particular microRNA, miR-451, and its counterpart, AMPK complex (CAB39/LKB1/STRAD/AMPK), determine cell proliferation and migration. They found that (i) high (normal) levels of glucose lead to upregulation of miR-451 and downregulation of AMPK complex, leading to proliferation of glioma cells and decreased motility and (ii) miR-451 is downregulated in response to low glucose, promoting cell migration with reduced proliferation. Thus, the core control system of miR-451 and AMPK complex plays an integral role in the regulation of balance between proliferation and invasion of glioma cells. Kim et al. [25–27] developed a mathematical model that shows how the dynamics of the core miR-451–AMPK control system affects cell proliferation and migration in glioblastoma. It provides an explanation for up- and downregulation of miR-451 in response to high and low glucose levels and known mutual antagonism between miR-451 levels and AMPK complex activities [7]. The multiscale mathematical model developed in [26] also predicts the growth–invasion cycling patterns of glioma in response to fluctuating glucose uptake in heterogeneous microenvironment. The core control model predicts a hysteresis bifurcation diagram and a window of bistable system when delayed downregulation of miR-451 activities along certain molecular pathways would force glioma cells to stay longer in the proliferative phase despite relatively low glucose conditions, making this mechanism a therapeutic target.
Tumour cells can invade as much as 2–3 cm away from the originated sites [28,29], and can sometimes travel all the way down to the other side of the brain. While it is challenging to know exact margins of a tumour in real patients, here we assume that the infiltrative tumour cells are restricted near the surgical site. Therefore, our objective is to localize glioma cells for a second surgery and prevent their migration to the tissue. Our analytical tool is based primarily on the concept of optimal control theory which has been successfully used to make decisions involving biological models. Important applications include optimal treatment strategies in HIV models [30,31], tuberculosis [32,33] and design of optimal cardiopulmonary resuscitation techniques [34,35]. We formulate the control problem of maintaining sufficiently high levels of miR-451 to keep glioma cells in their proliferative mode restraining them from invading the brain tissue. It is assumed that the event begins immediately after a big glioma tumour has been surgically removed. With glucose levels as a regulator of miR-451 activity, optimal control strategies are identified to confine miR-451 concentrations above a certain threshold through administration of glucose intravenous infusion. In addition, a drug suppressing the inhibitory effect of miR-451 by AMPK is explored. It is considered that this drug can be administered concomitantly with glucose as a secondary infusion. The controls are given by dose rates of glucose and/or drug intravenous administrations. Thus, glucose and drug levels are regulated to prevent rapid tumour growth and further complications to diabetic cancer patients [36,37]. Various schemes are analysed under different circumstances while minimizing cost of intravenous administrations. The results propose a plausible glucose and/or drug intravenous regimen indicating, among others, the time, frequency, number of administrations and dose of glucose and/or drug per infusion. For practical purposes, suboptimal controls are presented to identify a realizable intermittent infusion with specific duration and dosage.
2. Material and methods
2.1. Model of regulation in core control system
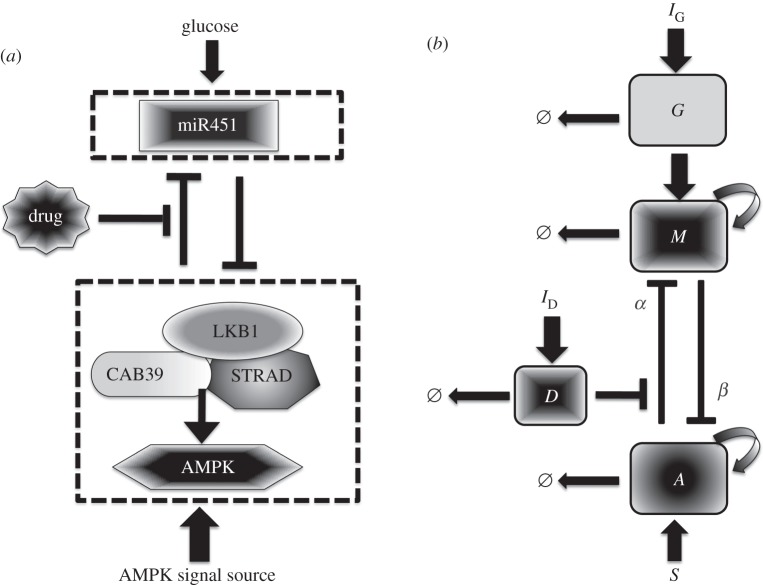
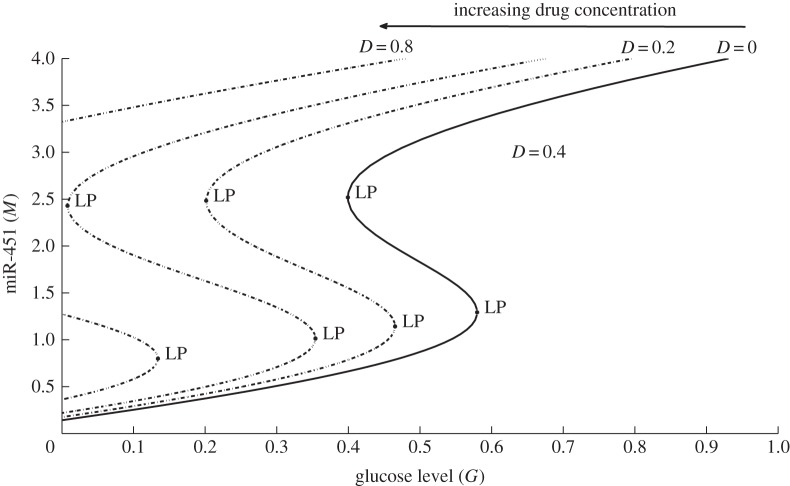
We extend the model of miR-451–AMPK core control system developed in [25] and related works [26,27] to include regulation by glucose and influence of drug use and thus additional components are added. Figure 1a shows the conceptual model dynamics adapted from Godlewski et al. [7] with possible drug-driven intervention of inhibitory pathways of miR-451 from the AMPK complex. As in [25], we began by simplifying the signalling network into our model of glioma proliferation and migration. Now, there are four key players of the intracellular structure, namely, glucose level, miR-451 level, AMPK complex activity and concentration of drugs. Figure 1b shows a schematic dimensionless representation of figure 1a. IG and ID are the sources of glucose and drug, respectively, which can be controlled through intravenous infusions. The essential control parameter values are given in table 1. In this study, we consider a drug D that can block the inhibitive pathway of miR-451 by AMPK complex where the inhibition strength is given by ζ(D) = e−D. Note that when D is large, αe−D is small and dM/dt is high. Hence, the presence of drug D increases the level of M and so does the chance of staying in the proliferation phase. Figure 2 depicts the effect of drug concentrations in the G–M bifurcation curve. Observe that the presence of drug shifts the hysteresis curve to the left. As the drug concentration increases, the corresponding limit point (LP) value decreases but the bistability window becomes wider. Thus, with higher drug concentration, miR-451 will remain upregulated even with less glucose levels allowing glioma cells to stay in proliferative state.
Figure 1.
(a) Conceptual model of dynamics of miR-451 and AMPK complex (CAB39/LKB1/AMPK) in cell migration and proliferation in glioblastoma [7], and possible drug-driven intervention of inhibitory pathways of miR-451 from the AMPK complex. (b) The dimensionless schematic diagram of an extended network where glucose, miR-451, AMPK complex and drug activity are represented by G, M, A and D, respectively. IG and ID are sources of glucose and drug through intravenous infusions, respectively. α and β are inhibition strengths and Ø denotes decay.
Table 1.
Essential control parameters used in the intracellular dynamics model.
| description | value | references | |
|---|---|---|---|
| k1 | miR-451 autocatalytic production rate | 4.0 | [25,26] |
| k2 | Hill-type coefficient | 1.0 | [25,26] |
| α | inhibition strength of miR-451 by AMPK complex | 1.6 | [25,26] |
| k3 | AMPK autocatalytic production rate | 4.0 | [25,26] |
| k4 | Hill-type coefficient | 1.0 | [25,26] |
| β | inhibition strength of AMPK complex by miR-451 | 1.0 | [25,26] |
| S | signalling source of AMPK | 0.2 | [25,26] |
| ɛ | scaling factor (slow dynamics) | 0.02 | [25,26,38–40] |
| thM | threshold of miR-451 for invasion/growth switch | 2.0 | [25,26] |
| μ | consumption rate of glucose | 0.5 | [26,41] |
| δ | decay rate of drug | 1.316 | [42,43] |
Figure 2.
The G–M hysteresis loop showing the effect of different drug concentrations, D = 0, 0.2, 0.4, 0.8. LP denotes the fold or limit point bifurcation numerically obtained using the Matlab package MatCont [44]. The size of bistability window is increased and the curve moves to the left as D is increased, increasing the chances of staying in the proliferative phase for relatively low glucose levels. The bistable window eventually disappears for larger D (D = 0.8), leading to a one-way switch between proliferation and migration phases.
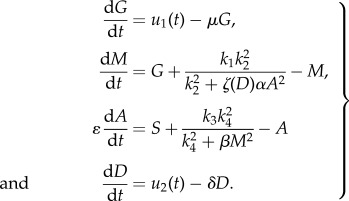
The governing model equations can be rewritten in a dimensionless form as
 |
2.1 |
Here, u1(t) and u2(t) denote the controls of the system representing dose rate of glucose and drug intravenous administrations, respectively. Our objective is to find optimal infusion regimen for glucose and drug administrations, denoted by  and
and  , respectively. This is obtained by maximizing the objective functional J defined by
| 2.2 |
where M(t) denotes the level of miR-451 concentration, and u1(t) and u2(t) are the glucose and drug infusion controls, respectively. Parameters B1 and B2 are weight factors measuring the relative cost based on maximizing M(t) and administering glucose and drug intravenous infusions over [t0, t1], respectively. Details of the different strategies and characteristics of optimal controls are provided in the electronic supplementary material.
In this study, we aim to maintain high levels of upregulated miR-451 keeping the glioblastoma cells in their proliferative phase and thus preventing them from infiltrating surrounding tissue. That is, the miR-451 (M) concentration should be above the threshold value, Mth = 2, and the corresponding counterpart AMPK complex (A) concentration is low. The underlying assumption is that the core control miR-451–AMPK complex dynamics is regulated by glucose levels. Hence, we apply optimal control technique to allow the maximum M concentration on a specified interval at the same time minimizing the dose rate of glucose and/or drug intravenous administrations and the corresponding cost. Let us assume that the event begins immediately after a primary surgery when a tumour mass has been surgically removed. Further, miR-451 level is above the threshold, i.e. M > Mth and glioma cells are in growth phase. We refer to regular glucose intravenous administration IG(t) and regular drug intravenous administration ID(t) as 3 h infusions every 12 h. Practically, it could represent periodic extended intravenous administrations. This infusion regimen is chosen assuming that the amount of glucose is regulated to restrain rapid proliferation of tumour cells and to avoid further complications for diabetic cancer patients. For illustrative purposes, the maximum dosage of IG(t) and ID(t) is considered to be 1 unit and periodically administered over 60 h. Mathematically, we have
 |
2.3 |
We define the period of optimal control infusion as the average distance between adjacent instances when optimal control is applied and the frequency is determined by inverse of the period. The dose per infusion is computed by taking the average area under the optimal curves. The total relative costs of optimal glucose infusion and optimal drug infusion are defined by
| 2.4 |
respectively, where dt represents the timestep and N is the total number of timesteps over 60 h. Hence, the average relative cost of each infusion (or cost per infusion) is the total relative cost divided by total number of periods over entire duration. In our simulations, weight parameters B1, B2 = 1 are used as default values unless specified.
3. Results and discussion
3.1. Strategy I: glucose infusion control u1(t)
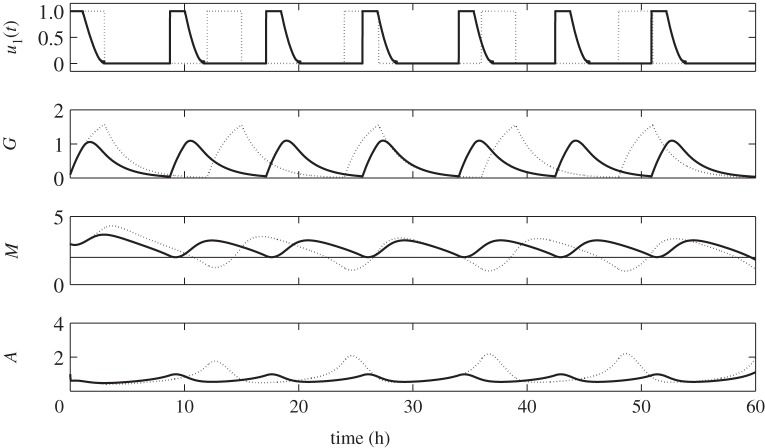
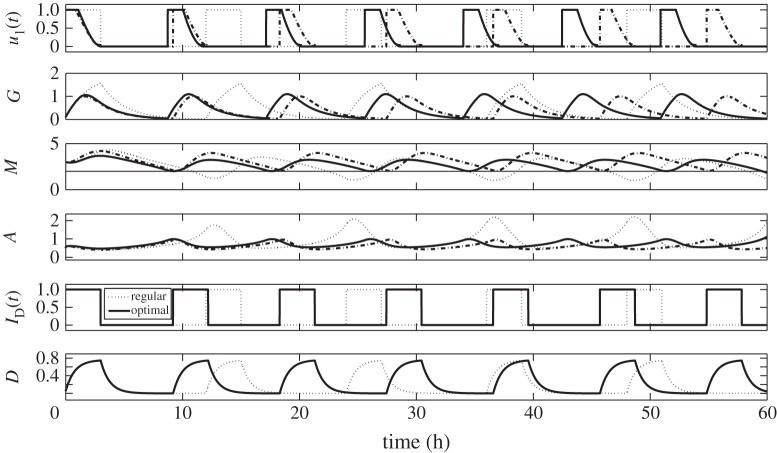
Suppose that post primary tumour surgery sustained elevated M concentration levels with glioblastoma cells in the growth phase. Let us first consider the behaviour of G, M and A concentration profiles when regular glucose administration IG(t) given in equation (2.3) is being applied. From now on, we will simply call this regular control. With IG(t) = 1, the dose rate of glucose infusion is constant and G increases. Upon withdrawal, that is, IG(t) = 0, G decreases due to consumption by the cells. Periodic infusion and withdrawal leads to fluctuation of glucose levels. In response to this regular control, the M concentration level increases as G increases and decreases correspondingly as G does. Likewise, corresponding behavior of A levels are actuated, i.e. high concentrations of M brings A to low concentrations, and vice versa. This infusion regimen drives M to periodically rise above and fall below the threshold value, Mth = 2. In turn, cells will regularly switch from proliferation to invasion phase resulting to a larger tumour size [25]. Hence, with regular control, the objective of keeping glioma cells in growth phase prohibiting further infiltration is not achieved. In particular, a 12 h period is a long interval of glucose intravenous administration. Dynamics of the regular control, glucose (G), miR-451 (M) and AMPK (A) levels are depicted in figure 3 (dotted curves).
Figure 3.
Time course of regular control (dotted) and optimal control (solid) with its corresponding glucose (G), miR-451 (M) and AMPK complex (A) concentration levels. The optimal control scheme maintains the anti-invasive phase (high miR-451, low AMPK) while that with regular control leads to the dangerous migratory phase (M < thM).
Using optimal control routine (OCR), we want to determine an efficient strategy of glucose infusion regimen achieving our goal. We call this glucose infusion control u1(t) or simply optimal control u1(t). Same initial conditions as the regular control are set after the first surgery, that is, M > Mth and A is low. Application of OCR is done for the first 3 h of administration. As observed before, glucose infusion increases the supply in the system raising the level of M while decreasing the concentration of A. It should be noted that u1(t) decreases to zero from 0 < ti < 3. It suggests that the dose rate of glucose infusion should be decreased from time ti. This eventually leads to the decrease in glucose due to consumption and corresponding decrease in M and increase in A. Before M crosses Mth, OCR is again applied for 3 h proposing a specific time for the next glucose infusion. This entails the period of optimal control and likewise frequency of administration. To ensure that cells are continuously proliferating avoiding migration, the procedures of monitoring M and applying OCR are repeated over 60 h. Thus, the number of glucose infusions is also determined over a given time duration. In figure 3, the solid curves depict the time evolution of optimal control u1(t) and the corresponding G, M and A concentration profiles. Obviously, one can see that the dose of glucose for optimal control is less than in regular control but more frequently administered. As shown in the figure, regular control is administered five times every 12 h while optimal control should be done seven times every 8.48 h over 60 h. In addition, with optimal control, rapid growth of glioma cells is restrained since miR-451 level is relatively low. Further risk of complications for diabetic patients is then reduced because glucose levels are lowered.
The parameter B1 is a weighting factor associated in our objective functional. It represents a measure of cost involved in the administration of glucose intravenous infusion. As shown in figure 4a, as B1 increases, the frequency of optimal control also increases. It suggests that as the cost of administration becomes expensive, the period of infusion should be smaller. That is, interval of injections should be closer. However, it should be noted that as the frequency of administration increases, the dose per optimal infusion decreases with increasing B1 values. This is shown in figure 4b. Therefore, higher administration cost dictates lesser amount of glucose per optimal infusion. Optimal control thus recommends that to minimize higher cost of administering glucose intravenous infusion, more frequent infusion with lower dose per infusion should be carried out.
Figure 4.
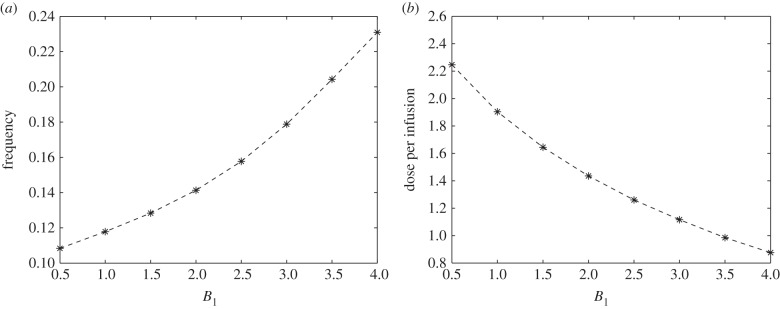
(a) Frequency and (b) dose of optimal glucose intravenous infusion for different B1 values. While frequency is a steady increasing function of B1, the dose of glucose is negatively correlated.
Figure 5 reflects the relative cost incurred in the administration of optimal glucose intravenous infusion. Over 60 h duration, the total relative cost of injection (grey bars) tends to be higher for larger values of B1. Even though smaller dose of glucose is needed for higher B1, administration is done more frequently. This leads to higher total administration cost involved. It should be noted that the relative cost per optimal infusion (average relative cost) does not increase with B1 (figure 5, black bars). Instead, middle-range values for B1 tend to have higher cost per optimal infusion. Of course, economically, one will opt for cheaper cost of glucose administration.
Figure 5.
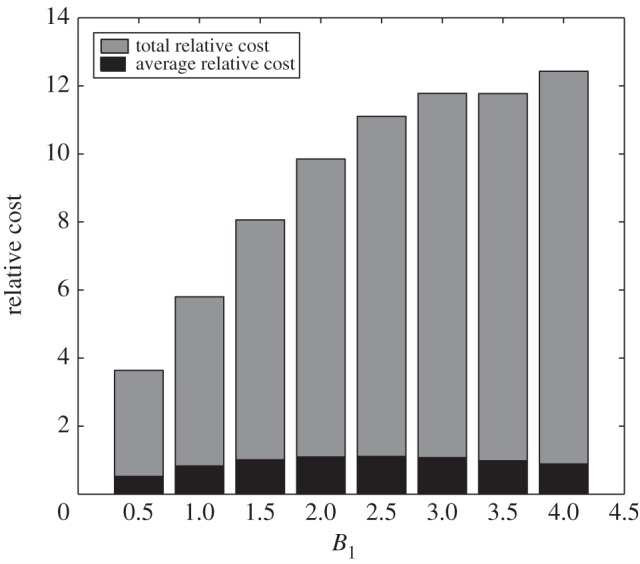
Relative cost of optimal glucose intravenous infusion for different values of B1. After a steep increase for smaller B1 values, the relative cost approaches a plateau for larger B1 values.
Moreover, we can compare the total dose or amount of glucose between regular control IG(t) and optimal control u1(t) for different values of B1 (figure 6). For the smallest weight constant (B1 = 0.5), total glucose amount of u1(t) exceeds IG(t). However, for larger B1 values, total injection amount is less in u1(t). It can be verified that over a longer administration duration as in cancer patients, total dose of glucose will be less in u1(t). Hence, optimal control suggests minimum total amount of glucose needed over an entire duration of administration.
Figure 6.
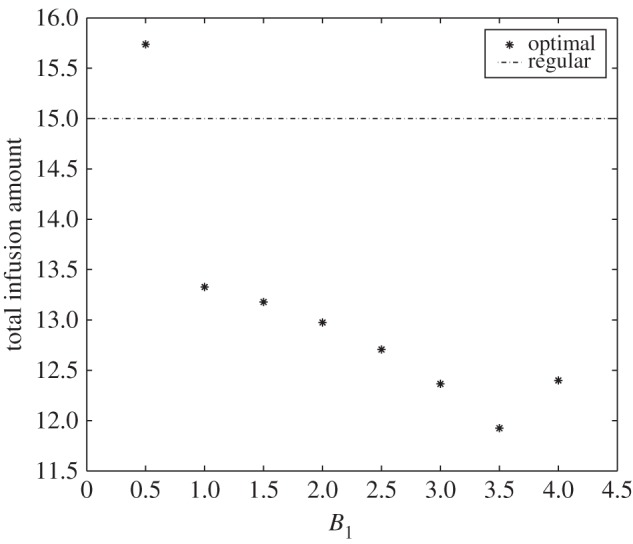
Total infusion amount for different values of B1. Total infusion amount forms a V-shape relative to B1 with a minimum value at B1 = 3.5.
3.2. Strategy II: glucose infusion control u1(t) with drug intervention
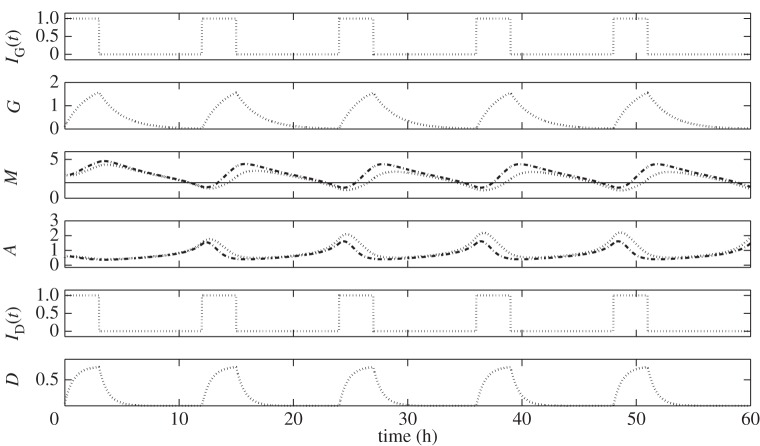
Here, we assume that a drug suppressing the inhibitory effect of miR-451 by AMPK complex can be carried out through a secondary intravenous infusion. Side effects and unnecessary chemical reactions with glucose are neglected for our purposes. A regular drug intravenous infusion ID(t) is administered at the same time with glucose as given in equation (2.3). Here, the amount of drug is fixed over the entire duration of administration. In figure 7, dotted curves depict the regular glucose intravenous infusion IG(t) and the corresponding glucose (G), miR-451 (M) and AMPK complex (A) concentration profiles. The dash-dotted curves show the behaviour of M and A when ID(t) is done as a secondary intravenous infusion, that is, we have IG(t) + ID(t). D illustrates the drug concentration. As expected, drug intervention raises miR-451 and lowers AMPK complex concentration levels. With this regular scheme, periodic fluctuation of M levels above and below its threshold value is not avoided. Thus, the risk of cell migration is not eliminated with the use of drug under regular infusion regimen.
Figure 7.
Comparison between regular glucose intravenous infusion only (dotted) and with secondary drug intravenous infusion (dash-dotted). The inhibitory drug on the inhibition pathways of miR-451 by AMPK complex increases the miR-451 level compared with the regular glucose infusion.
In figure 8, we show the three different administration regimens. The dotted and solid curves illustrate the regular and optimal glucose intravenous infusions labelled as regular and optimal w/o drug, respectively, which is presented in the previous strategy. We keep it here for comparison. The optimal glucose infusion with drug intervention labelled as optimal with drug and corresponding dynamics of G, M, A levels are depicted in dash-dotted curves. Note that with drug, optimal glucose administration is delayed, that is, interval of infusion is longer. In general, this gives less frequency over an entire duration compared with optimal without drug. However, it should be observed that drug infusion becomes more intermittent when it is concomitantly administered with optimal glucose infusion. From regular drug administration ID(t) of five times, it becomes seven times which is the same frequency of glucose administration. This strategy is referred to as glucose infusion control u1(t) with drug intervention. The need for more drug dose and possible additional expenses has been ruled out in the assumption above. A probable drawback of this regimen is elevated miR-451 levels which could initiate aggressive cell proliferation. This will be resolved by administering less dose of glucose infusion. For instance, dose rate and infusion duration can be reduced.
Figure 8.
Comparison among regular glucose injection (dotted), glucose injection control without drug intervention (solid) and glucose infusion control with drug intervention (dash-dotted). Optimal control with the drug tends to push miR-451 levels.
In order to have holistic comparisons between optimal glucose infusion without (optimal without drug) and with drug intervention (optimal with drug), we plot the corresponding frequency of administration and dose per optimal infusion. This is shown in figure 9a,b, respectively. The weight parameter B1 is varied to represent different relative cost related to administration expenses as mentioned in the preceding strategy. As B1 increases, the frequency also increases but the dose of glucose per infusion decreases for both optimal without and with drug. It is depicted that fewer number of infusions and less amount of glucose are needed when drug is used for all values of B1. It is also worth noting that the frequency does not increase exponentially with B1 in optimal with drug, even though lesser dose of glucose per infusion is injected. Thus, it is tantamount to say that as administration cost becomes larger (i.e. B1 is higher), fewer glucose infusions with less dose can be compensated by the drug use. Indeed, this specific drug influences the regulation miR-451 and AMPK levels by complementing effects of glucose in the activities of the core control system. Hence, optimal with drug reduces the number of glucose intravenous administrations and dose per infusion.
Figure 9.
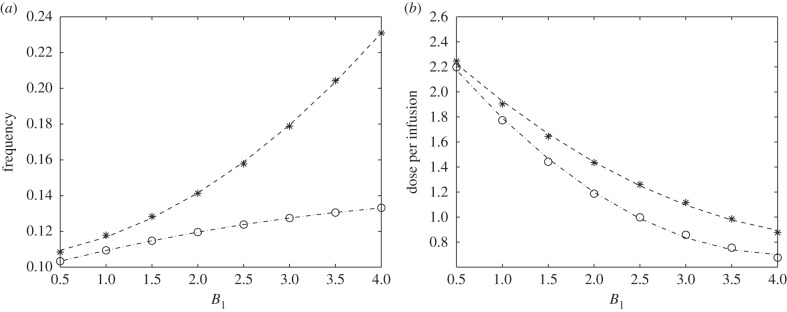
Comparison between (a) frequency and (b) dose of optimal glucose infusion for different B1 values without (asterisks) and with (circles) drug intervention. Both frequency and dose of optimal infusion are lowered when an inhibitory drug was injected in addition to optimal glucose infusion.
Since drug use has an impact on the frequency and amount of glucose per infusion, it should be anticipated that it might also alter the corresponding cost of administration. For longer total duration of administration such as one week, it can be verified that total relative cost and average relative cost (i.e. cost per infusion) of optimal glucose administration are less for extreme values of B1. Certainly, with cheaper administration cost (i.e. small B1) the total expected cost is lower. As noted above, higher B1 should have higher frequency but less glucose amount per infusion. With regard to less dose of glucose needed, less administration cost can be accounted. In figure 10, grey and black bars illustrate the total and average relative cost of glucose intravenous infusion over an administration duration of 60 h, respectively. Refer to figure 5 to note the difference of the relative cost incurred without using drug.
Figure 10.
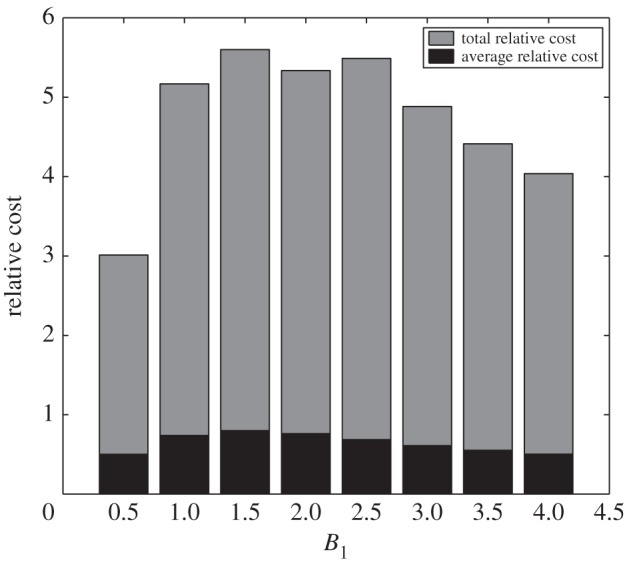
Relative cost of optimal glucose intravenous infusion with drug intervention for different values of B1. Relative cost assumes the maximum for the intermediate B1 value due to a bell-shape of the cost.
3.3. Strategy III: glucose infusion control u1(t) and drug infusion control u2(t)
Generally, an anti-cancer drug inhibits DNA synthesis and other processes in cell cycle [42]. A drug in consideration is not a typical anti-cancer drug. It is specifically designed to block the inhibition pathway of miR-451 by AMPK complex as suggested by Kim & Roh [26]. Thus, its efficiency in upregulating miR-451 activity makes it invaluable in our scheme. As in the preceding strategy, we will assume that this drug is concomitantly administered with glucose as a secondary intravenous infusion. Here, we take into account scarcity and drug cost. Hence, in addition to minimizing the cost of glucose administration, we also aim to minimize the expense involved in drug infusion. Therefore, the goal is to obtain optimal glucose and drug intravenous administration regimen which we refer to as glucose infusion control u1(t) and drug infusion control u2(t), respectively. Assumptions on initial states are similar to those of the second strategy mentioned in the previous subsection.
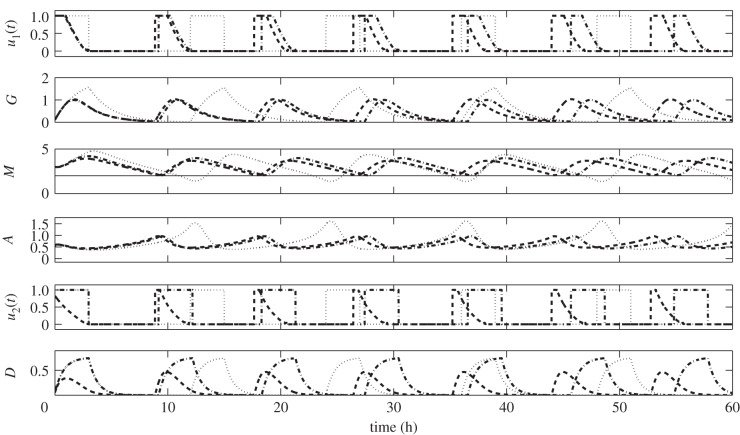
In figure 11, we can compare the difference between u1(t) with drug intervention (Strategy II) and u1(t) + u2(t) (Strategy III). The dash-dotted curves labelled GI-optimal illustrate u1(t), G, M, A, drug infusion (modified ID(t)) and D. Interpretations of which are given in the previous strategy. On the other hand, the dashed curves labelled GI-D optimal depict u1(t), G, M, A, u2(t), D. One can immediately see that u2(t) shortens the period of glucose infusion. This might be attributed to the reduced drug dose being used in the infusion and drug concentration (see u2(t) and D panels). Assuming that drug efficacy is proportional to its concentration, the reduced amount of drug also decreases its effect in upregulating M. As a result, infusion should be carried out shortly. Therefore, control of drug intravenous infusion influences the period, frequency and number of glucose infusions over a specified duration. Further, over-expression of miR-451 will be hampered by the minimum use of the drug. This will prevent the acceleration of cell growth.
Figure 11.
Comparisons among regular (dotted), optimal glucose intravenous infusion with drug intervention (GI-optimal, dash-dotted), and optimal glucose and drug intravenous infusions (GI-D optimal, dashed). Control strategies showing different time schedules of glucose and/or drug infusions and the corresponding regulation on miR-451 and AMPK complex.
Figure 12a,b plots the dose of glucose per optimal infusion for different control strategies with varying values of B1. Here, the weight parameter B2 represents the measure of drug intravenous infusion cost. It includes dosage, type, brand, medical fee for administration, etc. For comparison, we again show the curves for glucose intravenous administration control u1(t) without drug (Strategy I) and with drug intervention (Strategy II), shown in solid and dash-dotted curves, respectively. As can be seen, the frequency of glucose administration increases and the dose per optimal infusion decreases with increasing B1 for all B2 values. In addition, with u2(t), the frequency and amount per optimal glucose infusions are always lower compared with those of Strategy I but always greater relative to Strategy II for varying B1 and B2. It can be verified that as B2 increases, the frequency and dose of glucose for each optimal infusion profiles of Strategy III approach that of Strategy I. This suggests that, as the cost associated with using drug becomes more expensive, then it is optimal not to use the drug but rather increase the frequency and dose of glucose intravenous administrations.
Figure 12.
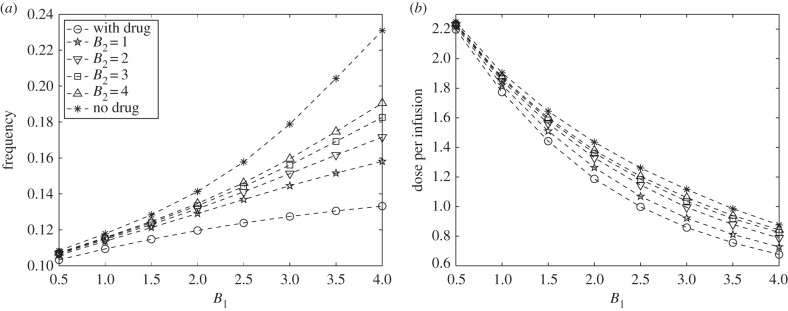
(a) Frequency and (b) dose of optimal glucose intravenous infusion for different B1 and B2 values. The relative cost of drug administration influences the frequency and dose of optimal glucose intravenous infusion.
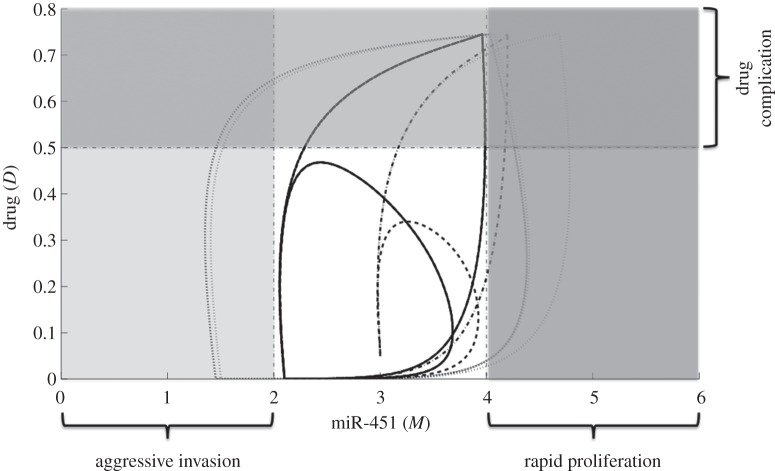
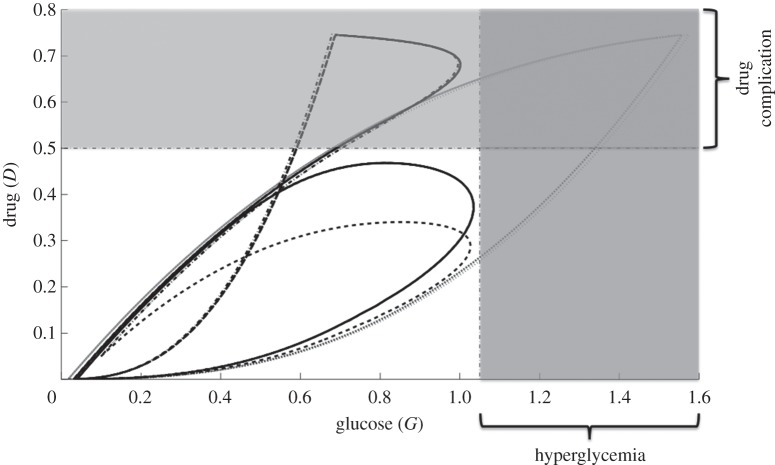
In figures 13 and 14, M–D and G–D curves among various control schemes are plotted, respectively. The dotted curve depicts the regular glucose with regular drug administration (regular). Control in glucose infusion with drug intervention (GI optimal) and both glucose and drug controls (GI-D optimal) are shown in dash-dotted and dashed curves, respectively. Regular control poses uncertainty of cell invasion to the surrounding tissue as illustrated in figure 13. This is attributed to the long period of glucose administration. Further, the regular control could also lead to rapid cell proliferation and complications to glioblastoma patients with hyperglycemia (excess glucose in the bloodstream), see dotted curves in figures 13 and 14. In GI optimal, cell switching is rather restricted but the possibility of undesirable consequences can be triggered by the use of drug (see dash-dotted curves in figures 13 and 14). Thus, an effective way of curtailing adverse complications is to regulate the glucose and drug infusions as in GI-D optimal. This administration protocol will further restrain the glioma cells in a smaller configuration prohibiting aggressive cell migration and rapid cell proliferation, at the same time reducing untoward effects of using drug.
Figure 13.
The M–D curves for different control strategies. The dotted curve shows the regular glucose with regular drug infusion regimen (regular). Glucose infusion control with drug intervention (GI-optimal) is depicted in dash-dotted curve. Optimal control on both glucose and drug (GI-D optimal) is illustrated in dashed curve. GI-D optimal constrains the M–D curves in a smaller domain avoiding aggressive invasion, rapid proliferation and drug complications.
Figure 14.
The G–D curves for different control strategies. Regular control, glucose infusion control with drug intervention (GI optimal) and glucose infusion and drug infusion controls (GI-D optimal) are depicted in dotted, dash-dotted and dashed curves, respectively. The effect of GI-D optimal limits the amount of glucose intake favorable for hyperglycemic patients.
Table 2 provides the frequency, dosage and relative cost comparing the different control strategies.
Table 2.
Summary of the different control strategies.
| strategy | frequency | dose |
relative cost |
||
|---|---|---|---|---|---|
| per infusion | total | per infusion | total | ||
| I | 0.1167 | 1.904 | 13.3273 | 0.8246 | 5.7992 |
| II | 0.1093 | 1.791 | 12.4159 | 0.7381 | 5.1667 |
| III | 0.1136 | 1.822 | 12.7515 | 0.7706 | 5.3944 |
3.4. Strategies with suboptimal controls
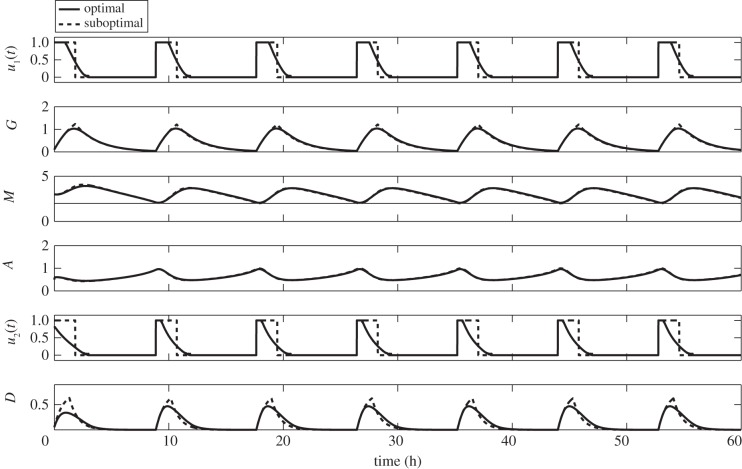
In practice, an infusion is given as a drip or slow rate of injection where dose rate and duration are determined by a medical practitioner. It could be administered continuously or intermittently. Continuous infusion requires medication for longer duration such as 24 h while intermittent infusion requires treatment at certain times. An infusion pump is used to control the flow rate and total amount to be delivered. In the preceding strategies, our optimal controls u1(t) and u2(t) represent the dose rate of glucose and drug intravenous administration, respectively. They resemble extended intermittent infusion. The optimal control curve is constant for some time intervals and continuously decreasing to zero within 3 h. It correspondingly reflects a constant and continuously decreasing dose rate within 3 h infusion before it is withdrawn. Although an infusion pump can be programmed for a certain flow rate, it would be difficult if not impossible to control continuously decreasing rate of infusion. Approximation can be done to resolve this issue. Note that the area under the optimal curve serves as the amount of glucose/drug to be injected. We can estimate this area of an optimal curve by a rectangle with the height of 1 unit. This height corresponds to the maximum dose rate that can be given which is chosen in our computations. One approach is to approximate each area of optimal curve and the other is to take the average area of optimal curves over the entire duration of administration. The first method could lead to different dosages per administration. Thus, for illustrative and practical purposes, the latter is chosen because it suggests a uniform dose rate and a fixed duration of infusion. In effect, the constant amount of glucose and/or drug per administration is determined. It can be delivered easily using a programmable infusion pump. This approximation to optimal control is referred to as suboptimal control.
The suboptimal controls applied to the three strategies follow in similar fashions. Here, we will only present Strategy III with suboptimal controls for glucose and drug infusion with corresponding dynamics of G, M and A. This is depicted in figure 15. One might observe that with suboptimal scheme (dotted curves), glucose and drug levels are slightly higher compared with the optimal strategy. Even so, concentration profiles of M and A are almost the same. Thus, risk of rapid proliferation of glioma cells is not a dire consequence. Also, glucose amount is less than regular administration of 3 h duration per infusion. Therefore, untoward complication for diabetic patients is not a serious concern.
Figure 15.
Strategy III with suboptimal controls for glucose and drug intravenous infusions. Suboptimal control achieves the goal of restraining miR-451 levels above the threshold value.
Essentially, suboptimal control yields practical information on the dose rate and duration of glucose or drug intravenous infusion. In particular, the specific times when to start and withdraw the injections are obtained. It thus provides a reasonable administration protocol which can be achieved by a programmable infusion pump. Efforts in adjusting flow rates of glucose or drug administration are then curtailed.
4. Conclusion
The periodic switching behaviour of glioblastoma cells between proliferation and invasion phases is highly influenced by fluctuating glucose levels [25,26]. In response to high glucose supply, miR-451 is upregulated activating the cells to grow. On the other hand, low glucose level upregulates AMPK complex promoting cell migration [45]. The mutual antagonistic mechanism between miR-451 and AMPK complex and cell strategic metabolic adaptation support the survival of cancer cells even in a nutrient-deprived microenvironment. In addition to rapid proliferation of glioma cells, aggressive invasion to the surrounding tissue is a major cause of treatment failure. Despite advances in medical imaging technology such as magnetic resonance imaging and positron emission tomography, glioma cells can spread beyond detection leading to tumour recurrence within 2–3 cm of the resection cavity even after surgical removal of a malignant glioma [46]. Assuming that migratory cells are localized near the surgery site [27], one possible approach is to keep the cells in their proliferative phase preventing them from invading brain tissue. As a result, tumour mass will be visible for a follow-up surgery.
The main focus of the present work lies on maintaining levels of activated miR-451 above the threshold value high enough to keep the cells from migrating back to the brain tissue. Thus, the objective of localizing glioma cells for a second surgery is formulated as an optimal control problem. Here, dose of glucose level is considered to be regulated via intravenous administration. It is further assumed that inhibition strength of miR-451 by AMPK complex is altered using a drug which can be infused in the system. In the framework of optimal control theory, we explored three strategies to achieve the goal of confining gliobastoma cells in a proliferation scheme while minimizing the cost incurred in administration of glucose and/or drug intravenous infusions. Three control strategies, namely (I) glucose infusion control, (II) glucose infusion control with drug intervention and (III) glucose infusion control and drug infusion control, are explored and compared under various circumstances. Numerical results indicate the time when to administer the injection, frequency of administration and dose of optimal infusion with minimum expense possible. It has been shown that depending on the relative cost of glucose or drug injections, frequency of administration and dose of glucose per infusion can be varied. Relatively high administration cost requires shorter administration intervals with lower dose. When a drug that suppresses the inhibitory effect of miR-451 by AMPK complex is readily available with reasonable price, glucose infusion can be administered concomitantly with drug as a secondary intravenous infusion. This strategy leads to less frequent administration with smaller dose of glucose per infusion. However, when drug is expensive and scarce, an optimal strategy is to increase the frequency and amount of glucose per infusion. It has been shown that with glucose and drug infusion controls, glioma cells are restrained from migrating to the surrounding brain tissue and growth is rather regulated. Adverse complications to glioblastoma patients with hyperglycemia and untoward effects of drug are curtailed. For practical purposes, optimal control functions are approximated to characterize an extended intermittent glucose/drug intravenous infusion where dose rate and duration are specified. This is referred to as a suboptimal control. Simulation results validated that suboptimal control also achieves the goal of maintaining high levels of miR-451 above the threshold thus preventing aggressive invasion.
Glucose infusion with/without drug even as an optimal strategy may trigger adaptive responses that (a) could change the tumour microenvironment or (b) change the tumour cell physiology. For example, some experimental evidence has shown therapeutic potential of AMPK activation in order to reverse or prevent metabolic disorders [10]. AMPK activators, not inhibitors, may be beneficial to treatments in some tumours such as colon cancers since LKB1–AMPK signalling inhibits mTOR, a kinase over-expressed in a wide range of tumours [47]. Thus, these events (a,b) may be able to resume the proliferative and migratory potential of residual glioblastoma cells. In general, control regulation of the growth and regrowth of invasive cells before or after a major surgery might lead to development of better therapeutic strategies. Failure in the detection of infiltrating glioma cells using advanced imaging causes fatality even after extensive surgery. Surgical resection of a larger portion of glioblastoma comes at the cost of impairment of neurologic function [36,46] and does not generate better clinical outcomes [48]. Thus, better understanding of miR-451–AMPK complex pathways may shed light on eliminating invasive cells using glucose-induced regrowth [27]. Consequently, our optimal control approach may provide insights in the design of anti-invasion therapeutic strategy to prevent glioma cells from invading brain tissues.
The results of this paper serve as a basis for more detailed modelling and experimentation. Further investigations include the effect of time delays in response to a drug activating/suppressing inhibitory effect of miR-451 by AMPK complex. In relation to efficacy of conventional chemotherapeutic drug use, its poor performance is attributed to resistance due to perturbations in cell-cycle dynamics. The infiltrative portion of the glioma is not susceptible to the conventional chemotherapeutic agents and has to be targeted separately [46]. Thus, an extension of the modelling approach should incorporate the dynamics of cell cycle coupled with core control miR-451–AMPK complex mechanism. The current model does not consider the heterogeneity in tumour microenvironment which could influence regulation of fluctuating glucose supply [49]. Some important components of the microenvironment influencing cell growth and migration of glioblastoma such as fibroblasts, endothelial cells, perivascular pericytes, vascular smooth muscle cells and immune cells, as well as cytokines and growth factors secreted by these cells are not included in this study [50]. A holistic comprehension of the complex interrelationship of different aspects governing proliferation and invasion mechanism in cancer cells may lead to optimal therapeutic approaches.
Supplementary Material
Acknowledgement
A.A.d.l.R.V. is grateful to the Institute of Mathematics, University of the Philippines Diliman for allowing him to conduct his research at Konkuk University.
Funding statement
The research works of E.J. and A.A.d.l.R.V. are supported by a National Research Foundation of Korea (NRF) grant funded by the Korean government (MEST) (no. 2012R1A2A2A01011725). Y.K. is supported by the Basic Science Research Program through the National Research Foundation of Korea (2012R1A1A1043340). E.J.'s work also resulted from the Konkuk University research support program.
References
- 1.Chintala SK, Tonn JC, Rao JS. 1999. Matrix metalloproteinases and their biological function in human gliomas. Int. J. Dev. Neurosci. 17, 495–502. ( 10.1016/S0736-5748(99)00010-6) [DOI] [PubMed] [Google Scholar]
- 2.Furnari FB, et al. 2007. Malignant astrocytic glioma: genetics, biology, and paths to treatment. Genes Dev. 21, 2683–2710. ( 10.1101/gad.1596707) [DOI] [PubMed] [Google Scholar]
- 3.Vander Heiden MG, Cantley LC, Thompson CB. 2009. Understanding the Warburg effect: the metabolic requirements of cell proliferation. Science 324, 1029–1033. ( 10.1126/science.1160809) [DOI] [PMC free article] [PubMed] [Google Scholar]
- 4.Kim JW, Dang CV. 2006. Cancer's molecular sweet tooth and the Warburg effect. Cancer Res. 15, 8927–8930. ( 10.1158/0008-5472.CAN-06-1501) [DOI] [PubMed] [Google Scholar]
- 5.Gatenby RA, Gillies RJ. 2004. Why do cancers have high aerobic glycolysis? Nat. Rev. Cancer 4, 891–899. ( 10.1038/nrc1478) [DOI] [PubMed] [Google Scholar]
- 6.Xu RH, Pelicano H, Zhou Y, Carew JS, Feng L, Bhalla KN, Keating MJ, Huang P. 2005. Inhibition of glycolysis in cancer cells: a novel strategy to overcome drug resistance associated with mitochondrial respiratory defect and hypoxia. Cancer Res. 65, 613–621. [PubMed] [Google Scholar]
- 7.Godlewski J, et al. 2010. MicroRNA-451 regulates LKB1/AMPK signaling and allows adaptation to metabolic stress in glioma cells. Mol. Cell 37, 620–632. ( 10.1016/j.molcel.2010.02.018) [DOI] [PMC free article] [PubMed] [Google Scholar]
- 8.Jones RG, Thompson CB. 2009. Tumor suppressors and cell metabolism: a recipe for cancer growth. Genes Dev. 23, 537–548. ( 10.1101/gad.1756509) [DOI] [PMC free article] [PubMed] [Google Scholar]
- 9.Hardie DG. 2007. AMP-activated/SNF1 protein kinases: conserved guardians of cellular energy. Nat. Rev. Mol. Cell Biol. 8, 774–785. ( 10.1038/nrm2249) [DOI] [PubMed] [Google Scholar]
- 10.Viollet B, Horman S, Leclerc J, Lantier L, Foretz M, Billaud M, Giri S, Andreelli F. 2010. AMPK inhibition in health and disease. Crit. Rev. Biochem. Mol. Biol. 45, 276–295. ( 10.3109/10409238.2010.488215) [DOI] [PMC free article] [PubMed] [Google Scholar]
- 11.Schafer ZT, Grassian AR, Song L, Jiang Z, Gerhart-Hines Z, Irie HY, Gao S, Puigserver P, Brugge JS. 2009. Antioxidant and oncogene rescue of metabolic defects caused by loss of matrix attachment. Nature 461, 109–113. ( 10.1038/nature08268) [DOI] [PMC free article] [PubMed] [Google Scholar]
- 12.Zhou G, et al. 2001. Role of AMP-activated protein kinase in mechanism of metformin action. J. Clin. Invest. 108, 1167–1174. ( 10.1172/JCI13505) [DOI] [PMC free article] [PubMed] [Google Scholar]
- 13.Bartel DP. 2009. MicroRNAs: target recognition and regulatory functions. Cell 136, 215–233. ( 10.1016/j.cell.2009.01.002) [DOI] [PMC free article] [PubMed] [Google Scholar]
- 14.Esquela-Kerscher A, Slack FJ. 2006. Oncomirs—microRNAs with a role in cancer. Nat. Rev. Cancer 6, 259–269. ( 10.1038/nrc1840) [DOI] [PubMed] [Google Scholar]
- 15.Godlewski J, et al. 2008. Targeting of the Bmi-1 oncogene/stem cell renewal factor by microRNA-128 inhibits glioma proliferation and self-renewal. Cancer Res. 68, 9125–9130. ( 10.1158/0008-5472.CAN-08-2629) [DOI] [PubMed] [Google Scholar]
- 16.Lawler S, Chiocca EA. 2009. Emerging functions of microRNAs in glioblastoma. J. Neurooncol. 92, 297–306. ( 10.1007/s11060-009-9843-2) [DOI] [PubMed] [Google Scholar]
- 17.Singh PK, Mehla K, Hollingsworth MA, Johnson KR. 2011. Regulation of aerobic glycolysis 737 by microRNAs in cancer. Mol. Cell Pharmacol. 3, 125–134. [PMC free article] [PubMed] [Google Scholar]
- 18.Song Y, Wang P, Zhao W, Yao Y, Liu X, Ma J, Xue Y, Liu Y. 2014. MiR-18a regulates the proliferation, migration and invasion of human glioblastoma cell by targeting neogenin. Exp. Cell Res. 324, 54–64. ( 10.1016/j.yexcr.2014.03.009) [DOI] [PubMed] [Google Scholar]
- 19.Guo M, et al. 2014. miR-656 inhibits glioma tumorigenesis through repression of BMPR1A. Carcinogenesis 35, 1698–1706. ( 10.1093/carcin/bgu030) [DOI] [PubMed] [Google Scholar]
- 20.Yang TQ, et al. 2014. MicroRNA-16 inhibits glioma cell growth and invasion through suppression of BCL2 and the nuclear factor-κB1/MMP9 signaling pathway. Cancer Sci. 105, 265–271. ( 10.1111/cas.12351) [DOI] [PMC free article] [PubMed] [Google Scholar] [Retracted]
- 21.Ma J, Yao Y, Wang P, Liu Y, Zhao L, Li Z, Li Z, Xue Y. 2014. MiR-152 functions as a tumor suppressor in glioblastoma stem cells by targeting Krüppel-like factor 4. Cancer Lett. 355, 85–95. ( 10.1016/j.canlet.2014.09.012) [DOI] [PubMed] [Google Scholar]
- 22.Wang L, et al. 2014. MiR-143 acts as a tumor suppressor by targeting N-RAS and enhances temozolomide-induced apoptosis in glioma. Oncotarget 5, 5416–5427. [DOI] [PMC free article] [PubMed] [Google Scholar]
- 23.Gabriely G, Wurdinger T, Kesari S, Esau CC, Burchard J, Linsley PS, Krichevsky AM. 2008. MicroRNA 21 promotes glioma invasion by targeting matrix metalloproteinase regulators. Mol. Cell Biol. 28, 5369–5380. ( 10.1128/MCB.00479-08) [DOI] [PMC free article] [PubMed] [Google Scholar]
- 24.Shi L, Wang Z, Sun G, Wan Y, Guo J, Fu X. 2014. miR-145 inhibits migration and invasion of glioma stem cells by targeting ABCG2. Neuromolecular Med. 16, 517–528. ( 10.1007/s12017-014-8305-y) [DOI] [PubMed] [Google Scholar]
- 25.Kim Y, Roh S, Lawler S, Friedman A. 2011. miR451 and AMPK mutual antagonism in glioma cell migration and proliferation: a mathematical model. PLoS ONE 6, e28293 ( 10.1371/journal.pone.0028293) [DOI] [PMC free article] [PubMed] [Google Scholar]
- 26.Kim Y, Roh S. 2013. A hybrid model for cell proliferation and migration in glioblastoma. Discrete Contin. Dyn. Syst. Ser. B 18, 969–1015. ( 10.3934/dcdsb.2013.18.969) [DOI] [Google Scholar]
- 27.Kim Y. 2013. Regulation of cell proliferation and migration in glioblastoma: new therapeutic approach. Front. Oncol. 3, 53 ( 10.3389/fonc.2013.00053) [DOI] [PMC free article] [PubMed] [Google Scholar]
- 28.Burger PC, Dubois PJ, Schold SC, Jr, Smitch KR, Jr, Odom GL, Crafts DC, Giangaspero F. 1983. Computerized tomographic and pathologic studies of the untreated, quiescent, and recurrent glioblastoma multiforme. J. Neurosurg. 58, 159–169. ( 10.3171/jns.1983.58.2.0159) [DOI] [PubMed] [Google Scholar]
- 29.Gaspar LE, Fisher BJ, Macdonald DR, LeBer DV, Halperin EC, Schold SC, Jr, Cairncross JG. 1992. Supratentorial malignant glioma: patterns of recurrence and implications for external beam local treatment. Int. J. Radiat. Oncol. Biol. Phys. 24, 55–57. ( 10.1016/0360-3016(92)91021-E) [DOI] [PubMed] [Google Scholar]
- 30.Joshi HR. 2002. Optimal control of an HIV immunology model. Optimal Control Appl. Methods 23, 199–213. ( 10.1002/oca.710) [DOI] [Google Scholar]
- 31.Kwon HD. 2007. Optimal treatment strategies derived from a HIV model with drug-resistant mutants. Appl. Math. Comput. 188, 1193–1204. ( 10.1016/j.amc.2006.10.071) [DOI] [Google Scholar]
- 32.Jung E, Lenhart S, Feng Z. 2002. Optimal control of treatments in a two-strain tuberculosis model. Discrete Contin. Dyn. Syst. Ser. B 2, 473–482. ( 10.3934/dcdsb.2002.2.473) [DOI] [Google Scholar]
- 33.Whang S, Choi S, Jung E. 2011. A dynamic model for tuberculosis transmission and optimal treatment strategies in South Korea. J. Theor. Biol. 279, 120–131. ( 10.1016/j.jtbi.2011.03.009) [DOI] [PubMed] [Google Scholar]
- 34.Jung E, Lenhart S, Protopopescu V, Babbs C. 2008. Optimal control applied to a thoraco-abdominal CPR. Math. Med. Biol. 25, 157–170. ( 10.1093/imammb/dqn009) [DOI] [PubMed] [Google Scholar]
- 35.Jung E, Babbs CF, Lenhart S, Protopopescu VA. 2006. Optimal strategy for cardiopulmonary resuscitation with continuous chest compression. Acad. Emerg. Med. 13, 715–721. ( 10.1111/j.1553-2712.2006.tb01709.x) [DOI] [PubMed] [Google Scholar]
- 36.Farin A, Suzuki SO, Weiker M, Goldman JE, Bruce JN, Canoll P. 2006. Transplanted glioma cells migrate and proliferate on host brain vasculature: a dynamic analysis. Glia 53, 799–808. ( 10.1002/glia.20334) [DOI] [PubMed] [Google Scholar]
- 37.Derr RL, Ye X, Islas MU, Desideri S, Saudek CD, Grossman SA. 2009. Association between hyperglycemia and survival in patients with newly diagnosed glioblastoma. J. Clin. Oncol. 27, 1082–1086. ( 10.1200/JCO.2008.19.1098) [DOI] [PMC free article] [PubMed] [Google Scholar]
- 38.Crute BE, Seefeld K, Gamble J, Kemp BE, Witters LA. 1998. Functional domains of the alpha1 catalytic subunit of the AMP-activated protein kinase. J. Biol. Chem. 273, 35 347–35 354. ( 10.1074/jbc.273.52.35347) [DOI] [PubMed] [Google Scholar]
- 39.Aguda BD, Kim Y, Piper-Hunter MG, Friedman A, Marsh CB. 2008. MicroRNA regulation of a cancer network: consequences of the feedback loops involving miR-17–92, E2F, and Myc. Proc. Natl Acad. Sci. USA 105, 19 678–19 683. ( 10.1073/pnas.0811166106) [DOI] [PMC free article] [PubMed] [Google Scholar]
- 40.Gantier MP, et al. 2011. Analysis of microRNA turnover in mammalian cells following Dicer1 ablation. Nucl. Acids Res. 39, 5692–5703. ( 10.1093/nar/gkr148) [DOI] [PMC free article] [PubMed] [Google Scholar]
- 41.De Gaetano A, Arino O. 2000. Mathematical modelling of the intravenous glucose tolerance test. J. Math. Biol. 40, 136–168. ( 10.1007/s002850050007) [DOI] [PubMed] [Google Scholar]
- 42.Powathil GG, Gordon KE, Hill LA, Chaplain MAJ. 2012. Modelling the effects of cell-cycle heterogeneity on the response of a solid tumour to chemotherapy: biological insights from a hybrid multiscale cellular automaton model. J. Theor. Biol. 308, 1–19. ( 10.1016/j.jtbi.2012.05.015) [DOI] [PubMed] [Google Scholar]
- 43.Gordon K. 2006. Mathematical modelling of cell-cycle-dependent chemotherapy drugs: implications for cancer treatment, PhD thesis, University of Dundee, UK. [Google Scholar]
- 44.Dhooge A, Govaerts W, Kuznetsov YA. 2003. Matcont: a Matlab package for numerical bifurcation analysis of ODEs. ACM TOMS 29, 141–164. ( 10.1145/779359.779362) [DOI] [Google Scholar]
- 45.Godlewski J, Bronisz A, Nowicki MO, Chiocca EA, Lawler S. 2010. microRNA-451: a conditional switch controlling glioma cell proliferation and migration. Cell Cycle 9, 2742–2748. ( 10.4161/cc.9.14.12248) [DOI] [PubMed] [Google Scholar]
- 46.Giese A, Bjerkvig R, Berens ME, Westphal M. 2003. Cost of migration: invasion of malignant gliomas and implications for treatment. J. Clin. Oncol. 21, 1624–1636. ( 10.1200/JCO.2003.05.063) [DOI] [PubMed] [Google Scholar]
- 47.Buzzai M, Jones RG, Amaravadi RK, Lum JJ, DeBerardinis RJ, Zhao F, Viollet B, Thompson CB. 2007. Systemic treatment with the antidiabetic drug metformin selectively impairs p53-deficient tumor cell growth. Cancer Res. 67, 6745–6752. ( 10.1158/0008-5472.CAN-06-4447) [DOI] [PubMed] [Google Scholar]
- 48.Wesseling P, Kros JM, Jeuken JWM. 2011. The pathological diagnosis of diffuse gliomas: towards a smart synthesis of microscopic and molecular information in a multidisciplinary context. Diagn. Histopathol. 17, 486–494. ( 10.1016/j.mpdhp.2011.08.005) [DOI] [Google Scholar]
- 49.Kim Y, Lawler S, Nowicki MO, Chiocca EA, Friedman A. 2009. A mathematical model for pattern formation of glioma cells outside the tumor spheroid core. J. Theor. Biol. 260, 359–371. ( 10.1016/j.jtbi.2009.06.025) [DOI] [PubMed] [Google Scholar]
- 50.Charles NA, Holland EC, Gilbertson R, Glass R, Kettenmann H. 2011. The brain tumor microenvironment. Glia 59, 1169–1180. ( 10.1002/glia.21136) [DOI] [PubMed] [Google Scholar]
Associated Data
This section collects any data citations, data availability statements, or supplementary materials included in this article.


