Abstract
Percutaneous cochlear implantation (PCI) is a minimally invasive image-guided cochlear implant approach, where access to the cochlea is achieved by drilling a linear channel from the skull surface to the cochlea. The PCI approach requires pre- and intra-operative planning. Computation of a safe linear drilling trajectory is performed in a pre-operative CT. This trajectory is mapped to intra-operative space using the transformation matrix that registers the pre- and intra-operative CTs. However, the difference in orientation between the pre- and intra-operative CTs is too extreme to be recovered by standard, gradient descent based registration methods. Thus far, the registration has been initialized manually by an expert. In this work we present a method that aligns the scans completely automatically. We compared the performance of the automatic approach to the registration approach when an expert does the manual initialization on 11 pairs of scans. There is a maximum difference of 0.18 mm between the entry and target points of the trajectory mapped with expert initialization and the automatic registration method. This suggests that the automatic registration method is accurate enough to be used in a PCI surgery.
Index Terms: Cochlear implant, cortical surface, feature extraction, level set, pre- and intra-operative CT, spin image registration
I. Introduction
Cochlear implantation (CI) is a procedure in which an electrode array is surgically implanted in the cochlea to treat hearing loss. The electrode array, inserted into the cochlea via either a natural opening (the round window) or a drilled opening (cochleostomy), receives signals from an external device worn behind the ear. The external device is composed of a microphone, a sound processor and a signal transmitter component. The microphone senses sound signals. The sound processor selects and arranges sound sensed by the microphone. The signal transmitter converts the processed sound into electrical impulses and sends them to the internal receiver, which delivers the impulses to the electrodes in the implanted array. The electrodes send the electrical impulses to different regions of the auditory nerve. Conventionally, CIs require wide surgical excavation of the mastoid region of the temporal bone so that the surgeon can locate sensitive ear anatomy and achieve access to the cochlea. We have recently introduced a minimally invasive image-guided CI procedure referred to as percutaneous cochlear implantation (PCI) [1]. In PCI, access to the cochlea is achieved by drilling a linear channel from the outer part of the skull into the cochlea that passes within millimeters of, and avoids damage to, critical ear anatomy. The drilling trajectory is computed on a pre-operative CT scan prior to surgery using algorithms that we have developed to find a path that optimally preserves the safety of critical components of the ear including the ossicles, cochlea, external auditory canal, facial nerve, and chorda tympani [2]. The pre-operatively computed trajectory is guided by a customized microstereotactic frame, a device designed by our group that constrains the drill bit to follow the computed drilling trajectory to achieve safe access to the cochlea [3].
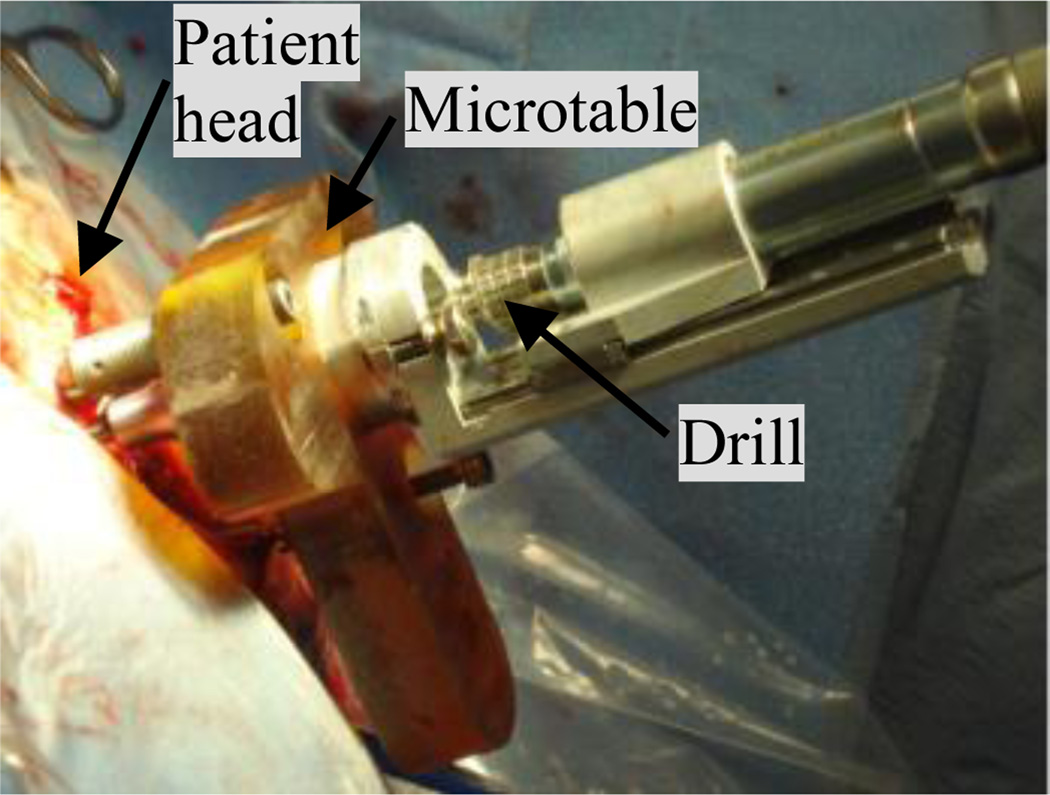
The PCI approach consists of pre-operative planning, intra-operative registration, drill guide fabrication, and drilling, which are summarized as follows: (1) Pre-operative planning: A CT scan of the patient is acquired prior to surgery. Ear anatomy is automatically identified and accurately segmented using algorithms we have previously validated and reported on [4]–[7]. These algorithms rely on models of the anatomy defined on an atlas image. The algorithms start by automatically registering the atlas image to the pre-operative image. An optimally safe drilling trajectory is computed based on the segmented ear anatomy [2]. (2) Intra-operative registration: On the day of surgery three fiducial markers are implanted on the region of the skull behind the patient’s ear – typically located at the inferior, posterior, and superior regions of the temporal bone. The marker consists of an anchor that is screwed into the bone, a metal sphere that serves as a fiducial marker, and a tubular extender that connects the two. Then, an intraoperative CT scan of the head with the markers in place is obtained using a flat panel volumetric computerized tomography (fpVCT) machine - the xCAT ENT mobile CT scanner (Xoran Technologies, Ann Arbor, MI) with voxel size of 0.3 × 0.3 × 0.3 mm3. The pre- and intra-operative images are manually brought into rough alignment. The manual alignment can be performed either by manually translating and rotating the images or selecting three or more homologous points in each scan. Subsequently, the images are automatically registered using an intensity-based rigid-body registration method that uses mutual information (MI) as the similarity measure [8]. The marker centers are identified automatically [9]. Next, the pre-operatively computed drilling trajectory is transformed, using the obtained rigid body transformation, into the intra-operative image space, and thus into the same space as the identified fiducial markers. (3) Drill guide fabrication: The customized microstereotactic frame, which we refer to as a Microtable, is a patient specific drill guide that is manufactured from a slab of Ultem (Quadrant Engineering Plastic products, Reading, PA). Fabrication of the microtable necessitates the determination of the location and depth of four holes. Three of the holes couple to the spherical extenders mounted on the bone-implanted markers and the fourth hole (targeting hole) is determined such that it is collinear with the drilling trajectory. In addition, the lengths of the three legs that connect the tabletop of the Microtable to the markers need to be specified. The intra-operative component of our proprietary software generates the command file required to manufacture the Microtable using a CNC machine (Ameritech CNC, Broussard Enterprise, Inc., Santa Fe Springs, CA). The CNC machine takes approximately four minutes to fabricate one Microtable. (4) Drilling: After sterilization, the Microtable is mounted on the marker spheres, and a drill press is attached to the targeting hole. Finally, drilling is performed with a 1.5 mm diameter drill bit, which is guided along the pre-operatively planned drilling-trajectory through the targeting hole and perpendicular to the tabletop of the Microtable. Fig. 1 illustrates the Microtable mounted on a patient’s head with surgical drill attached.
Fig. 1.
Drill attached to the Microtable, which is mounted on the patient head.
The manual registration in the intra-operative registration step of the process is typically performed by selecting three or more homologous points in each scan. The transformation matrix that registers these points is used to roughly align the scans. This article presents a method to automate the process. It is important because: (1) manually initializing the registration process requires someone who is expert in both temporal bone ear anatomy and in using the planning software to be present at every surgery; and (2) the registration step is a time critical process because it must be completed before the next step of the intervention – creation of a customized microstereotactic frame – can be undertaken. Since this is a critical bottleneck, manual intervention is often stressful as extra time required to perform this step may prolong the surgical intervention.
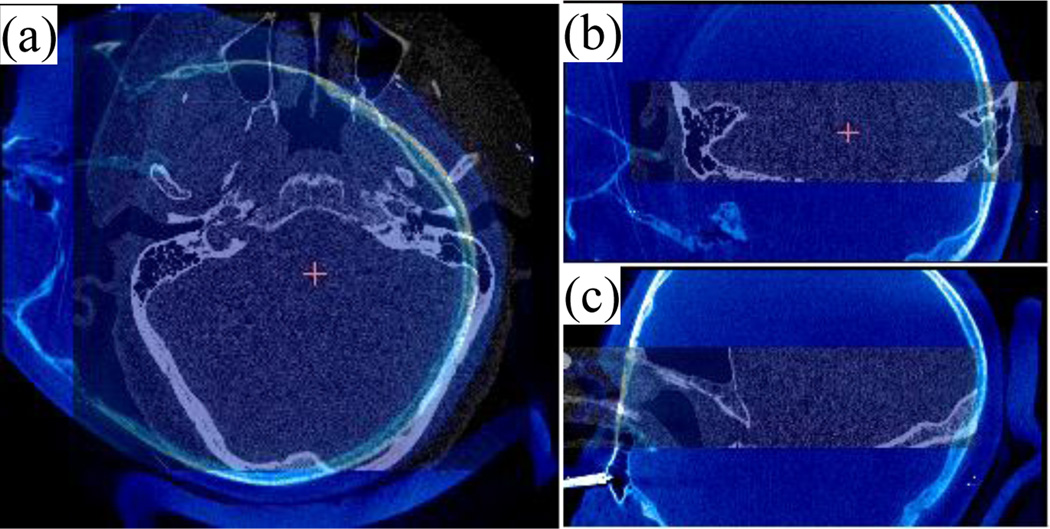
Several properties of the intra-operative images obtained with the fpVCT complicate automation of this process. While using a fpVCT machine is desirable because it is portable and acquires images with relatively low radiation dose, the images acquired are noisy and suffer from severe intensity inhomogeneity. This diminishes the capture range of standard gradient descent-based registration techniques. Table I shows the capture ranges of the intensity-based registration for the image pairs used in this study. To compute the capture range the three translations and three rotation angles were modified in increments of 1mm and 1°, respectively, from the optimal solution until the error distance between the “entry” and “target” points along the drilling trajectory mapped using the optimal transformation and the new transformation is above 0.5 mm. The translation and rotation capture ranges are computed as the smallest of the three final translations and the three final rotation angles. As can be seen in the table, the capture range can be as small as 8 mm translation or 9° rotation. Furthermore, the position, orientation, and field of view (FOV) of the patient’s head in the intra-operative CT are unconventional and inconsistent. Thus, the variation in head orientation and position is much larger than the capture range of the image registration algorithm. The inconsistent FOV results in exclusion of regions of the patient’s head, which prevents the use of orientation matching techniques such as alignment of the pre- and intra-operative images by principal components analysis. Fig. 2 shows a typical pre-registered intra-operative image (shown in bluescale) overlaid with a pre-operative image (grayscale) in axial, coronal, and sagittal views.
TABLE I.
Capture ranges of pre- and intra-operative Image pairs
| Translation | Rotation | |
|---|---|---|
| 1 | 26 mm | 16° |
| 2 | 14 mm | 11° |
| 3 | 20 mm | 17° |
| 4 | 13 mm | 10° |
| 5 | 18 mm | 17° |
| 6 | 12 mm | 14° |
| 7 | 19 mm | 19° |
| 8 | 36 mm | 15° |
| 9 | 27 mm | 16° |
| 10 | 23 mm | 18° |
| 11 | 20 mm | 18° |
| 12 | 8 mm | 9° |
Fig. 2.
Intra-operative (blue and white) overlaid on pre-operative (black and white) CT image shown in axial (a), coronal (b) and sagittal (c) view.
We have recently presented a method for a coarse registration that is accurate enough to replace the manual initialization process currently used in the intra-operative registration step [10]. This method relies on extracting corresponding features from each image and computes a transformation that best aligns these features. Although this method leads to results that are as accurate as the manual initialization-based approach, it cannot be used in the clinical workflow because it still requires some manual intervention and is too slow to be used in the operating room. In this work, we present a completely automatic registration for pre- and intra-operative image registration. We have tested this approach on 11 pre- and intra-operative images. It is fast and leads to results that are as accurate as those achieved using the manual initialization-based approach. This suggests that the automatic approach we propose can be used for PCI surgery.
II. Methods
A. Data
In this study, we conducted experiments on 11 pairs of pre- and intra-operative CT scans. In the planning processes, we also use a pre-operative atlas scan and an intra-operative reference scan. The scans are acquired from several scanners—GE BrightSpeed (GE Healthcare, Milwaukee, WI), Philips Mx8000 IDT, Philips iCT, and Philips Brilliance 64 (Philips Medical Systems, Eindhoven, the Netherlands) for pre-operative imaging, and a portable fpVCT machine (xCAT ENT, Xoran Technologies, Ann Arbor, MI) for intra-operative imaging. Each pair of testing images consists of pre- and intra-operative CT scans of the same patient. Typical scan resolutions are 768 × 768 × 145 voxels with 0.2 mm × 0.2 mm × 0.3 mm voxel size for pre-operative images and 700 × 700 × 360 voxels with 0.3 mm × 0.3 mm × 0.3 mm.
B. Overview
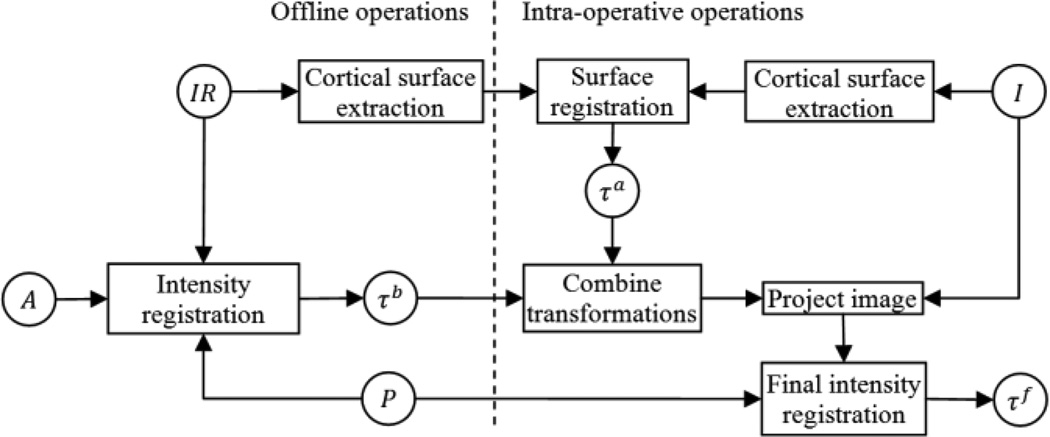
In this subsection we present an overview of the process we use to perform automatic registration of our pre- and intra-operative CTs. The approach will be detailed in following subsections. Our approach consists of two main steps. First, we perform a coarse registration using a scheme that is invariant to initial pose. Next, the registration is refined using a standard intensity-based registration. The coarse registration sub-routine is also a multistep process. Given a “target” pre-operative and “target” intra-operative CT that we wish to register, we first register the cortical surface, which is extracted using a level set segmentation scheme, of the target intra-operative image to the cortical surface of a reference volume, which we refer to as the intra-operative reference volume, using a pose invariant surface registration algorithm [11]. This reference volume is registered automatically offline to the target pre-operative CT. The final coarse registration between the pre- and intra-operative CTs is computed using the compound transformation. This multistep approach is used, rather than performing a surface registration between the target pre- and intra-operative CTs directly because the surface registration algorithm is sensitive to differences in FOV, and the target pre-operative CT is typically limited in FOV to only the temporal bone region. Thus we have instead chosen to perform registration with a reference volume in which the entire cortical surface is included.
A flow chart of the pre- to intra-operative CT registration process is shown in Fig. 3. In this flow chart, a rectangle represents an operation on images, and a circle represents a transformation matrix when the text is in Greek letters and an image when the text is in Roman letters. P and I are the target pre- and intra-operative images we want to register. IR is the intra-operative reference image. IR is registered by hand once offline to a pre-operative atlas CT A, and A is automatically registered to P in the pre-operative planning stage using standard intensity-based techniques. Thus, using the compound transformation, offline registration between IR and P is achieved automatically prior to surgery. The cortical surface of IR is extracted with a procedure described in Section II.C. The first step of the process that must be performed online intra-operatively is to apply the same surface extraction technique done offline on IR to I for cortical surface extraction of the target intra-operative CT. Then, the cortical surface of I is rigidly registered to the cortical surface of IR via a feature-based registration method called spin-image registration described in Section II.D [11]. Then, to define the coarse registration between I to P, we combine the transformation matrices obtained from the spin-image registration and the offline intensity-based registration, τa and τb. The final registration transformation τf is obtained by refining the coarse registration by performing a standard intensity-based rigid registration between the coarsely registered images.
Fig. 3.
Registration flow chart.
C. Level Set Segmentation of the Cortical Surface
The cortical surface was chosen as the surface of interest for registration because it has surface features that are spatially distinct yet similar across subjects. To extract the 3D cortical surface in the intra-operative CT images, we use a level set segmentation method [12]. The level set evolves a surface using information from a high dimensional function. The high dimensional time-dependent function, usually defined as a signed distance map, is called the embedding function ϕ(x, t), and the zero level set Γ(x, t) = {ϕ(x, t) = 0} represents the evolving surface. The evolution of the surface in time is governed by
| (1) |
The term D(I) specifies the speed of evolution at each voxel in I, and the mean curvature ∇ • ∇ϕ/|∇ϕ| is a regularizing term that constrains the evolving surface to be smooth. We designed the speed term that guides the evolution of the surface using the result obtained after applying a “sheetness” filter to I, described in the following subsection. The level set method also requires the initial embedding function ϕ(x, t = 0) to be defined. We initialize the embedding function automatically with a procedure described below. In the experiments we conducted, α is empirically set to 0.8.
Sheetness Filter
As will be described below, our speed function and our procedure for initialization of the embedding function rely on voxel “sheetness” scores computed by applying a sheetness filter to I [13]. The sheetness filter uses the eigenvalues of the local Hessian matrix to compute a sheetness score that is high for voxels that are near centers of sheet-like structures and low otherwise. To compute this quantity, three ratios, Rsheet, Rblob, and Rnoise defined below, are computed. For a given voxel, x, |λ1| ≤ |λ2| ≤ |λ3| are the eigenvalues of the local Hessian matrix.
Sheet-like structures result in eignenvalue conditions |λ1| ≈ |λ2| ≈ 0, |λ3| ≫ 0, and the corresponding ratio (Rsheet) is zero for these structures. Blob-like structures result in eigenvalues conditions |λ1| ≈ |λ2| ≈ |λ3|, and the corresponding ration (Rblob) is zero for small aggregations of tissues. Then, the sheetness measure, S, which is defined as the maximum score over all scales σ at which the Hessian is computed, can be computed using the following equations:
| (2) |
| (3) |
| (4) |
and
| (5) |
The values of α, β and γ, as suggested in [13], are chosen to be 0.5, 0.5, and 500. Σ refers to the scales of the Hessian matrix, which are chosen to be {0.5, 1.0,…, 3 voxels}. At a given scale, if λ3 > 0, which occurs when the filter detects a dark structure with bright background, S(x) is set to 0 because we wish to detect bone, which is bright in CT. When λ3 ≤ 0, the equation is designed so that S(x) is high when a sheetlike structure is detected. The overall sheetness score S(x) ∈ [0, 1] will be high for bright sheetlike structures, which includes bone as well as some soft tissue structures. Fig. 4b shows the resulting sheetness score H of the image I in Fig. 4a.
Fig. 4.
Images used in the level set initialization process. (a) Sagittal view of intra-operative CT, (b) H, the sheetness filter output, and (c) voxels used to estimate Tbone.
Level Set Initialization
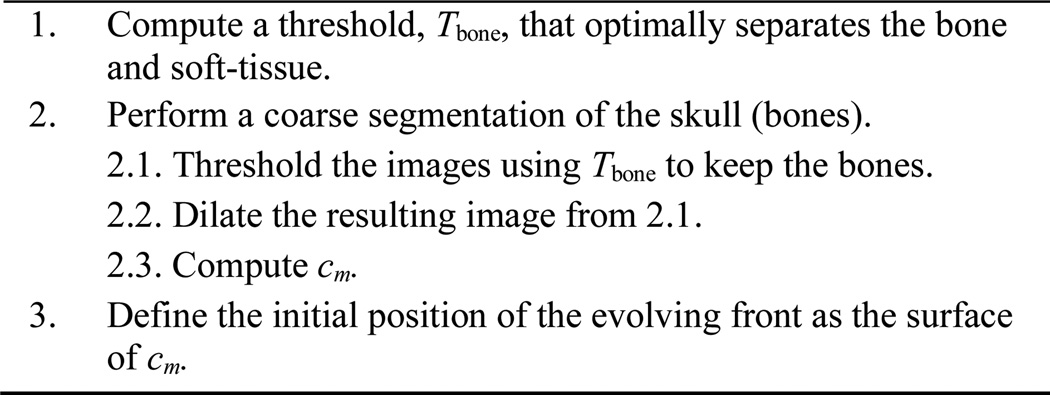
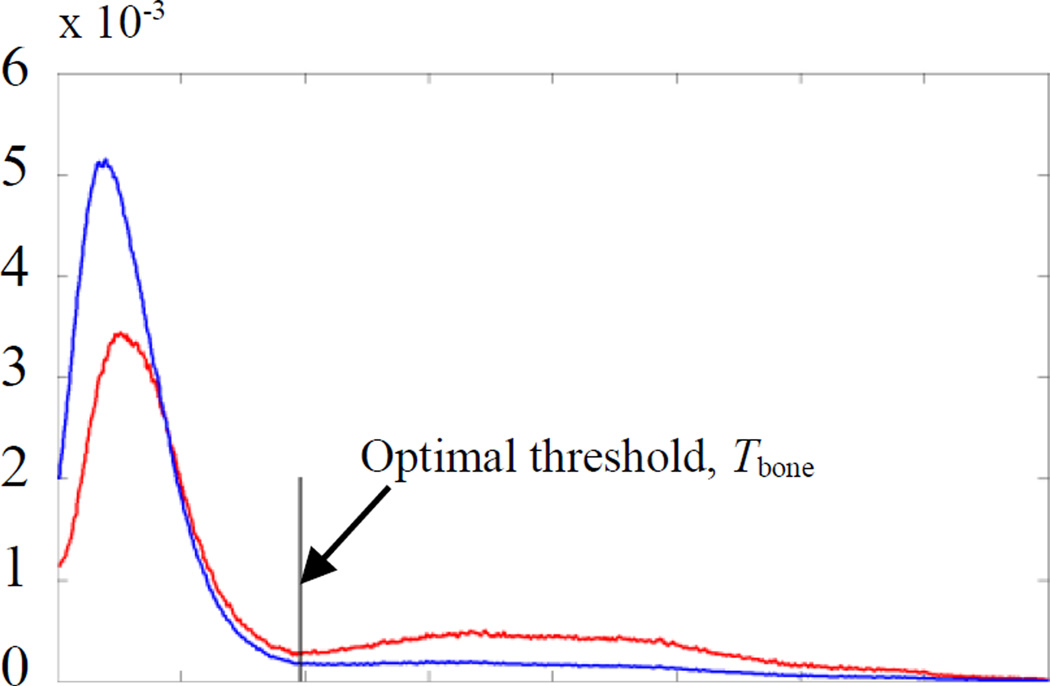
We initialize the embedding function as a signed distance map with zero level inside the external cortical surface and design our speed function to expand until reaching the cortex/skull interface. Since some parts of the cortical surface have little contrast with surrounding structures, leaking of the level set could occur. To minimize the possibility of leakage, we have designed an approach in which we only propagate the evolving front for a fixed number of iterations (20 in our experiments). We initialize the evolving front such that its distance to the external cortical surface is approximately constant over its surface so that the required number of iterations is consistent. The procedure we use to identify this initialization surface consists of three main steps that are outlined in Fig. 5: (1) A threshold, Tbone, that optimally separates the bone from soft-tissue structures is computed based on the intensity histogram of the image using the Reddi’s method [14]. However, instead of trying to compute a value for Tbone using the histogram of the whole image, which generally includes several peaks and valleys, we limit the histogram to contain information only from voxels that correspond to bone and sheetlike soft tissue structures, creating a histogram with one distinct valley, and thus simplifying the problem. Specifically, we use the intensity histogram of voxels with: (a) a sheetness score greater than 0.5, which removes information from noisy voxels that do not belong to bright sheetlike structures such as bone and sharpens the histogram so that the valleys are more distinct; and (b) intensity greater than −100, which removes extraneous valleys that exist at lower intensities. Fig. 6 shows the intensity histogram of voxels that satisfy conditions (a) and (b) (shown as red curve) and voxels that satisfy only (b) (shown as blue curve). (2) A coarse segmentation of the skull is performed by thresholding the image using Tbone. This results in a binary image that contains the skull, some sheetlike soft-tissue structures, and some metal-related artifacts. Then, we enlarge the boundaries of the skull by dilating the skull binary image with a spherical structuring element with a diameter of 6 mm. Next, to detect a set of initialization voxels that lie inside the cortical surface, we compute cm = argmaxc∈{C}(Σi∈cI(i)), where {C} is the set of all 26-connected components of the background of the skull binary image. Thus, cm is the background component of the binary image that, when used to mask I, results in the maximum sum of image intensities, and should correspond to the component that lies within the cortical surface. The contours of cm computed for a volume are shown in yellow in Fig. 7. Contours of all other components, {C} − cm, are shown in red in Fig. 7. The surface of cm is used to define the initial position of the evolving front. While the binary skull segmentation itself approximates the cortical surface well as seen in green in the figure, it alone is too noisy to identify and separate the cortical surface from other structures. Our technique is to apply an extreme dilation to that data. This removes noise and allows identification of a separable surface, the surface of cm, which is close to the cortical surface and can be used to initialize the level set segmentation.
Fig. 5.
Level set initialization process
Fig. 6.
Shown in blue is the intensity histogram of voxels that have an intensity value greater than −100. Shown in red is the intensity histogram of voxels that have both an intensity value greater −100 and sheetness score greater than 0.5.
Fig. 7.
Shown in green are the contours of the binary skull segmentation. Shown in yellow and red are the contours of cm and of {C}−cm.
Level Set Segmentation
The speed function is set to D = 1 − H, where H is the sheetness score image, which ranges in value from 0 to 1. Instead of defining the speed function using the intensity or intensity gradient type information, which would be very noisy in this application, we use this sheetness score based approach, which consistently assigns low speeds to voxels where there are bones. Thus, the speed function will expand the evolving surface until the zero level set reaches the cortex-bone interface where it will be slowed. Once the speed function is computed, the level set segmentation can be performed. An example segmentation result is shown in Fig. 8a, and the 3D surface representation of the segmentation result is shown in Fig. 8b.
Fig. 8.
Result of level set segmentation. Shown in (a) in white are the contours of the cortical surface level set segmentation result. In (b) is a 3D triangle mesh representation of the resulting cortical surface.
D. Cortical Surface Registration
Once the cortical surfaces of the target and reference intra-operative CT are extracted using the technique described in the previous section, the next step is registration of the target cortical surface to the reference cortical surface. We perform the registration using a feature-based matching called the spin image method [11].
Spin Image Generation
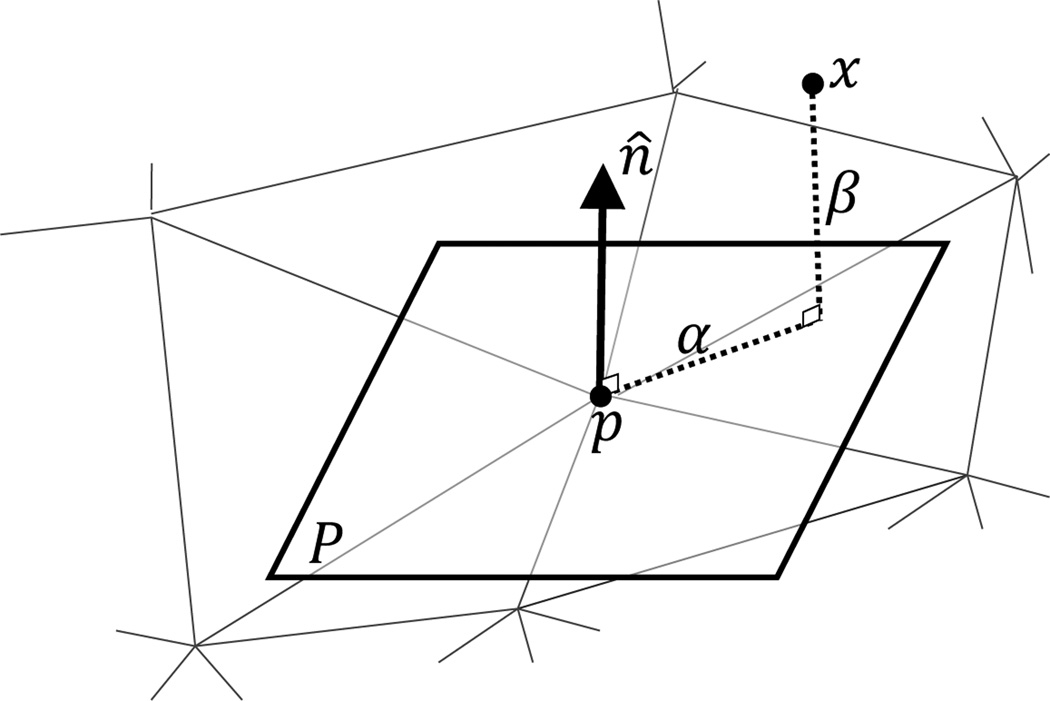
The first step in this feature-based registration approach is feature extraction. For each vertex on the surface, features are measured in the form of a so-called “spin image,” which captures the local shape of the 3D surface [11]. The spin image is a 2D histogram that describes the organization of neighboring vertices around a vertex in the surface. As shown in Fig. 9, given a vertex p on the surface with unit normal vector n̂ and a plane P passing through p and perpendicular to n̂, two distances are computed from each other vertex x to the given vertex p: (1) the signed distance in the n̂ direction, β(p, x) = n̂ • (x − p) and (2) the distance perpendicular to n̂, α(p, x) = ‖x − (p + β(p, x)n̂)‖. These distances are then used in constructing the spin images, one for each vertex. A spin image is a 2D histogram with α on the x-axis and β on the y-axis. Each entry on the histogram represents the number of vertices in a neighborhood of the vertex for which the spin image is computed that belong to the entry.
Fig. 9.
The distances α and β that are used for constructing the spin image at a vertex p.
Several parameter values are chosen for computing the spin image. These parameters are: (1) The size of the bins of the histogram. The bin size is determined as a multiple of the mesh resolution. The resolution of the surface mesh is the average length of the edges in the surface. The bin size affects how the vertex information is distributed in the spin image. (2) The height and width of the spin image. In our experiments, we have set the height and width of the spin image to be equal. The product of image width and bin size determines the support distance, which is the maximum distance a vertex can be from p and still contribute to p’s spin image. (3) The support angle is defined as the maximum allowable absolute angle difference between n̂ (the normal of p) and the normal of the contributing vertices. This is another mechanism for limiting contributing vertices to a local region. For this experiment the width and height of the spin image are set to 40, the bin size is set to half of the mesh resolution, and the support angle is set to 60°.
Establishing Spin Image Correspondence
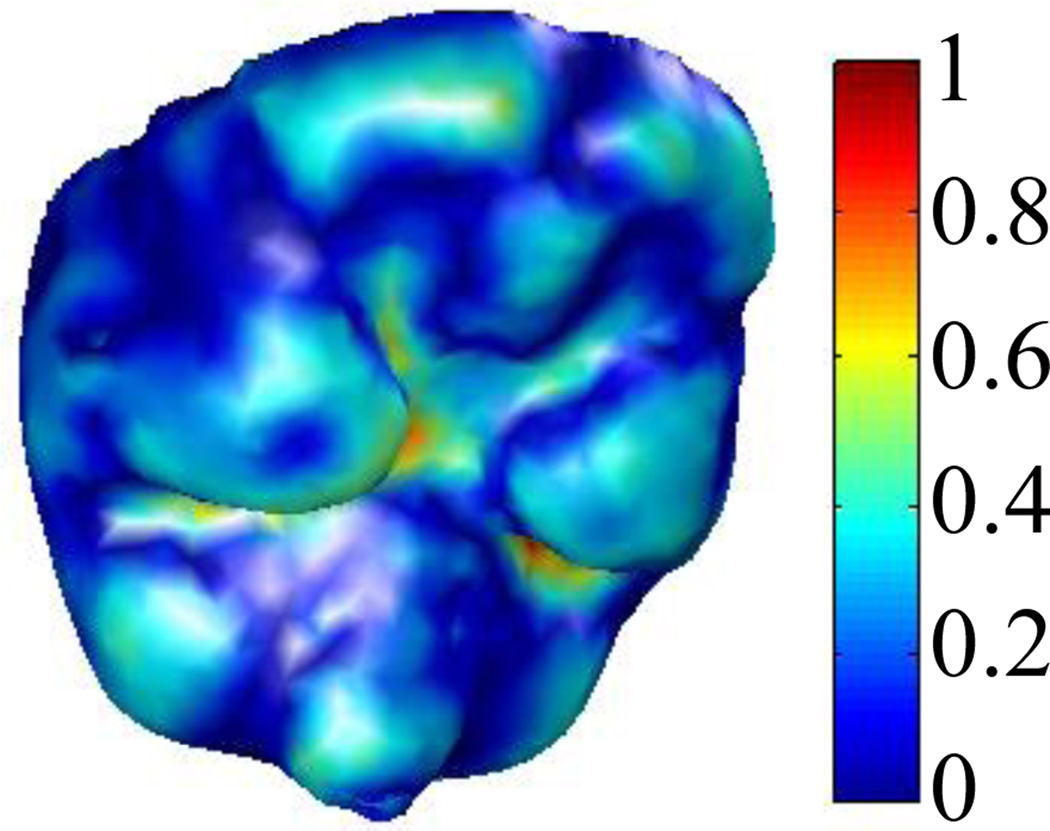
To perform spin image registration, a correspondence between the vertices of the reference and target surfaces must first be established by matching the spin images associated with those vertices. To choose which reference volume vertices are included in the registration, at each vertex in the extracted reference surface, we compute a curvature measure and normalize it to range from 0 to 1 (see Fig. 10) [15]. Only vertices on the reference surface with curvature value above 0.25 are used for the spin image registration. We do this because the regions of the cortical surface where the curvature is low are those that are flat, and their associated spin images are similar to those of their neighboring vertices. Thus, in the registration process we only include vertices in high curvature regions that are more likely to result in distinctive spin images. Spin image computation for these vertices is performed once and offline. Similarly, we only use 30% of the vertices from the target surface, which are chosen as the vertices with the highest curvature scores. Limiting the number of vertices included in the registration, and thus also limiting the number of spin images that need to be matched, improves the computation time of the subsequent search for correspondence.
Fig. 10.
Reference intra-operative cortical surface. The color at each vertex encodes the curvature value.
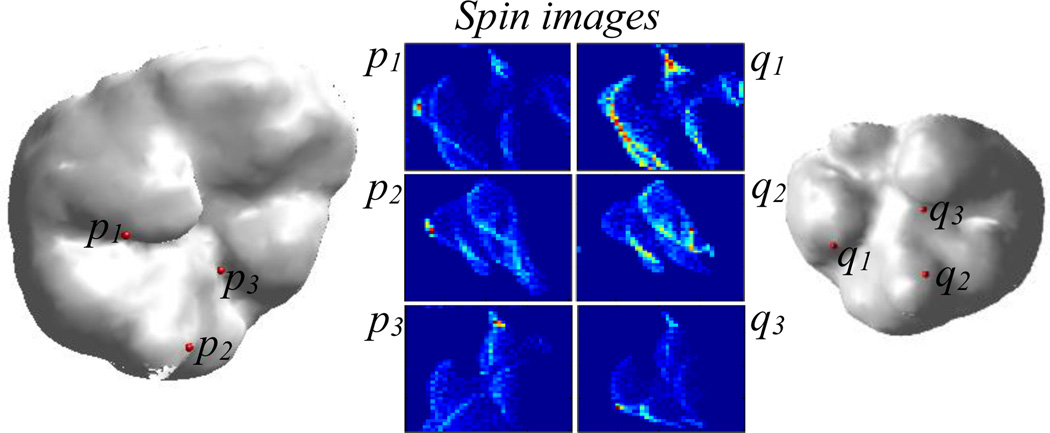
Point correspondence is established by matching the spin image of each reference vertex to the spin image of the vertex in the target surface that maximizes a linear correlation-based similarity criterion Correspondences are constrained such that if C1 = (r1, t1) and C2 = (r2, t2) are two sets of corresponding points between the reference and target surfaces, ‖(α(r1, r2), β(r1, r2)) − (α(t1, t2), β(t1, t2))‖ < ε, i.e., the spin image coordinates from r1 to r2 on the reference surface are approximately equal to spin image coordinates from t1 to t2 on the target surface. This type of constraint is enforced between all sets of corresponding points to filter out point correspondences that do not obey rigid distance constraints. For more detailed description of the spin image matching process, please see [11]. Once correspondence is established, a rigid-body transformation that best aligns the corresponding points is computed using the method of least squares fitting [16]. Fig. 11 shows an example of three pairs of corresponding points and their associated spin images.
Fig. 11.
Cortical surface of reference and target intra-operative CT images. Three correspondences and their associated spin images are shown.
E. Validation
Each testing pre- and intra-operative image pair was registered using both the expert initialization-based and the automatic registration method we propose. We quantitatively validate our automatic approach by measuring the distance between the “entry” (a point along the typical surgical trajectory for PCI near critical ear anatomy) and “target” (cochlear implant insertion point) points computed using the automatic and manually initialized registration processes. Expert initialization has led to satisfactory results in the clinical trials we have been performing [3]. Thus, small errors between entry and target points will indicate that the automatic approach is equally effective.
III. Results
Table II shows the error distances between the target and entry points generated using the fully-automated vs. the manual initialization-based registration approach. The maximum distance between points using the two approaches is 0.1797 mm, and the average distances between entry and target points are 0.116 and 0.118 mm, respectively. These results suggest that the automatic registration we propose is accurate enough to perform a PCI surgery.
TABLE II.
Distance in millimeter from the “entry” and “target” points of the drilling trajectory that is mapped with expert initialized registration to the proposed automatic registration.
| Entry Point |
Target Point |
|
|---|---|---|
| 1 | 0.030 | 0.029 |
| 2 | 0.169 | 0.180 |
| 3 | 0.102 | 0.094 |
| 4 | 0.157 | 0.161 |
| 5 | 0.124 | 0.123 |
| 6 | 0.127 | 0.129 |
| 7 | 0.091 | 0.093 |
| 8 | 0.108 | 0.123 |
| 9 | 0.153 | 0.148 |
| 10 | 0.096 | 0.095 |
| 11 | 0.117 | 0.117 |
| Average | 0.1159 | 0.1175 |
IV. Conclusions
PCI surgery requires the registration of the pre- and intra-operative images to map the pre-operatively computed drilling trajectory into the intra-operative space. The field of view and the orientation of the patient’s head in the intra-operative CTs are inconsistent. These differences between the pre- and intra-operative CTs are too extreme to be recovered by standard, gradient descent-based registration methods. In this work, we presented a completely automatic method of pre- to intra-operative CT registration for PCI. This approach relies on a feature-based registration method that, to the best of our knowledge, has not been used by the medical imaging community. We found this technique to be efficient and accurate.
To quantitatively measure performance, we compared the target and entry points of an automatically registered trajectory to a trajectory mapped using the manually-initialized approach, which has been used in ongoing clinical validation studies [3], and we have found a maximum error distance of 0.16 mm. However, since both approaches use the same intensity-based registration approach as the final optimization step and converge to similar results, it is likely that both approaches produce equally accurate results. We are currently evaluating the automatic procedure prospectively to confirm this.
We recently presented another method for automating the manual initialization process that also relies on surface registration [10]. In that method, surface registration is performed by matching features on the skull surface. The drawbacks of that method are that the skull surface extraction requires manual intervention and the time required to perform surface extraction is ~20 min. The advantage of the proposed approach is that it eliminates all manual intervention, and it only requires 0.75 min, which is fast enough to be integrated into the PCI workflow since the manual initialization-based approach we currently use typically requires more than 2 min.
One limitation of the proposed registration approach is that it is not invariant to scale. Future work will focus on addressing this problem.
Acknowledgments
This work was supported by NIH grants R01DC008408 and R01DC010184 from the National Institute of Deafness and Other Communication Disorders. The content is solely the responsibility of the authors and does not necessarily represent the official views of these institutes.
Footnotes
An earlier version of this paper will be presented in the International Workshop in Bio-medical Image Registration on July 2012.
Contributor Information
Fitsum A. Reda, Department of Electrical Engineering and Computer Science, Vanderbilt University, Nashville, TN 37235 USA.
Jack H. Noble, Email: jack.h.noble@vanderbilt.edu, Department of Electrical Engineering and Computer Science, Vanderbilt University, Nashville, TN 37235 USA.
Robert F. Labadie, Email: robert.labadie@vanderbilt.edu, Department of Otolaryngology-Head and Neck Surgery, Vanderbilt University Medical Center, Nashville, TN 37232 USA.
Benoit M. Dawant, Email: benoit.dawant@vanderbilt.edu, Department of Electrical Engineering and Computer Science, Vanderbilt University, Nashville, TN 37235 USA.
References
- 1.Labadie Robert F, Chodhury Pallavi, Cetinkaya Ebru, Balachandran Ramya, Haynes David S, Fenlon Micahel R, Jusczyzck Andrzej S, Fitzpatrick J Michael. Minimally invasive, image-guided, facial-recess approach to the middle ear: Demonstration of the concept of percutaneous cochlear access in vitro. Otology and Neurotology. 2005;26(4):557–562. doi: 10.1097/01.mao.0000178117.61537.5b. [DOI] [PubMed] [Google Scholar]
- 2.Noble JH, Majdani O, Labadie RF, Dawant BM, Fitzpatrick JM. Automatic determination of optimal linear drilling trajectories for cochlear access accounting for drill-positioning error. Int. J. Med. Robotics Comput. Assist. Surg. 2010;6(3):281–290. doi: 10.1002/rcs.330. [DOI] [PMC free article] [PubMed] [Google Scholar]
- 3.Labadie RF, Mitchell J, Balachandran R, Fitzpatrick JM. Customized, rapid-production microstereotactic table for surgical targeting: description of concept and in vitro validation. International Journal of Computer Assisted Radiology and Surgery. 2009;4(3):273–280. doi: 10.1007/s11548-009-0292-3. [DOI] [PMC free article] [PubMed] [Google Scholar]
- 4.Noble JH, Warren FM, Labadie RF, Dawant BM. Automatic segmentation of the facial nerve and chorda tympani in CT images using the spatially dependent feature values. Med Phys. 2008;35:5375–5384. doi: 10.1118/1.3005479. [DOI] [PMC free article] [PubMed] [Google Scholar]
- 5.Reda FA, Noble JH, Rivas A, McRackan TR, Labadie RF, Dawant BM. Automatic segmentation of the facial nerve and chorda tympani in pediatric CT scans. Med Phys. 2011;38:5590–5600. doi: 10.1118/1.3634048. [DOI] [PMC free article] [PubMed] [Google Scholar]
- 6.Noble JH, Dawant BM, Warren FM, Labadie RF. Automatic identification and 3D rendering of temporal bone anatomy. Otology and Neurotology. 2009;30(4):436–442. doi: 10.1097/MAO.0b013e31819e61ed. [DOI] [PMC free article] [PubMed] [Google Scholar]
- 7.Noble JH, Labadie RF, Majdani O, Dawant BM. Automatic segmentation of Intracochlear anatomy in conventional CT. IEEE Transactions on Biomedical Engineering. 2011;58(9):2625–32. doi: 10.1109/TBME.2011.2160262. [DOI] [PMC free article] [PubMed] [Google Scholar]
- 8.Wells WM, III, Viola P, Atsumi H, Nakajima S, Kikinis R. Multi-modal volume registration by maximization of mutual information. Medical Image Analysis. 1996;1(1):35–51. doi: 10.1016/s1361-8415(01)80004-9. [DOI] [PubMed] [Google Scholar]
- 9.Wang MY, Maurer CR, Jr, Fitzpatrick JM, Maciunas RJ. An automatic technique for finding and localizing externally attached markers in CT and MR volume images of the head. Biomedical Engineering, IEEE Transactions on. 1996;43(6):627–637. doi: 10.1109/10.495282. [DOI] [PubMed] [Google Scholar]
- 10.Reda FA, Dawant BM, Labadie RF, Noble JH. Automatic pre- to intra-operative CT registration for image guided cochlear implant surgery. Proc SPIE. 83161E. 2012 doi: 10.1109/TBME.2012.2214775. [DOI] [PMC free article] [PubMed] [Google Scholar]
- 11.Johnson AE, Hebert M. Surface matching for object recognition in complex three-dimensional scenes. Image and Vision Computing. 1998;16(9–10):635–651. [Google Scholar]
- 12.Sethian J. Level Set Methods and Fast Marching Methods. 2nd ed. Cambridge: Cambridge University Press; 1999. [Google Scholar]
- 13.Descoteaux M, et al. Bone enhancement filtering: Application to sinus bone segmentation and simulation of pituitary surgery. Lecture Notes in Computer Science. 2005;3749:9. doi: 10.1007/11566465_2. [DOI] [PubMed] [Google Scholar]
- 14.Reddi SS, et al. An optimal multiple threshold scheme for image segmentation. IEEE Transactions on Systems, Man. And Cybernetics. 1984;14:665. [Google Scholar]
- 15.Alliez P, Cohen-Steiner D, Devillers O, Ležvy B, Desbrun M. Anisotropic Polygonal Remeshing. ACM Transactions on Graphics. 2003 [Google Scholar]
- 16.Arun KS, Huang TS, Blostein SD. Least-Squares Fitting of Two 3-D Point Sets. Pattern Analysis and Machine Intelligence, IEEE Transactions on, PAMI-9(5) 1987:698–700. doi: 10.1109/tpami.1987.4767965. [DOI] [PubMed] [Google Scholar]


