 Monitoring encapsulation kinetics: a microfluidic tool is introduced that enables for the precise determination of microencapsulation dynamics by measuring droplet deformations.
Abstract
We use microfluidic polydimethylsiloxane (PDMS) devices to measure the kinetics of reactive encapsulations occurring at the interface of emulsion droplets. The formation of the polymeric shell is inferred from the droplet deformability measured in a series of expansion–constriction chambers along the microfluidic chip. With this tool we quantify the kinetic processes governing the encapsulation at the very early stage of shell formation with a time resolution of the order of the millisecond for overall reactions occurring in less than 0.5 s. We perform a comparison of monomer reactivities used for the encapsulation. We study the formation of polyurea microcapsules (PUMCs); the shell formation proceeds at the water–oil interface by an immediate reaction of amines dissolved in the aqueous phase and isocyanates dissolved in the oil phase. We observe that both monomers contribute differently to the encapsulation kinetics. The kinetics of the shell formation process at the oil-in-water (O/W) experiments significantly differs from the water-in-oil (W/O) systems; the component dissolved in the continuous phase has the largest impact on the kinetics. In addition, we quantified the retarding effect on the encapsulation kinetics by the interface stabilizing agent (surfactant). Our approach is valuable for quantifying in situ reactive encapsulation processes and provides guidelines to generate microcapsules with soft interfaces of tailored and controllable interfacial properties.
Introduction
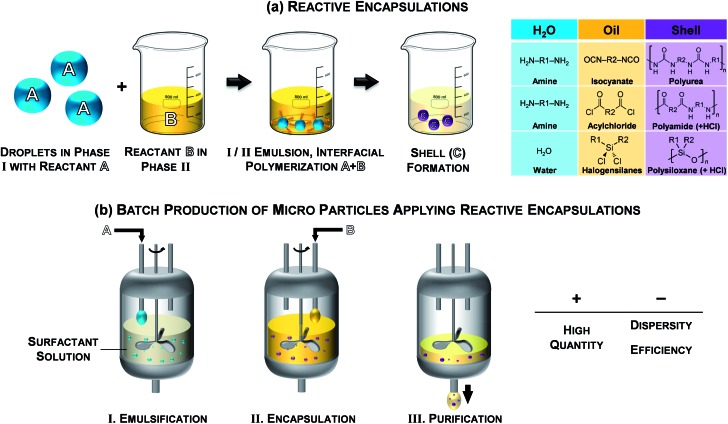
The use of microcapsules for the controlled release and storage of active ingredients is of particular importance for various applications in medicine, especially in drug science, as well as for agriculture, food and cosmetic industry and for paper and textile manufacturing.1–14 Reactive encapsulations that proceed via interfacial polymerization12,13,15–25 at oil/water-interfaces are known since the 1960s and are widely used because of their versatility and robustness. Immediately after contact of the two phases that contain the reactive monomers, respectively, a solid – and most-likely cross-linked network precipitates at the interface as schematically shown in Fig. 1a. Thus, the controlled encapsulation in micro-environments of both hydrophilic and hydrophobic agents is achieved under mild conditions of temperature and pressure.15,16 Polyurea, polyamide and polysiloxane are polymers commonly used in interfacial polymerizations due to their physicochemical properties.1,7 Nowadays, reactive encapsulations are performed in batch processes to produce microcapsules ranging from 10–500 μm in high quantity as illustrated in Fig. 1b. However, besides the advantage of batch processes for high throughput production, these techniques do not provide a precise control over the resulting capsule size, dispersity and morphological properties; the encapsulation efficiency is strongly limited by the process conditions. The reaction conditions and the high speed of interfacial polymerizations are, still to date, preventing a detailed quantitative analysis of the shell formation kinetics. Accessing such information would however be important to optimize processes and fully control the encapsulation.17–25
Fig. 1. (a) Schematic of reactive encapsulations and selected examples and (b) illustration of a batch processes for reactive encapsulations.
In this article, we report on a microfluidic tool for the direct visualization of the encapsulation kinetics of interfacial polymerizations. We use as a marker of the polymerization progress the change in the droplet deformability while a polymeric shell is forming at the interface. We insert sudden planar expansions in the channel geometry that cause identical hydrodynamic shear stresses acting at the emulsion droplet interface causing a transversal droplet deformation. A consecutive arrangement of these expansion chambers allows for a systematic monitoring of the droplet deformability and, hence, of the encapsulation reaction process. The method of the deformation chambers is inspired by concepts of previous works on droplet deformations in external hydrodynamic flow fields26,27 and was previously used to measure the dynamics of surfactant adsorption at liquid–liquid interfaces.28 We show that our measurement results contain both information on specific material properties of the shell and – due to the time resolution of the experiment – their variations over time.
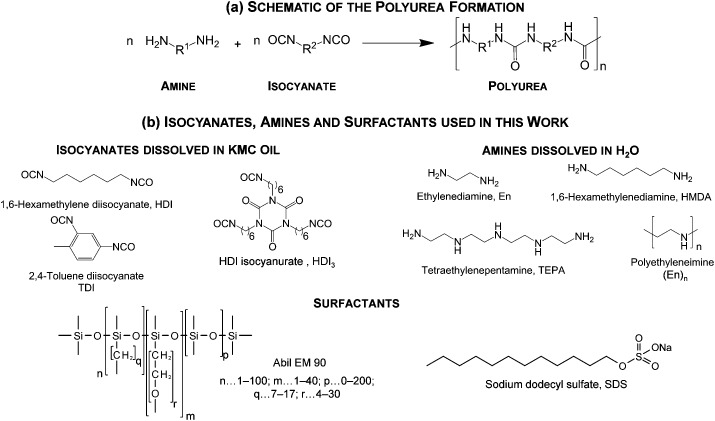
We study the polyurea microencapsulation. The generation of polyurea follows a polyaddition mechanism of amines and isocyanates. No side products are formed which simplifies the characterization of this encapsulation. A schematic of the polyurea formation as well as isocyanates and amines used in our investigations is given in Fig. 2.
Fig. 2. (a) Schematic of the polyurea formation process as well as of the (b) isocyanates, amines and surfactants used in this study.
The amine is dissolved in the aqueous phase and the isocyanate is in the oil phase. The interfacial polymerization process is initiated when both phases are brought into contact. Our method enables us to investigate both water-in-oil (W/O) and oil-in-water (O/W) encapsulations. We gain deeper insights into the shell formation mechanisms at the early stage of the polyurea microcapsules (PUMCs). An encapsulation rate v E is introduced in this work based on the standard principles of polymerization kinetics.29 Here, it is derived from a measurement of the time-dependent deformability of droplets over while the polymeric shell is being formed. With this kinetic approach we are able to express reactivity trends of certain amines and isocyanates with different chemical structures.30–32 In addition, we quantify the retardation of the encapsulation by surface stabilizing agents (surfactant). We obtain kinetic data of reactive microencapsulation for a wide range of experimental conditions.
Methods and materials
Microfluidic polydimethylsiloxane (PDMS) devices are fabricated by standard soft lithography methods.33 The wetting properties of the channels are controlled by surface treatment. For the water-in-oil (W/O) experiments the channel walls are hydrophobized with Aquapell®. Hydrophilic channel walls for the oil-in-water (O/W) encapsulations are generated by the following procedure: after the bonding process of the PDMS, a 1 : 1 solution composed of concentrated HCl (37%) and hydrogen peroxide (H2O2, 30%) is flushed through the device for 5 minutes using a vacuum apparatus. Then, the microfluidic chip is flushed with Millipore water, gently blown dry and filled with the hydrophilizing agent 2-[methoxy(polyethyleneoxy)propyl] trimethoxysilane (ABCR) for another 5 h. The device is directly used after flushing with Millipore water and drying.
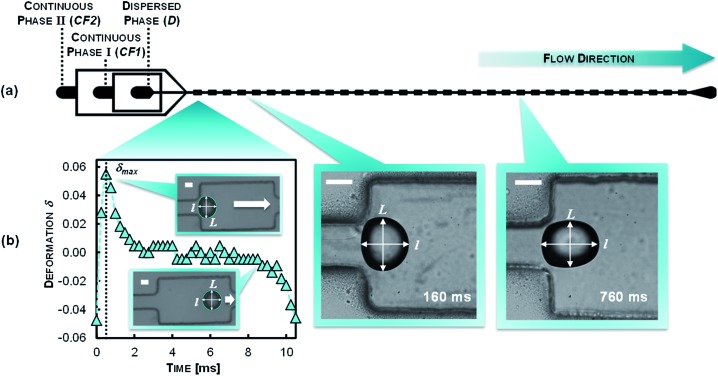
The polyurea microencapsulation is performed in situ. As soon as both phases get in contact, the polymerisation starts. To avoid clogging of the device by polymerisation at the stagnation points of the flow, we first produce droplets in an reactant-free continuous phase. We add the reactant using an additional set of channels, downstream of the droplet production nozzle (Fig. 3). We use KMC oil 113 (Fisher Scientific, ρ = 0.89 g cm–3, η = 9.8 cP; γ oil–water = 37 mN m–1), which is a mixture of 1,7- and 2,6-diisopropyl naphthalene, as oil for its solubility properties for isocyanates and its non-swelling properties of the PDMS channels. Amines are dissolved in the aqueous phase and isocyanates are in the oil phase. The emulsification and encapsulation are decoupled at the microfluidic chip to prevent an immediate clogging of the device at the nozzle region by the rapid polymer formation. First, emulsion droplets of the dispersed phase (D) containing the first monomer (0.001–30 wt%) in the appropriate continuous phase (CF1) are generated at a flow-focusing T-junction with dimensions of 100 μm in height and width. CF1 is either a pure fluid or contains surfactant (0.25–5 wt%). Emulsion droplets are then flown into a V-shaped flow-focusing junction using continuous phase CF2 that consists of the second monomer for the shell production (0.5–20 wt%) in the same fluid as CF1. In total, the device is run with three fluid streams and the flow rates of D, CF1 and CF2 are held constant at 100, 2450 and 1050 μL·h–1.
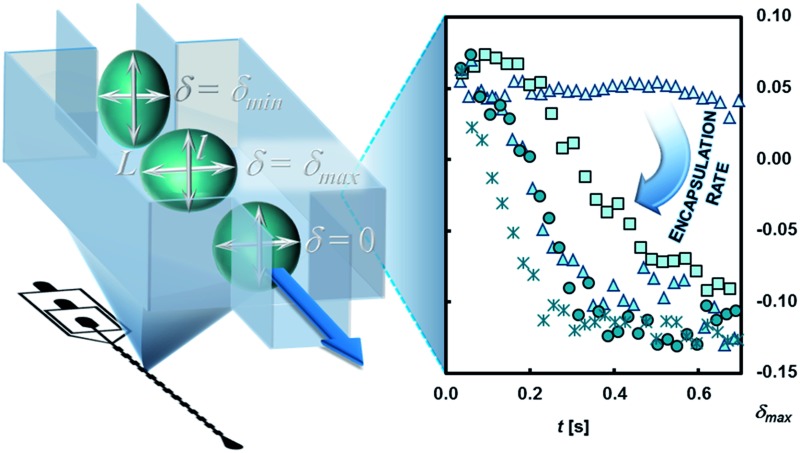
Fig. 3. (a) Microfluidic chip design for reactive W/O and O/W encapsulation and the reactive encapsulation monitoring. (b) General readout: droplet deformation as a function of time in a single chamber and micrograph images of droplet deformations bearing a thin polymer film at the water–oil interface at different stages at 160 and 760 ms. D contains the first monomer being dispersed in CF1. Thereafter, CF2 is introduced to the flow that contains the second monomer. The mixing of CF1 and CF2 occurs by diffusion (scale bars: 50 μm).
The controlled deformation of the emulsion droplets is achieved in the 34 successive expansion chambers (500 × 300 μm, see Fig. 3) that are separated by microfluidic channels of dimensions 500 × 100 μm. The droplet deformations are recorded using high speed imaging (Phantom) and the droplet contour is detected by image processing.
Amines 1,6-hexamethylenediamine (HMDA), ethylenediamine (En), tetraethylenepentamine (TEPA), polyethyleneimine ((En)n, M N = 600 g mol–1), as well as surfactant sodium dodecyl sulphate (SDS) and isocyanates 2,4-toluene diisocyanate (TDI) and 1,6-hexamethylene diisocyanate (HDI) are purchased from Sigma Aldrich and used as received. Surfactant Abil Em 90 is purchased from Evonik Industries and the HDI isocyanurate HDI3 from BASF SE and used as received.
Results and discussion
Water in oil microcapsule formation (W/O-PUMC)
We study the interfacial polymerization of amines, dissolved in an aqueous phase, and isocyanates, dissolved in an immiscible oil phase. In brief, we first produce droplets at a flow-focusing junction in a continuous phase free of reagents. We introduce the reagent downstream of the nozzle via side channels. Immediately at this point, the interfacial reaction starts. The emulsification and the polymerization are here locally separated to prevent clogging of the nozzle region. A sketch of the microfluidic chip design for the polyurea encapsulation and tracking the deformability change is depicted in Fig. 3a. The droplets then flow into the analysis part. In the expansion chambers the droplet deformation is recorded by high-speed imaging. By subsequent image processing, the droplet contour is detected. The two-dimensional droplet deformation δ, is defined by the longitudinal l and transversal L expansion of the droplet by the following equation:26d
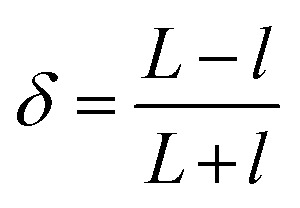 |
1 |
The time evolution of δ within a given chamber is shown in Fig. 3b; the time-dependence of the deformation in the chamber results from the hydrodynamic shear stress acting on the droplet and are a coupling of the following events: when the droplets enter the planar expansion of the chamber, they deform transversally to the flow direction and reach a maximum (δ max) before relaxing to a spherical shape (L = l; δ = 0). While entering the constriction the droplet deforms longitudinally (δ decreases) until it reaches a minimum value which is defined by the lateral confinement in the constriction. In the further context we use the maximum deformation δ max as an indicator for the polymer shell response to the tensile stress acting on the droplet.
The deformation profile of the reactive emulsion droplets is recorded in 34 consecutively arranged expansion chambers. With the channel height and flow rates of D, CF1 and CF2 used here, we monitor reactive encapsulation in a time range between 5 and 620 ms (Fig. 3b). As the flow conditions are identical in all the expansions, monitoring the deformation along the chip provides a measurement of evolution of the shell growth in time. Our microfluidic system has several advantages: it provides (i) a continuous mode of operation through the continuous production and flow of droplets; (ii) a versatile method to tune the experimental parameters such as flow rates or volume fractions and (iii) a reproducible production of polyurea microcapsules usable to obtain statistically relevant information on large amount of capsules.
At the initial state of the experiment (t = 0) no polymer film covers the emulsion droplet. Among other factors, the deformation is mainly defined by the interfacial tension and the droplet size as described by the capillary number Ca as it has been found in previous studies.28 At increasing chamber count (reaction time) we detect that the prolate deformation of the droplet, induced by the channel geometry, is not fully relaxing within the expansion (see Fig. 3b) as a result of the growth of the polymer film at the interface region. As a consequence of the rigidification of the oil–water interface by the polymer film, the deformation of the particle is dominated by the viscoelastic properties of the polymer shell leading to the decrease in δ max in the experiment.
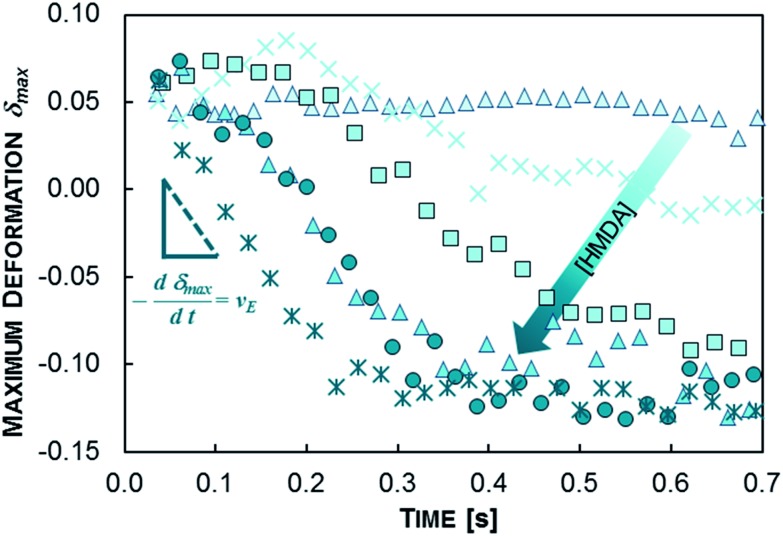
We start our investigations with the water-in-oil (W/O) experiments. As an example, the variation of δ max over time for a set of W/O polyurea microencapsulations using the combination TDI/HMDA at varying HMDA concentration without surfactant are illustrated in Fig. 4. At the initial stage (chamber counts 1–4) for most of the experiments we detect no mentionable change in δ max; obviously, at this stage the whole encapsulation kinetics are limited by the diffusion of the TDI to the water–oil interface. Subsequently after this stage, a notable decrease in δ max is recorded – shell formation proceeds at the W/O-interface. The δ max decrease is fitted to an exponential relaxation. δ max reaches a plateau at –0.135 which is visible for the HMDA concentrations 0.5, 0.25 and 0.1 wt% (Fig. 4). We observed that in particular the absolute value of this plateau is a function of the initial droplet size and the channel width at the constriction.
Fig. 4. Maximum deformation δ
max as a function of the polymerization time at the W/O polyurea microencapsulation using TDI/HMDA without any surfactant. HMDA concentrations are:  0.001 wt%,
  0.01 wt%,
  0.05 wt%,
  0.1 wt%,
  0.25 wt%,
  0.5 wt%.
The decrease of δ max is faster with increasing HMDA concentration (see Fig. 4): the time-scale of the exponential relaxations systematically decreases indicating faster reactions. These findings encouraged us to apply basic principles of step growth polymerization kinetics29 for the definition of the encapsulation dynamics. The polyaddition rate v P of an isocyanate IC and amine AM at the interface reads
 |
2 |
where [IC] and [AM] are concentrations, a and b are the corresponding reaction orders, and k P is the concentration-independent polymerization rate constant. The droplet deformation in our experiment is a result of the hydrodynamic shear at the expansion chambers. We have seen that this deformation is directly connected to both the Young's modulus E and the shell thickness h which is a measure for the polymer amount and therefore the monomer conversion (eqn (2)). We therefore introduce an apparent rate law based on the decrease of the maximum deformation δ max as:
 |
3 |
The introduction of this apparent rate law is motivated by the link that can be made between the maximum deformation and the material mechanical properties. The deformation is directly connected to both the Young's modulus E and the shell thickness h which measures the polymer formed (eqn (4)). As a note, it was shown previously that the stress T 1 required for an elastic transversal deformation of a membrane of thickness h ≪ R along an emulsion droplet equals
 |
4 |
where E is the Young's modulus and λ 1 and λ 2 the principal stretch ratios in meridional and circumferential directions.34,35 This relation is valid in the case of thin polymer films around the droplet (h ≪ r) which matches with our experimental conditions. Therefore, δ max is directly linked to the material elastic property E and the polymer amount (in h) that is a measure for the conversion of the reaction and allows for a detailed study on the polymerization kinetics at the encapsulation process. The analysis of the polymer film that is formed at the interfacial polymerization will be shown in a separate paper. It should however be noted that the exponents do not directly correspond to the order of the reaction. The relationship between the maximum deformation and the thickness of the layer, will determine the relationship of the order of the reaction to our measured exponent. But as this relationship does not include the reagents themselves, the ratio between the exponents in our apparent kinetics law and the real kinetic law will be preserved. As a straightforward example if a linear relationship exists between the maximum deformation and the shell thickness, then the apparent orders will be exactly equal to the reaction orders.
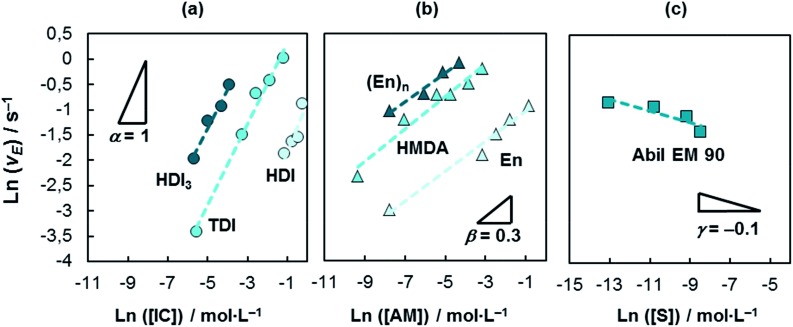
We therefore restrict our analysis to the apparent rate law derived from the variation of the maximum deformation. The rate of the reaction is found to depend on the reagents concentration and surfactant additives. For a complete description of the encapsulation kinetics, the reaction orders α, β and γ have to be determined which are the slopes of the reaction rate in a double logarithmic representation of the experimental data. We then obtain the complete description of the encapsulation kinetics through the reaction orders α, β and γ that are now all experimentally accessible.
In our approach, the apparent rate v E is the change of the maximum deformation of the droplet over time and is measured as the slope of δ max over time (Fig. 4). We measure v E at the initial stage of the encapsulation according to the determination of polymerization kinetics;29 gelling effects and transition reactions can be neglected at this region. The initial stage of encapsulation is the region where a first notable decrease in δ max is recorded. The concentration-independent rate constant k E in eqn (4) can furthermore be considered for the quantification of various polyaddition systems. Experimental results of the order determinations for the W/O polyurea microencapsulations are presented in Fig. 5. Thus, the shape of the encapsulation rate law for W/O-PUMCs finally reads
 |
5 |
Fig. 5. Double-logarithmic plots of W/O-encapsulation rates as function of the (a) isocyanate, (b) amine and (c) surfactant concentration. The reaction orders referring to the reactants and S are α = 1, β = 0.3 and γ = –0.1. Experimental conditions are as follows: (a) HDI3:[HMDA] = 10 wt%, TDI:[HMDA] = 2.5 wt%, HDI:[HMDA] = 10 wt%; (b) [TDI] = 2.5 wt%; (c) [HMDA] = 2.5 wt%, [TDI] = 2.5 wt%.
Due to the fact that the surfactant is not directly involved in the reaction of polymerization, we replace k E by k*E. The shape of eqn (5) reveals interesting insights into the encapsulation mechanism.
The isocyanate of the continuous phase, has the dominating impact on v E; an increase of the IC concentration by a factor of eight increases v E by eight whereas the same increase of the AM amount solely leads to an encapsulation rate growth by a factor of two. The amine has a weaker effect on the kinetics. Interestingly, independent from the functionality of the reactant we obtain the same encapsulation orders, which means that the principal early shell formation mechanism is not a function of the latent property of the monomer to undergo cross-linking reactions.
In addition, eqn (5) enables a precise quantification of the influence of the surfactant on the encapsulation kinetics which, up to nowadays, cannot be found in literature. A significant retardation of the encapsulation dynamics is measured in our experiments when working with Abil EM 90; the encapsulation rate constant of the surfactant-containing system is reduced by a factor of five compared to the non-surfactant containing encapsulations. We tested the surfactant adsorption dynamics of Abil EM 90. With the experiment conditions used an equilibrium interfacial tension has been reached; the retardation of the encapsulation is caused by the blocking of reactive sites (at the interface and by entrapping of reactants in surfactant micelles) by the surfactant which reduces the probability of AM–IC impacts. The surfactant is assembled at the water–oil interface and, further on, interacts with the polyurea causing changes in the shell morphology which was also discussed recently.36
Oil in water microcapsule formation (O/W-PUMC)
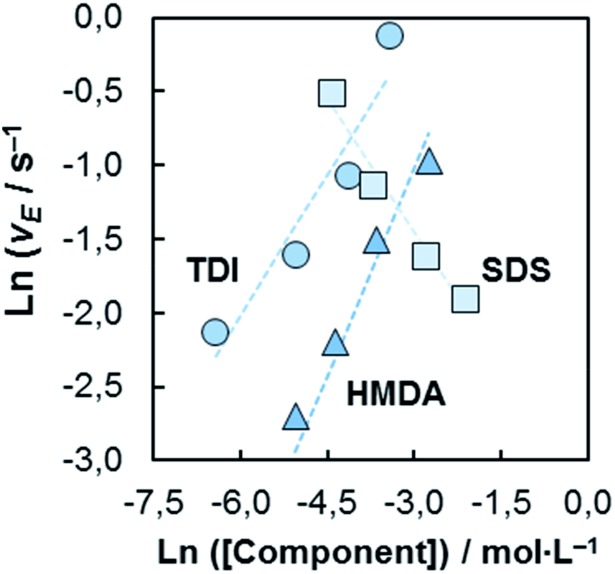
In order to address the influence of the isocyanate, amine and surfactant on the encapsulation kinetics at the oil-in-water (O/W)-PUMC formation, we determined the O/W-encapsulation rate varying the concentration of the reagents (Fig. 6).
Fig. 6. Double-logarithmic plots of O/W-encapsulation rates as function of the TDI, HDMA and SDS concentrations. The reaction orders referring to the reactants and surfactant are α = 0.64 (TDI), β = 0.95 (HMDA) and γ = –0.59. The experimental conditions are for TDI:[HMDA] = 2.5 wt%; [SDS] = 0.5 wt%; for HMDA:[TDI] = 2.5 wt%; [SDS] = 0.5 wt%; for SDS:[TDI] = 2.5 wt%; [HMDA] = 2.5 wt%.
We find a similar apparent rate relationship with different exponents
 |
6 |
We also find, similarly to the W/O-encapsulation, that the reactant of the continuous fluid (amine) dominates the encapsulation dynamics. The retardation effect of the surface stabilizing agent at the O/W-encapsulations is remarkable. O/W-encapsulations performed without SDS are faster by a factor of 10 compared to the SDS containing systems. A stronger inhibition of the encapsulation by the SDS is indicated. Obviously, SDS blocks the reactive sites and components for the shell formation more efficiently than Abil EM 90.
Monomer reactivities
Varying the concentrations of the reagents, we determine the partial orders of the reaction (Fig. 5) and the apparent k E-values for the W/O- and O/W-encapsulations. In Table 1 the relative encapsulation rate constants of W/O and O/W polyurea microencapsulations (k E·k E,min –1) as well as the relative reaction rates of amine–n-butyl alcohol conversions, that can be taken as a measure of the monomer reactivities, are listed.
Table 1. Relative polyurea microencapsulation rates k E(W/O)rel and k E(O/W)rel of different monomer combination and reaction rate constants of conversions of n-butyl alcohol a with isocyanates and primary isocyanates with primary and secondary amines taken from ref. 30–32 .
| Amine | Isocyanate | k E(W/O)rel | k E(O/W)rel |
| En | TDI | 1 | 1 |
| HMDA | 4.98 | 36.47 | |
| TEPA | 5.99 | 50.94 | |
| (En)n | 10.21 | 244.21 | |
| Secondary AM | Primary isocyanate | 1 (ref. 30–32) | |
| Primary AM | 2–5 (ref. 30–32) | ||
| HMDA | HDI | 1 | 1 |
| HDI3 | 6.52 | 0.72 | |
| TDI | 9.07 | 40.83 | |
| HDI | n-Butyl alcohol | 1 a 30–32 | |
| TDI | 66.4 a 30–32 | ||
aThere is no reliable information on absolute reaction rate constants of HDI and TDI with amines. However, trends in conversions of isocyanates with alcohols can be directly compared even though that they react slower than the conversion with amines by a factor of 100–1000. The values correspond to the reaction with the second isocyanate function of the molecule.
A higher reactivity of aromatic isocyanates (TDI) compared to aliphatic (HDI, HDI3) isocyanates is detected as it is known for these compounds;30–32 the trend is more significant for the O/W encapsulations. However, the tendency is significantly lower compared to the literature known reaction rates which possibly indicates the limitation of the encapsulation by the diffusion of the monomer.
A contrary result is found for the amines. Primary amines react faster with isocyanates than secondary amines by a factor of 2–5.30–32 However, the encapsulation rate constants k E of TEPA and (En)n are larger than those of En and HMDA by a factor of 6–244. The trend is more significant for the O/W-microencapsulations. The results can be explained by an increased amount of reactive sites at polyurea that is formed from TDI/TEPA and TDI/(En)n. First, the probability of monomer addition to this polymer is increased and, secondly, cross-linking reactions occur that result in polymer networks with high elastic moduli E. The polyurea chains, generated from the combinations TDI/En and TDI/HMDA, where the amines only bear two NH2 functions, are linear leading to materials with small elastic modulus E. According to eqn (2), the deformation of a capsule is directly linked to the Young's modulus E of the polymeric membrane. Consequently, multiply cross-linked polymer networks with high elastic moduli E require a higher tensile stress for deformation than polymers without knots that have comparatively lower E. The encapsulation rate constant k E therefore reflects the development of the mechanical properties of the polyurea that is formed at the water–oil interface. This observation is furthermore confirmed by the experiments with an isocyanate that has more than two NCO groups. HDI3 that generally has the same chemical reactivity as HDI has a significant higher k E(W/O)rel (see Table 1). At the HDI3/HMDA encapsulations multiply cross-linked polyurea with high E-values is formed, obviously compared to the not cross-linking HDI/HMDA system.
Our microfluidic tool provides a direct monitoring of reactive encapsulations. It is usable to study encapsulation dynamics but also to study the time-evolution of mechanical properties of thin polymer films at soft reactive interfaces. A further step – which is beyond the scope of the present study – would be to quantitatively relate the mechanics of deformation of the capsule to its material properties and obtain rate constants in terms of material production rather than deformation variations.
Conclusions
In this work we introduced a microfluidic technique for the direct monitoring of reactive microencapsulation dynamics. We infer the interfacial reactivity by measuring the changes in the deformability of the droplets in flow. The deformation of the emulsion droplets are induced by hydrodynamic forcing in microfluidic chambers. The response of the droplet is characterised by the deformation parameter δ and we used the maximum deformation δ max as an indicator for the response of the shell to the forcing. We studied the polyurea microencapsulation; shell formation results from the reaction of isocyanates, dissolved in the oil, with amines, dissolved in the aqueous phase. With our approach we have access to the early kinetics (below 0.5 s and resolved in ms) of reactive W/O and O/W interfacial polymerizations. A broad concentration range of the monomers was covered (0.001–30 wt%). We defined the apparent encapsulation rate v E as measured from the deformability change of the emulsion droplet over time. This method allows for the extraction of different reaction laws for W/O and O/W encapsulations systems, and the relative importance of the concentration of both monomers on the reaction kinetics. Hence, we observe a common behaviour for both systems, that the component in the continuous phase has the highest influence on the kinetics. We compared different monomers and obtained reactivity trends compatible with literature. Furthermore, our method quantified for the first time a significant retardation effect of surface active agents on the encapsulation. A significant retardation of the encapsulation kinetics by the surfactants was found; the encapsulation rate is reduced by a factor of 5–10 which is probably caused by the blocking of reactive sites. The results represented here show that our tool is valuable for the measurement of reactive encapsulation kinetics, the study of soft reactive interfaces and might become a powerful technique for validating parameters for the generation of designer microcapsules with controlled properties.
Acknowledgments
JCB acknowledges the financial support of the Max-Planck Society and the support by a funding from the European Research Council (ERC) under the European Union's Seventh Framework Program (FP7/2007-2013)/ERC Grant agreement 306385-SofI. Furthermore, we thank J. Vrignon for providing and developing the image processing software.
References
- Benita S., Microencapsulation Methods and Industrial Applications, Taylor & Francis Group, Boca Raton, 2nd edn, 2006. [Google Scholar]
- Poshardi A., Kuna A. J. J. Res. ANGRAU. 2010;38:86. [Google Scholar]
- Friedman S. P., Mualem Y. Fert. Res. 1994;39:19. [Google Scholar]
- Drake C. F., United States Pat. 479474, 1998.
- Lapidot N., Gans O., Biagini F., Sosonkin L., Rottman C. J. Sol-Gel Sci. Technol. 2003;26:67. [Google Scholar]
- Faria A. F., Mignone R. A., Montenegro M. A., Mercadante A. Z., Borsarelli C. D. J. Agric. Food Chem. 2010;58:8004. doi: 10.1021/jf100925j. [DOI] [PubMed] [Google Scholar]
- Risch S. J. and Reineccius G. A., Encapsulation and controlled release of food ingredients, American Chemical Society, Washington, DC, 1995. [Google Scholar]
- Lensen D., Gelderblom E. C., Vriezema D. M., Marmottant P., Verdonschot N., Versluis M., Jong N., Hest J. C. M. Soft Matter. 2011;7:5417. [Google Scholar]
- Ichikawa H., Fujioka K., Adeyey M. C., Fukumori Y. Int. J. Pharm. 2001;216:67. doi: 10.1016/s0378-5173(01)00573-7. [DOI] [PubMed] [Google Scholar]
- Yeo Y., Bellas E., Firestone W., Langer R., Kohane D. S. J. Agric. Food Chem. 2005;53:7518. doi: 10.1021/jf0507947. [DOI] [PubMed] [Google Scholar]
- Taboada A. D., Maillet L., Banoub J. H., Lorch M., Rigby A. S., Boa A. N., Atkin S. L., Mackenzie G. J. J. Mater. Chem. B. 2013;1:707. doi: 10.1039/c2tb00228k. [DOI] [PubMed] [Google Scholar]
- He W., Gu X., Liu S. Adv. Funct. Mater. 2012;22:4023. [Google Scholar]
- Hu S. H., Tsai C. H., Liao C. F., Liu D. M., Chen S. Y. Langmuir. 2008;24:11811. doi: 10.1021/la801138e. [DOI] [PubMed] [Google Scholar]
- Zhao Q., Han B., Wang Z., Gao C., Peng C., Shen J. Nanomedicine. 2007;3:63. doi: 10.1016/j.nano.2006.11.007. [DOI] [PubMed] [Google Scholar]
- Morgan P. W., Condensation Polymers: By Interfacial and Solution Methods, John Wiley & Sons, New York, 1965. [Google Scholar]
- MacRitchie F. Trans. Faraday Soc. 1969;65:2503. [Google Scholar]
- Morgan P. W., Kwolek S. L. J. Polym. Sci. 1959;137:299. [Google Scholar]
- Wittbecker E. L., Morgan P. W. J. Polym. Sci. 1959;137:289. [Google Scholar]
- Sirdesai M., Khilar K. C. Can. J. Chem. Eng. 1988;66:509. [Google Scholar]
- Wagh S. J., Dhumai S. S., Suresh A. K. J. Membr. Sci. 2009;328:246. [Google Scholar]
- Yadav S. K., Ron N., Chandrasekharam D., Khilar K. C., Suresh A. K. J. Macromol. Sci., Part B: Phys. 1996;35(5):802. [Google Scholar]
- Yadav S. K., Suresh A. K., Khilar K. C. AIChE J. 1990;36:431. [Google Scholar]
- Yadav S. K., Khilar K. C., Suresh A. K. AIChE J. 1996;42:2616. [Google Scholar]
- Freger V. Langmuir. 2005;21:1884. doi: 10.1021/la048085v. [DOI] [PubMed] [Google Scholar]
- Robertson J., Centeno-Hall T., Padias A., Bates R., Hall H. Polymer. 2012;4:741. [Google Scholar]
- (a) Roland C. M., Twigg J. N., Vu Y., Mott P. H. Polymer. 2007;48:574. [Google Scholar]; (b) Cabral J. T., Hudson S. D. Lab Chip. 2006;6:427. doi: 10.1039/b511976f. [DOI] [PubMed] [Google Scholar]; (c) Hudson S. D., Cabral J. T., Goodrum W. J., Beers K. L., Amis E. J. Appl. Phys. Lett. 2005;87(8):081905. [Google Scholar]; (d) Taylor G. I. Proc. R. Soc. London, Ser. A. 1934;146:501. [Google Scholar]
- Yi J., Boyce M. C., Lee G. F., Balizer E. Polymer. 2006;47:319. [Google Scholar]
- Brosseau Q., Vrignon J., Baret J.-C. Soft Matter. 2014;10:3066. doi: 10.1039/c3sm52543k. [DOI] [PubMed] [Google Scholar]
- Odian G., Principles of Polymerization, John Wiley & Sons, Inc., Hoboken, New Jersey, 4th edn, 2004. [Google Scholar]
- Ulrich H., Chemistry and Technology of Isocyanates, John Wiley & Sons Ltd., Chichester, England1996. [Google Scholar]
- Delebecq E., Pascault J. P., Boutevin B., Ganachaud F. Chem. Rev. 2013;113:80. doi: 10.1021/cr300195n. [DOI] [PubMed] [Google Scholar]
- Entelis S. G., Nesterov O. V. Russ. Chem. Rev. 1966;35(12):917. [Google Scholar]
- Xia Y. N., Whitesides G. M. Abstr. Pap. Am. Chem. Soc. 1997;214:348. [Google Scholar]
- Liu K. K., Williams D. R., Briscoe B. J. Phys. Rev. E: Stat. Phys., Plasmas, Fluids, Relat. Interdiscip. Top. 1996;54:6673. doi: 10.1103/physreve.54.6673. [DOI] [PubMed] [Google Scholar]
- Pozrikidis C., Modeling and Simulation of Capsules and Biological Cells, Chapman & Hall/CRC, London, 2003. [Google Scholar]
- Polenz I., Weitz D. A., Baret J.-C. Langmuir. 2015;31(3):1127–1134. doi: 10.1021/la5040189. [DOI] [PubMed] [Google Scholar]


