

Abstract
The NIH Toolbox (NIHTB) Pattern Comparison Processing Speed Test was developed to assess processing speed within the NIHTB for the Assessment of Neurological Behavior and Function Cognition Battery (NIHTB-CB). This study highlights validation data collected in adults ages 18–85 on this measure and reports descriptive data, test–retest reliability, construct validity, and preliminary work creating a composite index of processing speed. Results indicated good test–retest reliability. There was also evidence for both convergent and discriminant validity; the Pattern Comparison Processing Speed Test demonstrated moderate significant correlations with other processing speed tests (i.e., WAIS-IV Coding, Symbol Search and Processing Speed Index), small significant correlations with measures of working memory (i.e., WAIS-IV Letter-Number Sequencing and PASAT), and non-significant correlations with a test of vocabulary comprehension (i.e., PPVT-IV). Finally, analyses comparing and combining scores on the NIHTB Pattern Comparison Processing Speed Test with other measures of simple reaction time from the NIHTB-CB indicated that a Processing Speed Composite score performed better than any test examined in isolation. The NIHTB Pattern Comparison Processing Speed Test exhibits several strengths: it is appropriate for use across the lifespan (ages, 3–85 years), it is short and easy to administer, and it has high construct validity.
Keywords: NIHTB, Processing speed, Pattern Comparison Processing Speed Test, Cognition, Neuropsychological assessment, Mental processes, Outcomes assessment (health care)
INTRODUCTION
The NIHTB for the Assessment of Neurological Behavior and Function Cognition is designed to be comprised of sensitive measures to evaluate cognitive, social, emotional and motor functioning across the lifespan (Gershon et al., 2010). In particular, the NIHTB Cognition Battery (NIHTB-CB) was designed to evaluate Processing Speed (PS), Executive Function, Episodic Memory, Working Memory, and Language, in less than 30 min. This manuscript focuses on the NIHTB Pattern Comparison Processing Speed Test, as well as preliminary work creating a composite index of processing speed using both this test and other measures of processing speed from within the NIHTB-CB. We discuss the theoretical rationale for the development of the NIHTB Pattern Comparison Processing Speed Test, beginning with a definition of PS and a brief discussion of its various forms. We provide a review of the literature of this construct across the lifespan (including the relationship with other cognitive domains and its relevance in clinical populations), and then highlight the relationship between PS and brain structure and function.
PS can be defined as either the amount of time it takes to process a specific quantity of information, or the quantity of information that can be processed within a specified unit of time (Kalmar & Chiaravalloti, 2008). Processing speed has been recognized as a major factor of intelligence and individual abilities since the late 1800s (see Coyle, Pillow, Snyder, & Kochunov, 2011; O’Brien & Tulsky, 2008) with substantial evidence that PS plays an important role in other aspects of cognition (DeLuca, Chelune, Tulsky, Lengenfelder, & Chiaravalloti, 2004; Dempster, 1981; Siegel, 1994).
The traditional study of PS fosters a conceptualization of PS as a unitary construct. However, evidence exists indicating that PS, in fact, is not a unitary construct and can be divided into separate “simple” and “complex” factors, with measures of each having very little shared variance (Chiaravalloti, Christodoulou, Demaree, & DeLuca, 2003). Measures of simple PS, such as reaction time, assess basic elements of attention and concentration requiring the recognition of a stimulus and a simple motor response. Measures of complex PS in contrast require more complex processes of attention and concentration, as well as mental manipulation.
The cognitive “skill” PS is evident from a very young age. PS can be considered a basic aspect of the child’s developing cognitive architecture, one that is partially based on biological processes (Kail, 2008). Importantly, PS is believed to underlie development in other cognitive domains as well (Flavell, 1992) and is important to the development of other cognitive abilities (Dempster, 1981; Siegel, 1994). Research has shown that age improves PS independent of task type from childhood through young adulthood (Hale, 1990; Kail, 1991). However, performance on PS tasks has been found to deteriorate after young adulthood (Cerella & Hale, 1994; Chaytor & Schmitter-Edgecombe, 2004) and even more so in advanced age (Salthouse, 1985, 1990, 1993; Schaie, 1989, 1994). Slowed PS has been associated with “normal aging” (as opposed to disease conditions), with decreases in PS being a significant contributor to an age-related decline in test scores in other cognitive domains (Finkel et al., 2004; Salthouse & Coon, 1993; Sliwinski & Buschke, 1997; Zimprich & Martin, 2002). PS declines have also been found to impact several aspects of mobility in older age groups including driving skills and gait.
PS has been shown to be highly vulnerable to brain damage; multiple clinical populations demonstrate diminished PS. These populations include traumatic brain injury, Multiple Sclerosis, Parkinson’s disease, symptomatic HIV, Chronic Fatigue Syndrome, dementia, sickle cell anemia, and schizophrenia (Chiaravalloti et al., 2003; DeLuca, Christodoulou et al., 2004; Demaree, DeLuca, Gaudino, & Diamond, 1999; Gronwall & Wrightson, 1981; Lengenfelder et al., 2006; Lezak, 1995; Llorente et al., 1998; Madigan, DeLuca, Diamond, Tramontano, & Averill, 2000; Martin, Donders, & Thompson, 2000; Sawamoto, Honda, Hanakawa, Fukuyama, & Shibasaki, 2002; Tiersky, Johnson, Lange, Natelson, & DeLuca, 1998; Vichinsky et al., 2010). PS measures are the most sensitive of neuropsychological tests, typically able to differentiate between clinical groups and healthy groups (Donders, Tulsky, & Zhu, 2001; Martin et al., 2000). However, PS deficits do not present in isolation. Slowed PS can negatively affect other cognitive test scores such as those for general intelligence (Coyle et al., 2011), verbal abilities (Sherman, Strauss, & Spellacy, 1997), long long-term memory (DeLuca, Barbieri-Berger, & Johnson, 1994; DeLuca, Gaudino, Diamond, Christodoulou, & Engel, 1998; Gaudino, Chiaravalloti, DeLuca, & Diamond, 2001), visuospatial skills, and working memory (Chiaravalloti et al., 2003; Demaree et al., 1999). In everyday life, there is clearly a cost for slowed PS, such as safety risks or occupational hazards due to real-world demands. Additionally, there is research that supports the notion that PS impairment is significantly correlated with decreased quality of life in clinical populations (Barker-Collo, 2006) and to the ability to perform tasks of daily living (Ball & Vance, 2008). Thus deficits in PS have wide-reaching effects that have a direct influence on an individual’s well-being.
Differences in PS are thought to depend on structural aspects of neural wiring, such as nerve diameter, integrity of myelin-sheathing, the number of ion-channels, and the efficiency of synaptic neurotransmission (Posthuma & de Geus, 2008). Research using diffusion tensor imaging has linked white matter change to more rapid processing (Mabbott, Laughlin, Rockel, & Bouffet, 2005). During childhood and adolescence, there are age-related changes in the number of transient connections in the central nervous system (Huttenlocher, 1979) as well as age-related increases in myelinization (Yakovlev & Lecours, 1967) which lead to faster PS.
Although a fair amount of research has been conducted investigating the neural processes associated with PS, we are only beginning to understand its potential biological substrate (DeLuca, 2008). Diminished PS has been associated with neurotransmitter activity (e.g., diminished cholinergic function, reduced D2 receptor sites for dopamine and altered glutamate activity), white matter integrity (e.g., increased number of white matter intensities on MRI structural neuroimaging), diminished glucose metabolism, and decreased nerve conduction velocities (e.g., evoked potentials, event-related potentials or ERPs, electroencephalogram or EEG). The most advanced and well accepted theoretical model of the biological substrates of PS is the “neural efficiency model”, most often associated with the study of intelligence (Jensen, 1982; Vernon, 1983, 1987). This model states that a faster central nervous system allows for more rapid processing of information and is related to more efficient processing and higher intelligence. Faster PS allows more information to be processed before it is lost through decay or interference and is therefore more efficient (Jensen, 1993).
Neuroimaging techniques have recently been applied in both healthy individuals and clinical populations to elucidate the relationships between PS and functional brain activity. For example, research using functional magnetic resonance imaging (fMRI) has found a positive relationship between processing speed performance and the activation of the fronto-parietal networks (Forn et al., 2013). Furthermore, increased processing speed demands are associated with greater patterns of connectivity within the fronto-partietal and occipital regions, as well as an increase in the number of functional networks involved. FMRI research has also suggested that processing speed training can improve functional connectivity in healthy controls (Takeuchi et al., 2011), and that processing speed is related to fiber integrity between the superior putamen and the left motor cortex (Ystad et al., 2011).
Additional studies of functional connectivity in clinical populations have also afforded us a window to understanding PS deficits. For example, several studies have examined the relationship of PS to functional connectivity in MS. Genova, Hillary, Wylie, Rypma, and colleagues Deluca (2009) compared the functional brain activity of individuals with MS to healthy controls during performance of a PS task using BOLD fMRI and found that although there were no differences in performance accuracy, the MS group was significantly slower than the healthy group. While both groups showed similar activation involving the precentral gyrus and occipital cortex, the MS group showed significantly less activity in bilateral frontal and parietal regions, similar to that which has been noted in aging samples. The data indicated that the neural networks involved in processing speed differ between healthy control participants and MS participants, with HCs activating more frontal and parietal regions and person with MS activating insula, thalamus and anterior cingulate regions. Kochunov and colleagues (2010) explored the relationship between slowed PS and changes in the cerebral integrity of the frontal lobe via MRI/MRS in 38 healthy adults (age 57–90 years). Two components of PS were extracted from factor analysis of neuropsychological test data: psychomotor (PM) and psychophysical (PP). A substantial fraction of the variance in the PM-PS (58%) was attributed to atrophic changes in frontal white matter, while a smaller proportion (20%) of variance in the PP-PS could be explained by changes in frontal white matter. Smith and colleagues (2012) similarly found a compensatory increase in activation in MS participants compared to healthy controls in the prefrontal cortex and right temporal gyri, with additional areas of decreased activity in MS participants in the left temporal gyri.
A more recent study using functional connectivity to examine neural circuitry during a PS task showed that, while there was a great deal of overlap in the connections relied upon by both persons with MS and healthy controls, the MS group showed significantly more connections from multiple regions to frontal cortices bilaterally relative to healthy controls (Leavitt, Wylie, Genova, Chiaravalloti, & Deluca, 2012). This greater neural recruitment by the MS group relative to healthy controls was interpreted to be consistent with the neural efficiency hypothesis, further supporting the belief that more connections must be recruited to maintain performance in the presence of brain pathology. Similarly, Ready and colleagues (2011) noted decreased white matter volume to be significantly correlated with slower processing speed in a sample of healthy midlife children of a parent with Alzheimer’s disease. The authors concluded PS and changes in white matter volume to be potential indicators of preclinical decline in Alzheimer’s disease. Using Diffusion Tensor Imaging (DTI), Sasson, Doniger, Pasternak, Tarrasch, and colleagues Assaf (2012) found information processing speed to be correlated with DTI parameters in the cingulum, corona radiata, inferior longitudinal fasciculus, parietal white matter and thalamus.
Other clinical populations have also demonstrated support for similar functional relationships including individuals with ageness of the corpus callosium, individuals with type 1 diabetes mellitus, and individuals with mild cognitive impairment (MCI). For example, individuals with agenesis of the corpus callosium (relative to controls) had significant correlations between processing speed tasks with resting functional connectivity of the left medial and superior temporal lobe (using magnetoencephalographic imaging; Hinkley et al., 2012). In addition, research in individuals with type 1 diabetes mellitus (relative to controls) using resting state fMRI indicated that better processing speed is related to increased connectivity (van Duinkerken et al., 2009; van Duinkerken et al., 2012). Similar work using fMRI in individuals with MCI (relative to controls) indicated that MCI participants showed less functional connectivity between the posterior cingulate cortex and the right inferior frontal, left fusiform, left rectal, and left precentral regions (Han et al., 2012). Taken together, these studies indicate that impairments in PS commonly seen in clinical populations are related to changes in brain structure and brain function. This line of research is only beginning to shed light on the intricate relationship between cerebral integrity and processing speed.
Given the complexity of PS development, its intricate relationships with other cognitive domains, and the fact that PS is not a unitary construct, the development of a valid and reliable measure of PS for use in the NIHTB-CB was not a simple task. The NIHTB PS measure was developed to be similar to other traditional processing speed tests (Salthouse, Babcock, & Shaw, 1991; Wechsler, 2008). The task is an extensively researched test of choice reaction time that was able to be easily adapted for computerized administration. Two visual patterns are presented on a computer screen and the examinee is asked to judge if the patterns are the “same” (“Yes” button response) or “not the same” (“No” button response). A slight adaptation made the task completely non-verbal for children under the age of 8, who are asked to indicate these choices with a “smiley” or “frowny” face button. Adequate variability of performance across the full age range of the sample (ages 3–85 years) was assured by altering the type, complexity, and number of stimuli.
Development of the NIHTB Pattern Comparison Processing Speed Test
As mentioned above, the NIHTB Pattern Comparison Processing Speed Test was developed to be similar to other traditional processing speed tests (Salthouse et al., 1991; Wechsler, 2008). Development occurred over three different phases of data collection. During the initial phase of development, eight 3-year-old children and 10 adults (ages 21 to 30) were administered a set of items that varied on one of three dimensions: adding/taking something away, one versus many, or changing positions. Scores reflected the number of correct items (out of a possible 251) completed in 3 min. Children received an average score of 44.4 (SD = 12.3; range, 25–59) and made an average of 9.5 errors (SD = 12.3; range, 3–13); adults received an average score of 110.8 (SD 18.9) and made an average of 2.4 errors (SD = 3.6). Findings from this study also indicated that eight items were potentially problematic for children (i.e., where >50% of participants made errors) the majority of which involved changes in position; therefore, the task was revised to exclude items along this dimension. The task was also revised to include new items that varied on an additional dimension, color.
The second phase of development was conducted on the revised, 2 min version of the task (now including patterns for the following three dimensions: color, adding/taking something away, or one vs. many) in n = 138 participants: n = 54 children ages 3 to 6, n = 39 adults ages 18 to 50, and n = 45 older adults ages 65–85. A subset of participants (n = 49) also completed a retest within 1 to 3 weeks (n = 22 children, n = 20 adults, n = 7 older adults). We used three different time cut-offs (60, 90, or 120 s) to determine optimal test administration time; performance was comparable regardless of the test administration time. We decided to move ahead using the 90-s version of the test. For this 90-s version, children completed an average of 55.33 items (SD = 28.3), young adults completed 129.1 (SD = 32.4) and older adults completed an average of 93.7 items (SD = 29.3). Test–retest correlations were .81 across the sample, indicating good reliability. In addition, items with less than 75% correct response rates were dropped, and findings provided support for deleting the one versus many discrimination for children ages 3–7 years.
For the third phase of development n = 137 participants completed this task (n = 26 participants ages 3–4 years, n = 24 ages 5–7 years, n = 26 ages 8–14 years, n = 31 ages 23–35 years, and n = 30 ages 65–85 years). Furthermore, 125 individuals completed a retest within one 1 to three 3 weeks (n = 25 participants’ ages 3–4 years, n = 24 ages 5–7 years, n = 15 ages 8–14 years, n = 24 ages 23–35 years, and n = 20 ages 65–85 years). Test–retest reliability ranged from .46 (for ages 3–4) to .74 (for the older adults). Items with less than 75% correct response rates were dropped for the final version of the measure.
This manuscript presents data supporting the validity and reliability of the final version of this test in the adult sample. In addition, we present preliminary work for a composite measure of processing speed using the NIHTB Pattern Comparison Processing Speed test, as well as the processing speed components of two other NIHTB measures (the Flanker Inhibitory Control Test and the Dimensional Change Card Sort Test). Similar information is provided in another source for the pediatric and child samples (Carlozzi, Tulsky, Kail, & Beaumont, 2013).
METHOD
Participants
The participants in the validation phase are described in detail in Weintraub et al. (this issue). Briefly, the sample consisted of 268 participants ages 20 to 85 years (n = 159 ages 20–60 and n = 109 ages 65 to 85). Sample recruitment was distributed across age, gender, race, and education strata. A subset of 89 participants (approximately 33%) completed a retest 7 to 21 days later to assess test–retest reliability. All study sites received approval from their local Institutional Review Board before participation in this study.
NIHTB-CB Measures
The NIHTB Pattern Comparison Processing Speed Test requires participants to identify whether two visual patterns are the “same” or “not the same” (responses were made by pressing a “yes” or “no” button). Patterns were either identical or varied on one of three dimensions: color (all ages), adding/taking something away (all ages), or one versus many (only ages 8–15 years; see Figure 1). Scores reflected the number of correct items (of a possible 130) completed in 90 s; as described above, items were designed to minimize the number of errors that were made (i.e., items with less than 75% accuracy during development were not included in the final version of this task). This test takes approximately 3 min to administer.
Fig. 1.
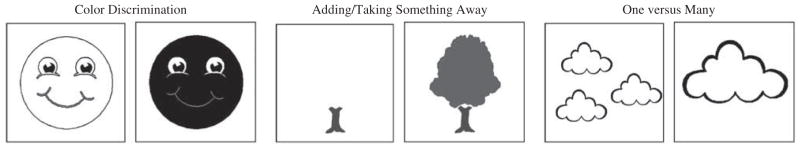
Examples of types of discrimination on the NIHTB Pattern Comparison Processing Speed Test.
The NIHTB Flanker Inhibitory Control Test
This test examines the ability to select a visual stimulus and to inhibit responses to distractors and is also described in detail in Zelazo et al. (this issue). For the composite measure, we examined the mean RT for all Flanker trials (congruent and incongruent).
The NIHTB Dimensional Change Card Sort (DCCS) Test
This test examines cognitive flexibility (i.e., task switching/set shifting) and is also described in detail in Zelazo et al. (this issue). For the composite measure, we examined the mean RT for all DCCS trials (congruent and incongruent).
The Processing Speed Composite
Processing Speed Composite was derived from two the NIHTB Dimensional Change Card Sort (DCCS) and the NIHTB Flanker Inhibitory Control Test (mentioned above). For the composite measure, we extracted mean RT for all congruent and incongruent trials.
Validation Measures
WAIS-IV Coding (Wechsler, 2008)
This test requires the participant to associate numbers and symbols using a key. This measure is sensitive to motor coordination, short-term memory deficits, and visuoperceptual problems in addition to processing speed (Tulsky, Saklofske, & Zhu, 2003). The score is the number of items completed correctly in 120 s (maximum 135 s).
WAIS-IV Symbol Search (Wechsler, 2008)
In this task, participants are presented with a two target symbols (designs) followed by a test series of symbols that either include or do not include the target designs. The participant must search the test series to identify whether either target symbol is part of the search series. There are successive rows of target and search series and the participant is allowed 120 s to complete as many as possible as quickly as possible. Scores reflect number correct, minus number incorrect in 120 s (maximum 60).
WAIS-IV Processing Speed Index (PSI) (Wechsler, 2008)
The PSI is a composite score that combines performance on WAIS-IV coding and WAIS-IV Symbol Search. The PSI is significantly lower in individuals with several neuropsychological and psychoeducational problems (Hawkins, 1998; Martin et al., 2000).
WAIS-IV Letter-Number Sequencing (Wechsler, 2008)
In this test, participants are presented with a mixed list of numbers and letters, and their task is to repeat the list by saying the numbers first in ascending order and then the letters in alphabetical order. This subtest has a strong working memory component (Crowe, 2000; Gold, Carpenter, Randolph, Goldberg, & Weinberger, 1997; Haut, Kuwabara, Leach, & Arias, 2000). Furthermore, there is evidence that this subtest discriminates between individuals with TBI and matched controls (Donders et al., 2001). Scores reflect the number of correct responses for letter-number strings ranging from three to nine items (maximum 30 points).
The Paced Auditory Serial Addition Test (Gronwall, 1977)
The PASAT is a measure of cognitive function that specifically assesses auditory information processing speed and flexibility, attention and calculation ability. Single digits are presented every 2 s and the participant must add each new digit to the one immediately before it. The dependent variable is the number of correct sums given (maximum 49).
Peabody Picture Vocabulary Test, IV Edition (Dunn & Dunn, 2007)
The PPVT-IV provides a measure of vocabulary comprehension. Examinees are asked to identify which of four pictures reflects a specific word spoken by the examiner. Scores are based on the number correct (maximum 228).
Data Analysis
This initial report on the NIHTB-CB measures includes results from analyses of test–retest reliability, associations of test scores with age and education, and convergent and discriminant validity. Age associations reflect the validity of the Toolbox Cognition tests for detecting age-related cognitive decline during adulthood. Convergent and discriminant validity results provide evidence that the NIHTB-CB is measuring the intended constructs.
For the NIHTB-CB measures and the “gold standard” validation measures listed above, scaled scores were created by first ranking the raw scores, next applying a normative transformation to the ranks to create a standard normal distribution, and finally rescaling the distribution to have a mean of 10 and a standard deviation of 3. These scaled scores were used for all analyses and are not adjusted for age. Pearson correlation coefficients between age and test performance were calculated to assess the ability of each test within the NIHTB-CB to detect cognitive developmental growth during childhood and age-related cognitive decline during adulthood. Intraclass correlation coefficients (ICC) with 95% confidence intervals were calculated to evaluate test–retest reliability; we elected to use ICC to examine test–retest correlations because Pearson correlation coefficients are not sensitive to systematic changes (e.g., practice effects) and can over-estimate reliability (Denegar & Ball, 1993). Convergent validity was assessed with correlations between the NIHTB-CB measure and a well-established “gold standard” measure of the same construct; evidence of discriminant validity consisted of lower correlations with selected “gold standard” measures of a different cognitive construct. Across measures, correlations less than 0.3 were considered poor, 0.3–0.6 adequate, and 0.6 or greater were good to very good evidence of convergent validity; evidence of discriminant validity consisted of lower correlations with selected “gold standard” measures of a different cognitive construct (Campbell & Fiske, 1959). Other demographic group comparisons were then performed using general linear models to examine other demographic associations with performance. These models were adjusted for age, gender, and education, where appropriate. Effect sizes are reported as Cohen’s d, with cutoffs of .20, .50, and .80 indicating small, medium, and large effects, respectively.
RESULTS
Of the 268 participants in the study, 264 completed the NIHTB Pattern Comparison Processing Speed Test (n = 158 ages 20–60 and n = 106 ages 65 to 85). Participants ages 20–60 had average scaled scores of 11.1 (SD = 2.7) and completed 45.0 correct items (SD = 8.5) with 0.8 errors (SD = 1.2), whereas participants ages 65–85 had average scores of 8.4 (SD = 2.7) and completed 36.8 correct items (SD = 8.4) with 0.6 errors (SD = 1.0); age effects are described below. Furthermore, men had average scores of 9.9 (SD = 2.8) and completed 41.3 correct items (SD = 8.6) with 0.7 errors (SD = 1.1), whereas women had average scores of 10.1 (SD = 3.1) and completed 42.0 correct items (SD = 9.9) with 0.7 errors (SD = 1.2); adjusted comparisons by gender are described below.
Test–Retest Reliability
The mean test–rest interval for the 89 retested individuals was 15.5 days (SD = 4.8). Overall ICC for test–retest reliability for the NIHTB Pattern Comparison Processing Speed Test was .73 (95% CI: .62, .81). Scores increased a mean of 0.50 points (SD = 2.05, ES = 0.24; p = .024), indicating a small practice effect.
Age Effects
Figure 2 provides a graphic presentation of performance on the NIHTB Pattern Comparison Processing Speed Test. A negative association between age and the NIHTB Pattern Comparison Processing Speed Test, r(262) = − .55; p <.0001, was seen. As anticipated based on a large body of past evidence, older individuals completed fewer items correctly than young individuals.
Fig. 2.

The NIHTB Pattern Comparison Processing Speed Test scores by age (scaled score (±2 standard error)).
Convergent and Discriminant Validity
Table 1 shows results for convergent and discriminant validity. Correlations for convergent validity with other processing tests ranged from r = .50 to r = .54 (all p <.0001), suggesting that the NIHTB Pattern Comparison Processing Speed Test is indeed tapping processing speed. Correlations for discriminant validity measures ranged from r = .36 to r = .38 for measures of working memory (all p <.0001), and were nonsignificant with a measure of expressive vocabulary (r = − .05; p = .47). This indicates that the NIH Pattern Comparison Processing Speed Test is also tapping into speeded working memory tasks, but not expressive vocabulary.
Table 1.
Convergent and Discriminant Validity of the NIHTB Pattern Comparison Processing Speed Test
| Gold Standard Measure | The NIHTB Pattern Comparison Processing Speed Test
|
||
|---|---|---|---|
| df | r | p | |
| Convergent Validity Measures | |||
| WAIS-IV Coding | 260 | .50 | < .0001 |
| WAIS-IV Symbol Search | 261 | .52 | < .0001 |
| WAIS-IV Processing Speed Composite | 261 | .54 | < .0001 |
| Discriminant Validity Measures | |||
| Working Memory | |||
| PASAT | 253 | .36 | < .0001 |
| WAIS-IV Letter-Number Sequencing | 259 | .38 | < .0001 |
| Vocabulary Comprehension | |||
| PPVT-IV | 260 | − .05 | .47 |
Note. Unadjusted scaled scores were utilized in analyses.
Processing Speed Composite Score
Three measures of processing speed (NIHTB Pattern Comparison Processing Speed Test, and mean RT from all DCCS and Flanker trials) were used to create an NIHTB Processing Speed Composite Score. The individual scores (NIHTB Pattern Comparison Processing Speed, NIHTB DCCS, and NIHTB Flanker Inhibitory Control Test mean RT) and the Processing Speed Composite Score demonstrated similar correlations with age (r = − .52 to − .57; see Table 2) and test–retest reliabilities (r = .74–.83; see Table 2). The NIHTB Processing Speed Composite demonstrated higher correlations with gold standards than did the NIHTB Pattern Comparison Processing Speed Test (see Table 3).
Table 2.
Age-related Correlations and Test-retest Correlations for the NIHTB Pattern Comparison Processing Speed Test and the NIHTB Processing Speed Composite Score (using the NIHTB Pattern Comparison Processing Speed Test, the NIH Toolbox DCCS, and the NIHTB Flanker Inhibitory Control Test) for Adults Ages 20 to 85 Years
| NIHTB Cognition Domain Measure | Age-related correlations
|
Test-retest correlations
|
||
|---|---|---|---|---|
| df | r | df | r | |
| NIHTB Pattern Comparison Processing Speed Test | 262 | − .55 | 87 | .74 |
| NIHTB Processing Speed Composite | 265 | − .57 | 87 | .82 |
Note. All p <.0001; DCCS = Dimensional Change Card Sort.
Table 3.
Correlations between NIHTB Processing Speed Composite Score (using the NIHTB Pattern Comparison Processing Speed Test, the NIHTB DCCS, and the NIHTB Flanker Inhibitory Control Test) and Gold Standard Measures
| Processing Speed Estimate | Gold Standard Measures
|
|||||||||||
|---|---|---|---|---|---|---|---|---|---|---|---|---|
| WAIS-IV Processing Speed Composite
|
WAIS-IV Letter Number Sequencing
|
PASAT
|
PPVT-IV | |||||||||
| r | df | p | r | df | p | r | df | p | r | df | p | |
| NIHTB Pattern Comparison Processing Speed Test | .54 | 261 | <.0001 | .38 | 259 | <.0001 | .36 | 253 | <.0001 | − .05 | 260 | .47 |
| NIHTB Processing Speed Composite | .62 | 262 | <.0001 | .45 | 260 | <.0001 | .39 | 254 | <.0001 | − .01 | 261 | .93 |
Other Demographic Comparisons
Table 4 shows effect sizes for other demographic factors known to influence cognitive performance, after adjusting for age and other additional relevant demographic variables. A significant difference in the NIHTB Pattern Comparison Processing Speed Test and the Processing Speed Index from the WAIS-IV was found between males and females, with small effect sizes of −0.24 to − 0.38 in magnitude. Females scored better than males on both measures. The effect of education was statistically significant for the Processing Speed Index Score from the WAIS-IV, but NOT for the Pattern Comparison Processing Speed Test. The effect of race/ethnicity was statistically significant for both processing speed measures, with differences favoring the whites in both cases.
Table 4.
Effect sizes (ES) for demographic comparisons of scores between groups
| Pattern Comparison Processing Speed | Processing Speed Index Score from the WAIS-IV | |
|---|---|---|
| ES (male vs. female)1 | − 0.24 | − 0.38 |
| p | .02 | <.001 |
| ES (Black vs. White)2 | − 0.36 | − 0.56 |
| ES (Hispanic vs. White)2 | − 0.38 | − 0.35 |
| p | .004 | <.001 |
| ES (College vs. <HS)3 | 0.14 | 0.61 |
| ES (College vs HS Grad)3 | 0.26 | 0.38 |
| ES (HS Grad vs. <HS)3 | −0.12 | 0.23 |
| p | .149 | <.001 |
DISCUSSION
The NIHTB Pattern Comparison Processing Speed Test component of the NIHTB-CB was developed to assess processing speed across the lifespan (from ages 3–85); it is part of a 30-min battery designed to assess multiple domains of cognitive function. This paper study highlights the relevance and utility of the NIH Pattern Comparison Processing Speed Test in adults (data examining children is presented in Carlozzi et al., 2013). Test–retest reliability, age-related performance, and construct validity, were examined relative to gold standard measures of processing speed to explore the utility of this measure in adults. In addition, data were presented that explore the optimal method of estimating processing speed within the NIHTB-CB using both the NIHTB Pattern Comparison Processing Speed Test, as well as two other cognitive measures from the NIHTB that include simple reaction time measures (the NIHTB DCCS and the NIHTB Flanker Inhibitory Control Test).
As highlighted above, results provided support for the reliability of the NIHTB Pattern Comparison Processing Speed Test. Specifically, test–retest reliability was good; this is particularly important given the fact that the NIHTB is expected to be used in longitudinal studies (Weintraub et al., Under Review). Furthermore, the Pattern Comparison Processing Speed Test followed a well-defined developmental trajectory, providing support for its validity. Thus, processing speed is shortened systematically through childhood and adolescence (Hale, 1990; Kail, 1991), peaks in young adulthood and slows modestly during middle age (Cerella & Hale, 1994; Chaytor & Schmitter-Edgecombe, 2004), and more substantially in adults over age 65 (Finkel et al., 2004; Salthouse, 1985, 1990, 1993; Salthouse & Coon, 1993; Schaie, 1989, 1994; Sliwinski & Buschke, 1997; Zimprich & Martin, 2002). Consistent with this pattern, performance on the NIHTB Pattern Comparison Processing Speed Test performance improved in our youngest age groups (Carlozzi et al., 2013) and declined modestly in middle age, and more substantially in our oldest adults (see Figure 1).
Convergent and discriminant validity of the NIHTB Pattern Comparison Processing Speed Test were also supported by our findings. Specifically, the test demonstrated moderate relations with other measures that examine processing speed, smaller associations with a related, but different domain of cognitive function (i.e., working memory), and an insubstantial relationship with domains of cognition less reliant on PS (i.e., vocabulary comprehension; see Table 3). This is consistent with literature that highlights an overlap between PS and working memory (Chiaravalloti et al., 2003; Demaree et al., 1999), as well as literature that suggests that vocabulary is not significantly correlated with processing speed (Bell, Lassiter, Matthews, & Hutchinson, 2001).
Analyses examining the NIHTB Processing Speed Composite score indicated that when three indices of processing speed were combined (NIHTB Pattern Comparison Processing Speed score, and NIHTB DCCS and Flanker Inhibitory Control reaction times), the relation between the NIHTB Processing Speed Composite and the gold standard measures were slightly stronger than those between the NIHTB Pattern Comparison Processing Speed Test (alone) and the gold standard measures. This finding is consistent with research that indicates that findings based on multiple observations are more robust than any single score in isolation; composite scores are generally more robust, more sensitive, and include less measurement error, than any estimation based on a single score. Ultimately, this type of composite score should have utility in clinical trials and longitudinal research involving participants across a broad age range.
Finally, an examination of the NIHTB Pattern Comparison Processing Speed test with demographic factors (other than age, which is described above) indicated that, in some cases the new test may be functioning slightly differently than the gold standard measures used (Lezak, 1995; Strauss, Sherman, & Spreen, 2006). For example, after controlling for relevant demographic variables, there was no significant education effect for the NIHTB Pattern Comparison Processing Speed test, but small to medium effect sizes for the gold standard measures. While the fact that the absence of education effects for the NIHTB is desirable, it is not consistent with the literature. Furthermore, although we found race/ethnic differences for both the NIHTB test and the gold standard, these differences were smaller for the new NIHTB test. With regard to gender, findings were consistent with the literature: females performed slightly better than males on both the NIHTB test and the gold standard measure (e.g., Camarata & Woodcock, 2006; Majeres, 1997; Majeres, 1999). Further research is needed to examine such demographic effects in different and larger samples to see if findings (especially with respect to education), can be replicated. If such findings are replicated, this might suggest that there is something unique about the NIHTB Pattern Comparison Test.
While the Pattern Comparison Processing Speed Test offers many strengths, it is important to recognize some test limitations. In the validation of the NIHTB-CB, a touchscreen was used to record responses. The movement of the entire hand to the touch screen introduced an additional time factor that has not been part of standard processing speed tasks. For the norming version of the test, the response mode was changed to the arrow keys on the computer keyboard. Although the key presses provide shorter reaction times, like the touchscreen, they also require intact motor functions. In populations where motor functioning is impaired, there is no way to distinguish among slowed responses due to motor impairment, slowed responses due to cognitive impairment, or slowed responses due to some combination of motor and cognitive impairment. While this is a test weakness, is it a problem that is shared but many other processing speed tests. Tasks such as the Sternberg paradigm (Sternberg, 1966) were designed specifically to tease apart these factors but require much more time for administration than was available in the context of the entire battery. An additional limitation of the task is related to the distinction between simple and complex PS highlighted above (Chiaravalloti et al., 2003). Both the Pattern Comparison Processing Speed Test and the NIHTB Processing Composite Score assess complex PS and may be less valuable as a measure of simple PS. Furthermore, while much research examining processing speed effects indicate differential effects as a function of test segment (especially for clinical populations), this measure does not capture timing data during task administration, and therefore examination by time segment (which can be especially informative in clinical populations) is not possible.
Regardless of these limitations, the NIHTB Pattern Comparison Processing Speed Test provides a brief, sensitive measure of processing speed across the lifespan. Future work is underway to collect extensive normative data, which will allow clinicians and researchers to use this measure to quantify deficits in processing speed across the lifespan. In addition, work is underway to examine the utility and sensitivity of this and the other tests in the NIHTB-CB to neurological insult (e.g., traumatic brain injury, stroke, Alzheimer’s disease). Ultimately, the 90-s Toolbox Pattern Comparison Processing Speed Test provides a reliable measurement of complex PS that should be useful over the lifespan, and be sensitive to both developmental changes and neurological insult.
Acknowledgments
This study is funded in whole or in part with Federal funds from the Blueprint for Neuroscience Research, National Institutes of Health, under Contract No. HHS-N-260-2006-00007-C.
Footnotes
The authors do not have any conflicts of interest to report.
Disclaimer: The views and opinions expressed in this report are those of the authors and should not be construed to represent the views of NIH or any of the sponsoring organizations, agencies, or the U.S. government.
Disclosures
Dr. Carlozzi is funded by NIH grants R03NS065194, R01NR013658, R01NS077946, U01NS056975. She was previously funded by contracts H133B090024, B6237R, H133G070138, H133A070037-08A and a grant from the NJ Department of Health and Senior Services.
Dr. Tulsky is funded by NIH contracts H133B090024, H133N060022, H133G070138, B6237R, cooperative agreement U01AR057929, and grant, R01HD054659. He has received consultant fees from the Institute for Rehabilitation and Research, Frazier Rehabilitation Institute/Jewish Hospital, Craig Hospital, and Casa Colina Centers for Rehabilitation.
Dr. Chiaravalloti is funded by the National Multiple Sclerosis Society (NMSS; PP1952), the National Institutes of Health (NIH; R01NR013658; R01AG032088), the National Institute on Disability and Rehabilitation Research (NIDRR: H133A120030) the New Jersey Commission on Spinal Cord Injury Research (CSCR13IRG018) and the New Jersey Commission on Brain Injury Research (CBIR12IRG004 to support research unrelated to this project.
Ms. Beaumont served as a consultant for NorthShore University HealthSystem, FACIT.org, and Georgia Gastroenterology Group PC. She received funding for travel as an invited speaker at the North American Neuroendocrine Tumor Symposium.
Dr. Weintraub is funded by NIH grants # R01DC008552, P30AG013854, and the Ken and Ruth Davee Foundation and conducts clinical neuropsychological evaluations (35% effort) for which her academic-based practice clinic bills. She serves on the editorial board of Dementia & Neuropsychologia and advisory boards of the Turkish Journal of Neurology and Alzheimer’s and Dementia.
Dr. Conway reports no disclosures.
Dr. Gershon has received personal compensation for activities as a speaker and consultant with Sylvan Learning, Rockman, and the American Board of Podiatric Surgery. He has several grants awarded by NIH: N01-AG-6-0007, 1U5AR057943-01, HHSN260200600007, 1U01DK082342-01, AG-260-06-01, HD05469, NINDS: U01 NS 056 975 02, NHLBI K23: K23HL085766 NIA; 1RC2AG036498-01; NIDRR: H133B090024, OppNet: N01-AG-6-0007.
References
- Ball K, Vance DE. Everyday life applications and rehabilitation of processing speed deficits: Aging as a model for clinical populations. In: DeLuca J, Kalmar JH, editors. Information processing speed in clinical populations. New York: Taylor and Francis; 2008. [Google Scholar]
- Barker-Collo SL. Quality of life in multiple sclerosis: Does information-processing speed have an independent effect? Archives of Clinical Neuropsychology. 2006;21(2):167–174. doi: 10.1016/j.acn.2005.08.008. [DOI] [PubMed] [Google Scholar]
- Bell NL, Lassiter KS, Matthews TD, Hutchinson MB. Comparison of the Peabody Picture Vocabulary Test—-Third Edition and Wechsler Adult Intelligence Scale—Third Edition with university students. Journal of Clinical Psychology. 2001;57(3):417–422. doi: 10.1002/jclp.1024. [DOI] [PubMed] [Google Scholar]
- Camarata S, Woodcock R. Sex differences in processing speed: Developmental effects in males and females. Intelligence. 2006;34(3):231–252. doi: 10.1016/j.intell.2005.12.001. [DOI] [Google Scholar]
- Campbell DT, Fiske DW. Convergent and discriminant validation by the multitrait-multimethod matrix. Psychological Bulletin. 1959;56(2):81–105. [PubMed] [Google Scholar]
- Carlozzi NE, Tulsky DS, Kail RV, Beaumont JL. Chapter VI. NIH Toolbox Cognition Battery (CB): Measuring processing speed. Monographs of the Society for Research in Child Development. 2013;78(4):88–102. doi: 10.1111/mono.12036. [DOI] [PMC free article] [PubMed] [Google Scholar]
- Cerella J, Hale S. The rise and fall in information-processing rates over the life span. Acta Psychologica. 1994;86(2–3):109–197. doi: 10.1016/0001-6918(94)90002-7. [DOI] [PubMed] [Google Scholar]
- Chaytor N, Schmitter-Edgecombe M. Working memory and aging: A cross-sectional and longitudinal analysis using a self-ordered pointing task. Journal of the International Neurop-sychological Society. 2004;10(4):489–503. doi: 10.1017/S1355617704104013. [DOI] [PubMed] [Google Scholar]
- Chiaravalloti ND, Christodoulou C, Demaree HA, DeLuca J. Differentiating simple versus complex processing speed: Influence on new learning and memory performance. Journal of Clinical and Experimental Neuropsychology. 2003;25(4):489–501. doi: 10.1076/jcen.25.4.489.13878. [DOI] [PubMed] [Google Scholar]
- Coyle TR, Pillow DR, Snyder AC, Kochunov P. Processing speed mediates the development of general intelligence (g) in adolescence. Psychological Science. 2011;22(10):1265–1269. doi: 10.1177/0956797611418243. [DOI] [PMC free article] [PubMed] [Google Scholar]
- Crowe SF. Does the letter number sequencing task measure anything more than digit span? Assessment. 2000;7(2):113–117. doi: 10.1177/107319110000700202. [DOI] [PubMed] [Google Scholar]
- DeLuca J. How fast, how slow and how come. In: DeLuca J, Kalmar JH, editors. Information processing speed in clinical populations. New York: Taylor and Francis; 2008. [Google Scholar]
- DeLuca J, Barbieri-Berger S, Johnson SK. The nature of memory impairments in multiple sclerosis: Acquisition versus retrieval. Journal of Clinical and Experimental Neuropsychology. 1994;16:183–189. doi: 10.1080/01688639408402629. [DOI] [PubMed] [Google Scholar]
- DeLuca J, Chelune GJ, Tulsky DS, Lengenfelder J, Chiaravalloti ND. Is speed of processing or working memory the primary information processing deficit in multiple sclerosis? Journal of Clinical and Experimental Neuropsychology. 2004;26(4):550–562. doi: 10.1080/13803390490496641. [DOI] [PubMed] [Google Scholar]
- DeLuca J, Christodoulou C, Diamond BJ, Rosenstein ED, Kramer N, Natelson BH. Working memory deficits in chronic fatigue syndrome: Differentiating between speed and accuracy of information processing. Journal of the International Neuropsychological Society. 2004;10(1):101–109. doi: 10.1017/S1355617704101124. [DOI] [PubMed] [Google Scholar]
- DeLuca J, Gaudino EA, Diamond BJ, Christodoulou C, Engel RA. Acquisition and storage deficits in multiple sclerosis. Journal of Clinical and Experimental Neuropsychology. 1998;20(3):376–390. doi: 10.1076/jcen.20.3.376.819. [DOI] [PubMed] [Google Scholar]
- Demaree HA, DeLuca J, Gaudino EA, Diamond BJ. Speed of information processing as a key deficit in multiple sclerosis: Implications for rehabilitation. Journal of Neurology, Neurosurgery, & Psychiatry. 1999;67(5):661–663. doi: 10.1136/jnnp.67.5.661. [DOI] [PMC free article] [PubMed] [Google Scholar]
- Dempster FN. Memory span - Sources of individual and developmental differences. Psychological Bulletin. 1981;89(1):63–100. [Google Scholar]
- Denegar CR, Ball DW. Assessing reliability and precision of measurement: An introduction to intraclass correlation and standard error of measurement. Journal of Sport Rehabilitation. 1993;2(1):35–42. [Google Scholar]
- Donders J, Tulsky DS, Zhu J. Criterion validity of new WAIS-II subtest scores after traumatic brain injury. Journal of the International Neuropsychological Society. 2001;7(7):892–898. [PubMed] [Google Scholar]
- Dunn LM, Dunn DM. Peabody Picture Vocabulary Test. 4. Minneapolis, MN: NCS Pearson; 2007. [Google Scholar]
- Finkel SI, Mintzer JE, Dysken M, Krishnan KR, Burt T, McRae T. A randomized, placebo-controlled study of the efficacy and safety of sertraline in the treatment of the behavioral manifestations of Alzheimer’s disease in outpatients treated with donepezil. International Journal of Geriatric Psychiatry. 2004;19(1):9–18. doi: 10.1002/gps.998. [DOI] [PubMed] [Google Scholar]
- Flavell JH. Cognitive development: Past, present, and future. Developmental Psychology. 1992;28:998–1005. [Google Scholar]
- Forn C, Ripolles P, Cruz-Gomez AJ, Belenguer A, Gonzalez-Torre JA, Avila C. Task-load manipulation in the Symbol Digit Modalities Test: An alternative measure of information processing speed. Brain and Cognition. 2013;82(2):152–160. doi: 10.1016/j.bandc.2013.04.003. [DOI] [PubMed] [Google Scholar]
- Gaudino EA, Chiaravalloti ND, DeLuca J, Diamond BJ. A comparison of memory performance in relapsing-remitting, primary progressive and secondary progressive, multiple sclerosis. Neuropsychiatry, Neuropsychology, and Behavioral Neurology. 2001;14(1):32–44. [PubMed] [Google Scholar]
- Genova HM, Hillary FG, Wylie G, Rypma B, Deluca J. Examination of processing speed deficits in multiple sclerosis using functional magnetic resonance imaging. Journal of the International Neuropsychological Society. 2009;15(3):383–393. doi: 10.1017/S1355617709090535. [DOI] [PubMed] [Google Scholar]
- Gershon RC, Cella D, Fox NA, Havlik RJ, Hendrie HC, Wagster MV. Assessment of neurological and behavioural function: The NIH toolbox. Lancet Neurology. 2010;9(2):138–139. doi: 10.1016/S1474-4422(09)70335-7. [DOI] [PubMed] [Google Scholar]
- Gold JM, Carpenter C, Randolph C, Goldberg TE, Weinberger DR. Auditory working memory and Wisconsin Card Sorting Test performance in schizophrenia. Archives of General Psychiatry. 1997;54(2):159–165. doi: 10.1001/archpsyc.1997.01830140071013. [DOI] [PubMed] [Google Scholar]
- Gronwall D. Paced auditory serial-addition task - Measure of recovery from concussion. Perceptual and Motor Skills. 1977;44(2):367–373. doi: 10.2466/pms.1977.44.2.367. [DOI] [PubMed] [Google Scholar]
- Gronwall D, Wrightson P. Memory and information processing capacity after closed head injury. Journal of Neurology, Neurosurgery, and Psychiatry. 1981;44(10):889–895. doi: 10.1136/jnnp.44.10.889. [DOI] [PMC free article] [PubMed] [Google Scholar]
- Hale S. A global developmental trend in cognitive processing speed. Child Development. 1990;61(3):653–663. [PubMed] [Google Scholar]
- Han SD, Arfanakis K, Fleischman DA, Leurgans SE, Tuminello ER, Edmonds EC, Bennett DA. Functional connectivity variations in mild cognitive impairment: Associations with cognitive function. Journal of the International Neuropsychological Society. 2012;18(1):39–48. doi: 10.1017/S1355617711001299. [DOI] [PMC free article] [PubMed] [Google Scholar]
- Haut MW, Kuwabara H, Leach S, Arias RG. Neural activation during performance of number-letter sequencing. Applied Neuropsychology. 2000;7(4):237–242. doi: 10.1207/S15324826AN0704_5. [DOI] [PubMed] [Google Scholar]
- Hawkins KA. Indicators of brain dysfunction derived from graphic representations of the WAIS-III/WMS-III Technical Manual clinical samples data: A preliminary approach to clinical utility. The Clinical Neuropsychologist. 1998;12(4):535–551. [Google Scholar]
- Hinkley LB, Marco EJ, Findlay AM, Honma S, Jeremy RJ, Strominger Z, Sherr EH. The role of corpus callosum development in functional connectivity and cognitive processing. Public Library of Science One. 2012;7(8):e39804. doi: 10.1371/journal.pone.0039804. [DOI] [PMC free article] [PubMed] [Google Scholar]
- Huttenlocher PR. Synaptic density in human frontal cortex - developmental Developmental changes and effects of aging. Brain Research. 1979;163(2):195–205. doi: 10.1016/0006-8993(79)90349-4. [DOI] [PubMed] [Google Scholar]
- Jensen AR. Reaction times and psychometric g. In: Eysenck H, editor. A model for intelligence. Berlin: Springer-Verlag; 1982. [Google Scholar]
- Jensen AR. Why is reaction time correlated with psychometric g. Current Directions in Psychological Science. 1993;2:53–56. [Google Scholar]
- Kail R. Processing time declines exponentially during childhood and adolescence. Developmental Psychology. 1991;27(2):259–266. [Google Scholar]
- Kail R. Speed of processing in childhood and adolescence: Nature, consequences, and implications for understanding atypical development. In: DeLuca J, Kalmar JH, editors. Information processing speed in clinical populations. New York: Taylor and Francis; 2008. [Google Scholar]
- Kalmar JH, Chiaravalloti ND. Information processing speed in multiple sclerosis: A primary deficit? In: John DeLuca PD, Jessica PD, Kalmar H, editors. Information processing speed in clinical populations. New York: Taylor and Francis; 2008. [Google Scholar]
- Kochunov P, Coyle T, Lancaster J, Robin DA, Hardies J, Kochunov V, Fox PT. Processing speed is correlated with cerebral health markers in the frontal lobes as quantified by neuroimaging. Neuroimage. 2010;49(2):1190–1199. doi: 10.1016/j.neuroimage.2009.09.052. [DOI] [PMC free article] [PubMed] [Google Scholar]
- Leavitt VM, Wylie G, Genova H, Chiaravalloti N, Deluca J. Altered effective connectivity during performance of an information processing speed task in multiple sclerosis. Multiple Sclerosis. 2012;18(4):409–417. doi: 10.1177/1352458511423651. [DOI] [PubMed] [Google Scholar]
- Lengenfelder J, Bryant D, Diamond BJ, Kalmar JH, Moore NB, DeLuca J. Processing speed interacts with working memory efficiency in multiple sclerosis. Archives of Clinical Neuropsychology. 2006;21(3):229–238. doi: 10.1016/j.acn.2005.12.001. [DOI] [PubMed] [Google Scholar]
- Lezak MD. Neuropsychological assessment. 3. New York: Oxford University Press; 1995. [Google Scholar]
- Llorente AM, Miller EN, D’EliaD’Elia LF, Selnes OA, Wesch J, Becker JT, Satz P. Slowed information processing in HIV-1 disease. The Multicenter AIDS Cohort Study (MACS) Journal of Clinical and Experimental Neuropsychology. 1998;20(1):60–72. doi: 10.1076/jcen.20.1.60.1489. [DOI] [PubMed] [Google Scholar]
- Mabbott DJ, Laughlin SN, Rockel M, Bouffet E. Age related changes in DTI measures of white matter and processing speed. Paper presented at the Organization for Human Brain Mapping; Toronto. 2005. [Google Scholar]
- Madigan NK, DeLuca J, Diamond BJ, Tramontano G, Averill A. Speed of information processing in traumatic brain injury: Modality-specific factors. Journal of Head Trauma Rehabilitation. 2000;15(3):943–956. doi: 10.1097/00001199-200006000-00007. [DOI] [PubMed] [Google Scholar]
- Majeres RL. Sex differences in phonetic processing: Speed of identification of alphabetical sequences. Perceptual and Motor Skills. 1997;85(3 Pt 2):1243–1251. doi: 10.2466/pms.1997.85.3f.1243. [DOI] [PubMed] [Google Scholar]
- Majeres RL. Sex differences in phonological processes: Speeded matching and word reading. Memory and Cognition. 1999;27(2):246–253. doi: 10.3758/bf03211409. [DOI] [PubMed] [Google Scholar]
- Martin TA, Donders J, Thompson E. Potential of and problems with new measures of psychometric intelligence after traumatic brain injury. Rehabilitation Psychology. 2000;45(4):402–408. [Google Scholar]
- O’Brien AR, Tulsky D. The history of processing speed and its relationship to intelligence. In: DeLuca J, Kalmar JH, editors. Information processing speed in clinical populations. New York: Taylor and Francis; 2008. [Google Scholar]
- Posthuma D, de Geus E. The genetics of information processing speed in humans. In: DeLuca J, Kalmar JH, editors. Information processing speed in clinical populations. New York: Taylor and Francis; 2008. [Google Scholar]
- Ready RE, Baran B, Chaudhry M, Schatz K, Gordon J, Spencer RM. Apolipoprotein E-e4, processing speed, and white matter volume in a genetically enriched sample of midlife adults. American Journal of Alzheimer’s Disease and Other Dementias. 2011;26(6):463–468. doi: 10.1177/1533317511421921. [DOI] [PMC free article] [PubMed] [Google Scholar]
- Salthouse TA. Speed of behavior and its implications for cognition. In: Birren JE, Schaie KW, editors. Handbook of the psychology of aging. 2. New York: Van Nostrand Reinhold; 1985. pp. 400–426. [Google Scholar]
- Salthouse TA. Cognitive competence and expertise in aging. In: Birren JE, Schaie KW, editors. Handbook of the psychology of aging. 3. San Diego: Academic Press; 1990. pp. 310–319. [Google Scholar]
- Salthouse TA. Speed mediation of adult age-differences in cognition. Developmental Psychology. 1993;29(4):722–738. [Google Scholar]
- Salthouse TA, Babcock RL, Shaw RJ. Effects of adult age on structural and operational capacities in working memory. Psychology and Aging. 1991;6(1):118–127. doi: 10.1037//0882-7974.6.1.118. [DOI] [PubMed] [Google Scholar]
- Salthouse TA, Coon VE. Influence of task-specific processing speed on age differences in memory. Journal of Gerontology. 1993;48(5):P245–P255. doi: 10.1093/geronj/48.5.p245. [DOI] [PubMed] [Google Scholar]
- Sasson E, Doniger GM, Pasternak O, Tarrasch R, Assaf Y. Structural correlates of cognitive domains in normal aging with diffusion tensor imaging. Brain Structure and Function. 2012;217(2):503–515. doi: 10.1007/s00429-011-0344-7. [DOI] [PubMed] [Google Scholar]
- Sawamoto N, Honda M, Hanakawa T, Fukuyama H, Shibasaki H. Cognitive slowing in Parkinson’s Parkinson’s disease: A behavioral evaluation independent of motor slowing. The Journal of Neuroscience. 2002;22(12):5198–5203. doi: 10.1523/JNEUROSCI.22-12-05198.2002. [DOI] [PMC free article] [PubMed] [Google Scholar]
- Schaie KW. Perceptual speed in adulthood: Cross-sectional and longitudinal studies. Psychology and Aging. 1989;4(4):443–453. doi: 10.1037//0882-7974.4.4.443. [DOI] [PubMed] [Google Scholar]
- Schaie KW. The course of adult intellectual development. American Psychologist. 1994;49(4):304–313. doi: 10.1037//0003-066x.49.4.304. [DOI] [PubMed] [Google Scholar]
- Sherman EMS, Strauss E, Spellacy F. Validity of the paced auditory serial addition test (PASAT) in adults referred for neuropsychological assessment after head injury. The Clinical Neuropsychologist. 1997;11(1):34–45. [Google Scholar]
- Siegel LS. Working memory and reading: A life-span perspective. International Journal of Behavioral Development. 1994;17:109–124. [Google Scholar]
- Sliwinski M, Buschke H. Processing speed and memory in aging and dementia. The Journals of Gerontology Series B: Psychological Sciences and Social Sciences. 1997;52(6):308–318. doi: 10.1093/geronb/52b.6.p308. [DOI] [PubMed] [Google Scholar]
- Smith AM, Walker LA, Freedman MS, St Berrigan LI, Pierre J, Hogan MJ, Cameron I. Activation patterns in multiple sclerosis on the Computerized Tests of Information Processing. Journal of Neurological Science. 2012;312(1–2):131–137. doi: 10.1016/j.jns.2011.08.003. [DOI] [PubMed] [Google Scholar]
- Sternberg S. High-speed scanning in human memory. Science. 1966;153(3736):652–654. doi: 10.1126/science.153.3736.652. [DOI] [PubMed] [Google Scholar]
- Strauss E, Sherman EMS, Spreen O. A compendium of neuropsychological tests: Administration, norms, and commentary. 3. New York: Oxford University Press; 2006. [Google Scholar]
- Takeuchi H, Taki Y, Hashizume H, Sassa Y, Nagase T, Nouchi R, Kawashima R. Effects of training of processing speed on neural systems. The Journal of Neuroscience. 2011;31(34):12139–12148. doi: 10.1523/JNEUROSCI.2948-11.2011. [DOI] [PMC free article] [PubMed] [Google Scholar]
- Tiersky LA, Johnson SK, Lange G, Natelson BH, DeLuca J. Neuropsychology of chronic fatigue syndrome: A critical review. Journal of Clinical and Experimental Neuropsychology. 1998;19:560–586. doi: 10.1080/01688639708403744. [DOI] [PubMed] [Google Scholar]
- Tulsky DS, Saklofske DH, Zhu J. Revising a standard: An evaluation of the origin and development of the WAIS-III. In: Tulsky DS, Saklofske DH, Chelune GJ, Heaton RK, Ivnik RJ, Bornstein R, Prifitera A, Ledbetter MF, editors. Clinical interpretation of the WAIS-III and WMS-III. San Diego, CA: Academic Press; 2003. [Google Scholar]
- van Duinkerken E, Klein M, Schoonenboom NS, Hoogma RP, Moll AC, Snoek FJ, Diamant M. Functional brain connectivity and neurocognitive functioning in patients with long-standing type 1 diabetes with and without micro-vascular complications: A magnetoencephalography study. Diabetes. 2009;58(10):2335–2343. doi: 10.2337/db09-0425. [DOI] [PMC free article] [PubMed] [Google Scholar]
- van Duinkerken E, Schoonheim MM, Sanz-Arigita EJ, Ijzerman RG, Moll AC, Snoek FJ, Barkhof F. Resting-state brain networks in type 1 diabetic patients with and without microangiopathy and their relation to cognitive functions and disease variables. Diabetes. 2012;61(7):1814–1821. doi: 10.2337/db11-1358. [DOI] [PMC free article] [PubMed] [Google Scholar]
- Vernon PA. Speed of information processing and general intelligence. Intelligence. 1983;7:53–70. [Google Scholar]
- Vernon PA. Speed of information-processing and intelligence. Norwood, NJ: Ablex; 1987. [Google Scholar]
- Vichinsky EP, Neumayr LD, Gold JI, Weiner MW, Rule RR, Truran D Neuropsychological Dysfunction and Neuroimaging Adult Sickle Cell Anemia Study Group. Neuropsychological dysfunction and neuroimaging abnormalities in neurologically intact adults with sickle cell anemia. The Journal of the American Medical Association. 2010;303(18):1823–1831. doi: 10.1001/jama.2010.562. [DOI] [PMC free article] [PubMed] [Google Scholar]
- Wechsler D. Wechsler Adult Intelligence Scale IV. San Antonio: Harcourt Assessment Inc; 2008. [Google Scholar]
- Weintraub S, Dikmen S, Heaton R, Tulsky DS, Zelazo PD, Slotkin J, Gershon R. The cognition battery of the NIH toolbox for assessment of neurological and behavioral function: Validation in an adult sample. Journal of the International Neuropsychological Society. doi: 10.1017/S1355617714000320. Under Review. [DOI] [PMC free article] [PubMed] [Google Scholar]
- Yakovlev PI, Lecours AR. The myelogenetic cycles of regional maturation of the brain. In: Minkowski A, editor. Regional development of the brain in early life. Oxford: Blackwell; 1967. [Google Scholar]
- Ystad M, Hodneland E, Adolfsdottir S, Haasz J, Lundervold AJ, Eichele T, Lundervold A. Cortico-striatal connectivity and cognition in normal aging: A combined DTI and resting state fMRI study. Neuroimage. 2011;55(1):24–31. doi: 10.1016/j.neuroimage.2010.11.016. [DOI] [PubMed] [Google Scholar]
- Zelazo PD, Anderson JE, Richler J, Wallner-Allen K, Beaumont JL, Conway K, Weintraub S. NIH toolbox cognition battery (CB): Measuring executive function and attention. Journal of the International Neuropsychological Society In Press. [Google Scholar]
- Zimprich D, Martin M. Can longitudinal changes in processing speed explain longitudinal age changes in fluid intelligence? Psychology and Aging. 2002;17(4):690–695. doi: 10.1037/0882-7974.17.4.690. [DOI] [PubMed] [Google Scholar]