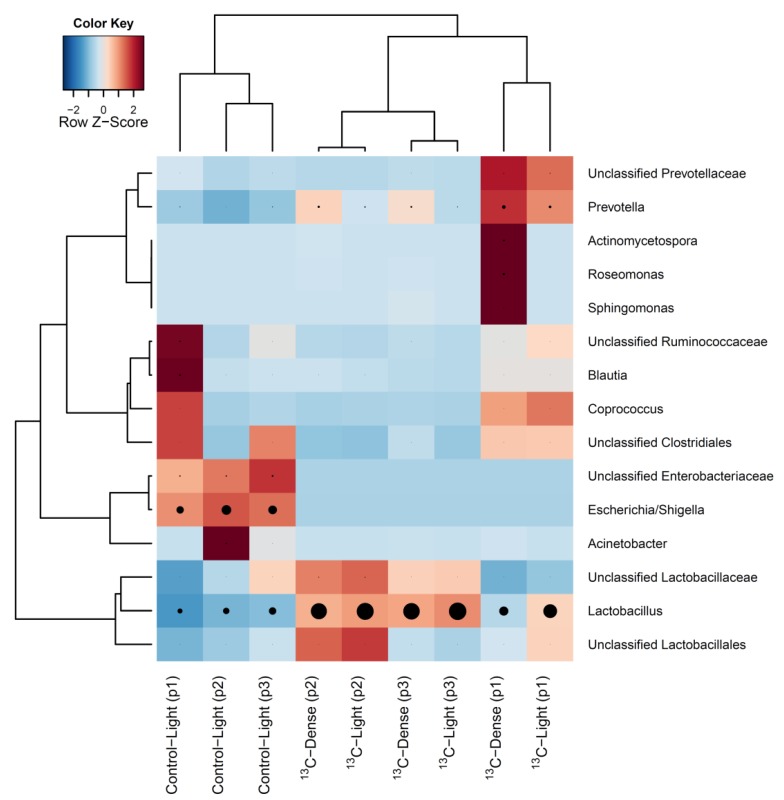
Figure 4.
Heatmap showing hierarchical clustering of bacterial composition profiles of the 15 most relatively abundant taxa in cDNA from RNA-SIP density gradient fractions. Taxa are indicated by row labels and gradient fraction type indicated by column labels; ‘light’ fractions from control culture (Control-Light), ‘light’ fractions from 13C-sialic acid cultures (13C-Light), and ‘dense’ fractions from 13C-sialic acid cultures (13C-Dense). Identification in parentheses indicates the piglet source. Heatmap colour (blue to dark red) signifies the relative prevalence of each taxon across samples and black circles show absolute proportions for each taxa within a sample, with circle size proportional to sequence abundance.

