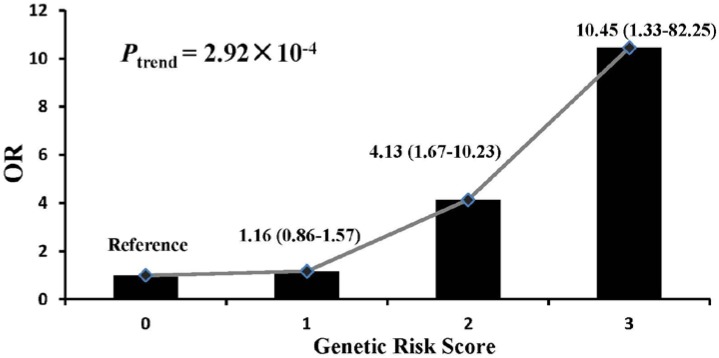
Figure 1.
Cumulative effects of risk CNV loci on obesity. GRS (X-axis) was the sum of the CNV risk alleles of the three positive loci (11q11, 10q11.22, 4q25). Odds ratio (Y-axis) was calculated by logistic regression adjusted for gender and age, using the group with no risk type of the three loci as reference. The Ptrend was calculated by Chi-square trend test.

