

Abstract
In the brain, translocator protein (18 kDa) (TSPO), previously called peripheral benzodiazepine receptor (PBR), is a glial protein that has been extensively used as a biomarker of brain injury and inflammation. However, the functional role of TSPO in glial cells is not well characterized. In this study, we show that the TSPO-specific ligands R-PK11195 (PK) and Ro5-4864 (Ro) increased microglia proliferation and phagocytosis with no effect on migration. Both ligands increased reactive oxygen species (ROS) production, and this effect may be mediated by NADPH-oxidase. PK and Ro also produced a small but detectable increase in IL-1β release. We also examined the effect of PK and Ro on the expression of pro-inflammatory genes and cytokine release in lipopolysaccharide (LPS) and adenosine triphosphate (ATP) activated microglia. PK or Ro had no effect on LPS-induced increase of pro-inflammatory genes, but they both decreased the ATP-induced increase of COX-2 gene expression. Ro, but not PK, enhanced the LPS-induced release of IL-1β. However, Ro decreased the ATP-induced release of IL-1β and TNF-α, and PK decreased the ATP-induced release of TNF-α. Exposure to Ro in the presence of LPS increased the number of apoptotic microglia, an effect that could be blocked by PK. These findings show that TSPO ligands modulate cellular functions consistent with microglia activation. Further, when microglia are activated, these ligands may have therapeutic potential by reducing the expression of pro-inflammatory genes and cytokine release. Finally, Ro-like ligands may be involved in the elimination of activated microglia via apoptosis.
Keywords: Inflammation, injury, biomarker, LPS, ATP, reactive oxygen species, NADPH oxidase
INTRODUCTION
Translocator protein (18 kDa) (TSPO), formerly known as the peripheral benzodiazepine receptor (PBR), is a protein primarily localized in the outer mitochondrial membrane and is present in many peripheral tissues but highly enriched in steroidogenic tissue (Papadopoulos et al., 2006; Papadopoulos and Lecanu, 2009). One of the well-characterized functions of TSPO is the translocation of cholesterol from the cytoplasm into the mitochondria, which is the rate-limiting step in steroidogenesis (Papadopoulos et al., 2006). TSPO has also been suggested to play a role in other cellular functions such as heme biosynthesis, apoptosis, and cell proliferation (Gavish et al., 1999; Papadopoulos et al., 2006; Veenman et al., 2007).
TSPO is also expressed at low levels in the central nervous system (CNS), but its expression is markedly increased upon brain injury and inflammation (Chen and Guilarte, 2008; Papadopoulos and Lecanu, 2009; Veenman and Gavish, 2000). In the brain, TSPO is primarily localized to glial cells (microglia and astrocytes), and it appears to track glial cell activation (Chen and Guilarte, 2008). In vivo human imaging studies have documented increased TSPO levels in activated glia that is specific to affected regions in neurodegenerative and neurological diseases such as Alzheimer’s disease (Cagnin et al., 2001; Versijpt et al., 2003), Parkinson’s disease (Ouchi et al., 2005; Gerhard et al., 2006), ischemic stroke (Gerhard et al., 2000, 2005), multiple sclerosis (Banati et al., 2000; Debruyne et al., 2003), and many others (Chen and Guilarte, 2008). Previous studies have also shown increased TSPO expression in microglia and astrocytes in different animal models of brain injury or inflammation (Guilarte et al., 1995; Kuhlmann and Guilarte, 1997, 1999, 2000; Guilarte et al., 2003; Chen et al., 2004; Chen and Guilarte, 2006). Furthermore, it has been noted (Vowinckel et al., 1997; Banati et al., 2000; Venneti et al., 2004; Chen and Guilarte, 2006) that the upregulation of TSPO in a variety of brain injury and inflammation models is associated with activated microglia suggesting a role of TSPO in the response of microglia during active brain disease (Chen and Guilarte, 2008). While it is now well recognized that TSPO expression is markedly increased as a result of brain injury and inflammation and this phenomenon has been used to assess active brain disease, the functional role of TSPO in microglia is not well characterized.
In the current study, we used the TSPO-specific ligands, (R)-PK11195 (PK) and Ro5-4864 (Ro), to examine the role of TSPO in rat primary microglia. To this end, we assessed the effect of these TSPO-specific ligands on several microglia functions including proliferation, migration, phagocytosis, reactive oxygen (ROS) and nitrogen (RNS) species productions, and cytokine release. In addition, previous studies have suggested a protective effect of TSPO-specific ligands in animal models of brain injury (Giatti et al., 2009; Soustiel et al., 2008; Veenman et al., 2002; Veiga et al., 2007). Thus, we also investigated the effect of TSPO-specific ligands on the immune response of LPS- and ATP-activated microglia and their role in apoptosis. We found that TSPO-specific ligands elicit the activation of cellular functions that are essential for microglia to mount a response to brain injury and inflammation. Further, under activating conditions, PK and Ro modulate the expression of pro-inflammatory genes and the release of cytokines as well as microglia apoptosis. Our findings suggest an essential role of TSPO in microglia.
MATERIALS AND METHODS
Microglia cell culture
Primary mixed glial cell cultures were prepared using a modified version of a glial culture technique as previously described (Giulian and Baker, 1986). Briefly, 10 brains from postnatal day 1-3 Sprague Dawley rat pups (Harlan, Indianapolis, IN) were dissected, and the meninges were carefully removed. Brain tissue was dissociated by trypsination (0.25% trypsin at 37°C for 30 minutes), trituration, and filtration through 40 μm cell strainers (Becton, Dickinson and Company, Franklin Lakes, NJ). Cells were centrifuged at 2,000×g for 10 minutes, resuspended, and plated onto 75 cm2 poly-L-lysine coated culture flasks in Dulbecco’s modified Eagle medium (DMEM)/F12 (Invitrogen, Carlsbad, CA) containing 10% heat-inactivated fetal bovine serum (FBS) (Hyclone, Logan, UT), 100 U penicillin/100 μg of streptomycin (Invitrogen). Cultures were maintained at 37°C in a humidified incubator with 95% air/5% CO2 for 12-14 days when the mixed glial cultures reached confluence. Microglia were then separated from the glial cultures by shaking the flasks for 2 hrs at 200 r.p.m. at 37°C and collected as floating cells in the media. After centrifugation (2000 ×g for 10 minutes), cell viability was determined by trypan blue exclusion, and cells were plated on 96-well plates, 6-well plates, or 60 mm dishes, depending on the assay being tested. Non-adherent cells were removed 20 minutes after plating by changing the culture medium to DMEM/F12 containing 2% FBS. Adherent cells were incubated overnight before being used for experiments. The animal protocol used for this study was reviewed and approved by the Johns Hopkins University Animal Care and Use Committee.
Purity of microglia cultures
A total of 250,000 microglia was plated onto glass coverslip on each well of a 6-well plate. After overnight incubation, cells were fixed with 4% paraformaldehyde (15 minutes at room temperature) and stained with the microglia specific marker, mouse-anti-Mac-1 primary antibody (1:100; Chemicon, Billerica, MA) using standard immunocytochemistry methods. Cells were counterstained with Prolong with DAPI [(4,6-diamidino-2-phenylindole); Invitrogen] to visualize cell nuclei. Fluorescence images were captured using a Nikon Eclipse E600 microscope (Nikon Instruments, Melville, NY). Percent of microglia was determined by counting the number of Mac-1-positive cells and dividing by the total number of DAPI-positive cells (Fig. 1). At least 100 cells were counted per condition per extraction.
FIGURE 1. Fluorescence microscope image showing the purity of primary microglia culture.

After plating, microglia were immunostained with the microglia-specific marker, Mac-1 (seen in green) and counterstained with DAPI (seen in blue). Cell counting showed that 99 ± 0.6% of counted cells are Mac-1 positive, indicating a high degree of purity of the microglia culture. Scale bar, 50 μm.
Treatments
(R)-PK11195 (Advanced Biochemical Compounds, Radeberg, Germany) and Ro5-4864 (Sigma-Aldrich, St. Louis, MO) were dissolved in 100% ethanol at 25 mM and 10 mM stock solutions, respectively. Serial dilutions of the stock solutions using 100% ethanol were done such that 5 μL of ethanol was added to each treatment containing 5 mL of DMEM/F12 medium containing 2% FBS. Microglia were exposed to various concentrations of PK or Ro for 24 hrs before testing specific aspects of microglia function. For the NADPH oxidase inhibitor experiments, microglia were co-exposed to diphenyleneiodonium (DPI) or apocynin with PK or Ro for 24 hours before testing for ROS production described below. For the activation experiments, microglia were exposed to vehicle, PK, or Ro for 1 hr prior to exposure to LPS or ATP (Sigma-Aldrich) with or without PK or Ro for 4 additional hrs before testing for various assays.
Cell viability
Microglia (30,000/well) were plated onto 96-well plates and exposed to TSPO ligands for 24 hrs. Cell viability was determined by measuring lactate dehydrogenase (LDH) release using Promega CytoTox 96® AQueous Non-Radioactive Cytotoxicity Assay according to manufacturer’s instructions (Promega, Madison, WI).
Microglia motility
Motility of cultured microglia in 35-mm culture dish under controlled temperature (37°C) and gas (10% CO2/90% air) and monitored with a time-lapse video microscopy system (O-kumashokai, Fukuoka, Japan). The video camera (Nikon inverted microscope, TE-2000-E) was controlled by Luminavision software (O-kumashokai, Fukuoka, Japan). Cell motility in response to the presence of TSPO ligands and ATP was measured by the total distance traveled in 1 hr. Images were acquired at 1 minute intervals for 1 hr and stored on a computer and analyzed by Dipp-Motion 2D (DITECT, Tokyo, Japan).
Phagocytosis
Microglia phagocytosis was measured using fluorescent polystyrene microbeads (1 μm in diameter; Molecular Probes). A stock solution of 1×10¹⁰ beads/mL was diluted in Hank’s Balanced Salt Solution (HBSS) (Mediatech Inc., Manassas, VA) to generate a solution of 50-100 fluorescent polystyrene beads per cell. A total of 30,000 microglia/well were plated onto a 96-well plate. After exposure to TSPO ligands, medium was aspirated, cells were washed and incubated for 30 minutes at 37°C in HBSS containing the fluorescent polystyrene beads. After incubation and washing, the plate was read at 570 nm excitation and 598 nm emission using the Gemini EM microplate spectrofluorometer (Molecular Devices, Sunnyvale, CA).
Proliferation by bromodeoxyuridine (BrdU) incorporation
Microglia (250,000/well) were plated onto glass coverslip on each well of a 6-well plate. After 24 hrs of exposure to TSPO ligands, 10 μM of BrdU was added to the cells for 45 minutes at 37°C and cells were fixed with 4% paraformaldehyde. Cells were then exposed to 2N of hydrochloric acid (10 minutes at room temperature) to denature the DNA. After three washes in PBS to remove the acid, cells were treated with 0.2% Triton (10 minutes at room temperature) and blocked in PBS containing 10% normal goat serum for 1 hr at room temperature before being incubated with mouse-anti-BrdU primary antibody (1:100; Roche, Indianapolis, IN) overnight at 4°C. After three washes in PBS, cells were incubated with goat-anti-mouse Alexa 488 secondary antibody (1:500; Invitrogen), washed and counterstained with Prolong with DAPI (Invitrogen). Fluorescence images were captured using Nikon Eclipse E600 microscope. For each coverslip, nine or more different fields were captured at random. Proliferation was determined by counting the number of BrdU-positive cells and dividing by the total number of DAPI-positive cells. At least 150 cells were counted per condition per experiment.
Measurement of reactive oxygen species (ROS)
ROS was measured using the 2’,7’-dichlorohydrofluorescein diacetate (H2DCFDA) assay (Molecular Probes, Eugene, OR). Non-fluorescent H2DCFDA readily crosses the cell membranes and gets deacetylated to H2DCF by intracellular esterases. After oxidation by ROS, H2DCF is converted to the highly fluorescent DCF, which is detectable using a fluorescent plate reader. A 2.5 mM stock solution of H2DCFDA was made in dimethyl sulfoxide (DMSO; Sigma-Aldrich) and diluted in HBSS so that the percentage DMSO in solution was less than 1%. A total of 30,000 microglia/well was plated onto a 96-well plate. After exposure to TSPO ligands for 24 hrs, culture medium was removed, and cells were washed in HBSS and incubated for 30 minutes at 37°C in HBSS containing 10 μM H2DCFDA. After incubation, liquid was aspirated, and the cells were washed twice with HBSS. The plate was read at 485 nm excitation and 530 nm emission with a Gemini EM microplate spectrofluorometer (Molecular Devices). For fluorescence imaging, a total of 250,000 microglia was plated onto glass coverslips. After the same exposure protocol as above, cells were fixed in 4% paraformaldehyde (15 minutes at room temperature) and mounted onto slides. Fluorescent images were captured using the Nikon Eclipse E600 microscope.
Measurement of reactive nitrogen species (RNS)
RNS was measured using the 4-amino-5-methylamino-2’,7’-difluorofluorescein (DAF-FM) assay (Invitrogen). DAF-FM readily crosses the cell membranes and is deacetylated by intracellular esterases to 4,5-diaminofluorescein (DAF-2). DAF-2 remains essentially non-fluorescent until it reacts with the nitrosonium cation (produced by spontaneous oxidation of nitric oxide) to form a fluorescent benzotriazole, which is detectable using a fluorescent plate reader. Cells were then incubated for 30 minutes at 37°C in HBSS containing 1 μM DAF-FM. After incubation, liquid was aspirated, and the cells were washed twice with HBSS. The plate was read at 495 nm excitation and 515 nm emission using the Gemini EM microplate spectrofluorometer (Molecular Devices).
Cytokine release profiling using Luminex (Luminex Corp., Austin, TX) and ELISAs
A total of 30,000 primary microglia/well were plated onto 96-well plate. For profiling of cytokine production, 50 μL of the culture medium was collected after exposure to be assayed for 10 different cytokines [granulocyte/macrophage colony-stimulating factor, interleukin (IL)-1α, IL-1β, IL-2, IL-4, IL-6, IL-10, IL-12, interferon-γ, and tumor necrosis factor-α (TNF-α)] using the Cytokine Rat 10-Plex Panel Kit (Invitrogen) according to the manufacturer’s instructions. For activated microglia, 50 μL of the culture medium was collected after exposure to be assayed for IL-1β and TNF-α release using IL-1β and TNF-α ELISA kits respectively (R&D Systems, Minneapolis, MN) according to the manufacturer’s instructions.
Gene expression changes using quantitative real-time polymerase chain reaction (qRT-PCR)
A total of 500,000 primary microglia per treatment was plated on a 60-mm dish. After exposure to TSPO ligands with or without LPS or ATP, total RNA was isolated from each plate using the Qiagen RNeasy Mini Kit (Qiagen, Valencia, CA) according to the manufacturer’s instructions. The quality of RNA was tested using an Agilent Bioanalyzer (Quantum Analytics, Inc., Foster City, CA). 50 ng total RNA was used for reverse transcription using the Sensiscript RT Kit (Qiagen) according to manufacturer’s instructions. The final cDNA product was diluted to a final volume of 100 μL, and 5 μL of cDNA per gene of interest was used for qRT-PCR, which was performed using the Applied Biosystems Real-Time PCR 7000 Sequence Detection System with Taqman® Universal PCR Master Mix, rat TNF-α [GenBank accession no. NM_012675.2 (http://www.ncbi.nlm.nih.gov/Genbank/)], rat IL-1β (GenBank accession no. NM_031512.2), and rat cyclooxygenase-2 (COX-2) (GenBank accession no. NM_017232.3) Taqman primers (all from Applied Biosystems, Foster City, CA). β-actin was used as the internal control for these experiments. qRT-PCR analysis was performed using the ΔΔCt method.
Apoptosis via caspase-3/7 detection
Caspase-3 and -7 activation was detected using the Image-iT™ LIVE Red Caspase Detection Kit (Molecular Probes) according to the manufacturer’s instructions. Briefly, a total of 250,000 primary microglia/well was plated onto glass coverslip on each well of a 6-well plate. After exposure to LPS, a fluorescent inhibitor of caspase-3 and -7 (FLICA) reagent was added to the cells for 1 hr at 37°C. Cells were then counterstained with Hoechst 33342 and fixed before imaging. Fluorescent images were captured using the Nikon Eclipse E600 microscope. For each condition, at least nine different fields were captured, and cells were counted. Apoptosis was assessed by counting the number of non-apoptotic, early apoptotic, and late apoptotic cells. Cells with round nuclei and no caspase-3/7 red fluorescence were considered as non-apoptotic. Cells with round nuclei and caspase-3/7 red fluorescence were considered as early apoptotic, and cells with fragmented or shrunken nuclei and caspase-3/7 red fluorescence were considered as late apoptotic. At least 200 cells were counted per condition per experiment.
Statistical analysis
Values are expressed as mean ± SEM. Each group consisted of at least three independent trials for each concentration studied. A one-way analysis of variance was used to determine treatment effect followed by Student-Newman-Keuls post-hoc analysis. Significance amongst treatments was set at p < 0.05.
RESULTS
Purity of microglia culture
To confirm the purity of the microglia culture, adherent cells on coverslips were immunostained with the microglia-specific marker Mac-1 and counterstained with the nuclear marker DAPI. Based on cell counts of three independent experiments, the cultures were mainly microglia as 99% ± 0.6% of the counted cells were Mac-1 positive. Figure 1 shows a representative image of the Mac-1 positive cells with DAPI.
TSPO-specific ligands are not cytotoxic to microglia
To determine whether PK or Ro was cytotoxic, we exposed primary microglia to 1, 10 and 100 nM concentrations for 24 hours and measured the amount of LDH release after exposure. These doses of PK and Ro were selected because they are relevant to their affinity for TSPO, which is in the low nM range (Le Fur et al., 1983). Neither PK nor Ro had a significant effect on LDH release relative to vehicle-treated microglia indicating that these ligands are not cytotoxic to microglia at the concentrations tested (Supp. Fig. 1).
TSPO-specific ligands modulate microglia function
Motility
Using time-lapse video microscopy, we show that neither PK nor Ro had an effect on microglia motility compared to control (Fig. 2A). On the other hand, 1 mM ATP, used as a positive control, produced a robust increase in microglia motility (Fig. 2A).
FIGURE 2. TSPO-specific ligands modulate microglia functions.
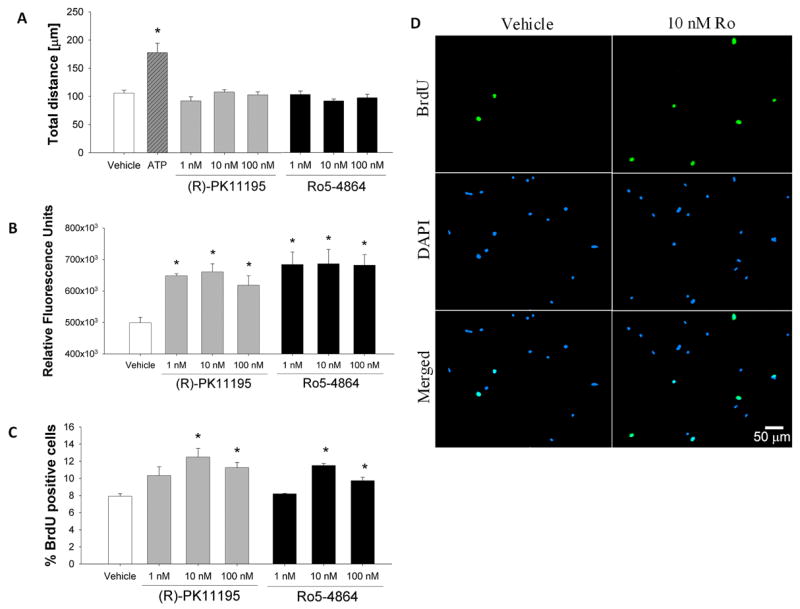
(A) Using time-lapse video microscopy, neither PK (F3,78=1.510; p=0.2184) nor Ro (F3,66=1.408; p=0.2482) had a significant effect on microglia motility. ATP (1 mM) was used as a positive control and produced the expected increase in microglia motility. (B) Phagocytosis was measured by the internalization of fluorescent polystyrene microbeads. Both PK (F3,8=10.91; p=0.0034) and Ro (F3,8=6.749; p=0.0139) were capable of inducing phagocytic activity of microglia at all concentrations tested. (C) Microglia proliferation was assessed via BrdU incorporation. A significant increase in proliferation was observed at both 10 and 100 nM PK (F3,8=5.951; p=0.0196) or Ro (F3,8=27.78; p=0.0001). (D) Representative images of vehicle- and 10 nM Ro- treated microglia showing BrdU incorporation (seen in green) into the nuclei (as stained by DAPI seen in blue). Data is shown as mean ± SEM of three independent experiments. Scale bar, 50 μm. * p < 0.05 compared to vehicle-treated microglia.
Phagocytic activity
We next examined the effects of TSPO-specific ligands on microglia phagocytic activity. Figure 2B shows that following a 24 hr exposure to PK or Ro, microglia exhibited an increased rate of phagocytosis at all concentrations tested. The relative mean increase in microglia phagocytic activity when exposed to PK was 29.9, 32.4 and 23.9% relative to vehicle control at 1, 10 and 100 nM concentrations, respectively. For Ro, the mean increase in microglia phagocytic activity relative to vehicle control was 37.2, 37.6 and 36.7% for 1, 10 and 100 nm concentrations, respectively.
Proliferation
The effect of TSPO ligands on proliferation of primary microglia was assessed using BrdU incorporation. Proliferation was measured by counting the number of BrdU positive cells divided by the total number of cells stained by DAPI. A 24 h exposure to 10 nM PK (54.3%) or Ro (42.0%) produced a maximal increase in microglial proliferation, although a significant but smaller response was also observed at 100 nM of PK (36.6%) or Ro (20.2%) (Fig. 2C). Representative images of proliferation of vehicle-treated microglia and 10 nM Ro-treated microglia are shown in Figure 2D.
ROS and RNS production
To study whether PK or Ro can modulate ROS and RNS production, microglia were exposed to either ligand for 24 hrs before testing for intracellular levels of ROS or RNS. Both PK and Ro at all concentrations tested produced a robust increase in ROS production ranging from 19.6 to 28.9% increase relative to vehicle control (Fig. 3A). Fluorescent image of increased ROS production of microglia exposed to 1 nM Ro compared to vehicle is shown in Figure 3B.
FIGURE 3. TSPO-specific ligands increase NADPH-oxidase dependent ROS production.

Microglia were exposed to PK and Ro for 24 h before measuring intracellular ROS production using H2DCFDA. (A) PK (F3,8=5.093; p=0.0292) and Ro (F3,8=4.418; p=0.0413) both enhanced ROS production at all concentrations tested. (B) Fluorescent images of DCF in vehicle-treated and 1 nM Ro-treated microglia. Scale bar, 50 μm. (C) Microglia were co-exposed to 10 nM PK or Ro with diphenyleneiodonium (DPI; 1 μM) or apocynin (1 mM), two NADPH-oxidase inhibitors. LPS (100 ng/mL) and ATP (1 mM) were used as positive controls. ROS production generated by PK (F5,16=4.587; p=0.0087) and Ro (F5,15=10.75; p=0.0002) was abrogated by both DPI and apocynin. Data is shown as mean ± SEM of three independent experiments. * p < 0.05 compared to vehicle-treated microglia. # p <0.05 compared to no inhibitor-treated microglia.
To investigate the potential source of intracellular ROS production, and because microglia express high levels of NADPH-oxidase, we used inhibitors to this enzyme to examine if the TSPO-ligand induced increase in ROS levels depended upon NADPH oxidase activation. For these studies, we co-exposed 10 nM PK or Ro with NADPH oxidase inhibitors that have different mechanisms of action, diphenyleneiodonium (DPI; 1 μM) and apocynin (1 mM). We also used LPS (100 ng/mL) and ATP (1 mM) as positive controls. The data shows that the increased ROS production induced by PK and Ro is significantly attenuated by both apocynin and DPI (Fig. 3C) suggestive of an involvement of NADPH oxidase. Lastly, PK or Ro had no effect on RNS production following 24 h of exposure (data not shown).
Cytokine release
An important function of microglia is the production and release of cytokines (Aloisi, 2001; Tambuyzer et al., 2009). Previous studies have suggested that ROS is a signaling molecule that regulates cytokine production and release (Jekabsone et al., 2006; Mander et al., 2006). We measured the levels of various cytokines (GM-CSF, IL-1α, IL-1β, IL-2, IL-4, IL-6, IL-10, IL-12, IFN-γ, and TNF-α) using a Cytokine Rat 10-Plex Panel. As anticipated, exposure to LPS (100 ng/mL) resulted in a highly significant increase in the levels of IL-1α, IL-1β, IL-6, IL-12, and TNF-α (Table 1). On the other hand, a 24 h exposure to PK or Ro, produces a small but detectable levels of IL-1β (Table 1). No detectable levels were measured for any of the other cytokines.
TABLE 1.
Effect of TSPO-specific ligands on cytokine release using a rat cytokine-plex panel 1
| IL-1β [pg/mL] | IL-1α [pg/mL] | IL-6 [pg/mL] | IL-12 [pg/mL] | TNF-α [pg/mL] | |
|---|---|---|---|---|---|
|
| |||||
| Vehicle | ND 2 | ND | ND | ND | ND |
| LPS (positive control) | 181.3 ± 64.06 3 | 210.64 ± 72.61 | 48.56 ± 7.84 | 48.79 ± 10.99 | 110.58 ± 24.63 |
| PK 1 nM | 2.92 ± 0.32 | ND | ND | ND | ND |
| PK 10 nM | 2.54 ± 1.12 | ND | ND | ND | ND |
| PK 100 nM | 1.80 ± 0.29 | ND | ND | ND | ND |
| Ro 1 nM | 1.62 ± 1.18 | ND | ND | ND | ND |
| Ro 10 nM | 2.39 ± 0.60 | ND | ND | ND | ND |
| Ro 100 nM | 3.26 ± 1.06 | ND | ND | ND | ND |
IL-2, IL-4, IL-10, IFN-γ, GM-CSF were non-detectable amongst all treatments including LPS.
ND: Non-detectable
Each value is the mean ± SEM of three independent experiments.
Effects of TSPO ligands on the expression of pro-inflammatory genes and cytokine release in activated microglia are dependent on the type of activation
Expression of pro-inflammatory genes
An increasing number of studies suggest that both PK and Ro may have therapeutic potential in animal models of brain injury and inflammation (Mills et al. 2005, 2008; Ryu et al., 2005; Soustiel et al., 2008; Veenman et al., 2002; Veiga et al., 2007). To further examine this question, we assessed the effects of PK or Ro on activated microglia using two different activators of microglia that act via different mechanisms. As described in the methods, we activated microglia using LPS and ATP. LPS is a bacterial toxin that acts through toll-like receptor 4 (TLR4) (Akira and Takeda, 2004) and ATP acts via purinergic receptors (Haynes et al., 2006). In the case of ATP, it is known that injured neurons release significant amounts of ATP that signal microglia to migrate to the site of injury (Haynes et al., 2006). For these studies, we pretreated microglia with 10 nM PK or Ro for 1 hr and exposed microglia to either LPS (100 ng/mL) or ATP (1 mM) with PK or Ro (10 nM) for an additional 4 hrs. Following exposure to these different treatments, TNF-α, IL-1β, and COX-2 gene expressions were measured using quantitative real-time polymerase chain reaction (qRT-PCR). We found that PK or Ro alone did not affect the gene expression of these pro-inflammatory genes relative to vehicle-control. In the presence of LPS, microglia dramatically increased the expression of all three genes and co-exposure with PK or Ro did not alter the increased expression of these pro-inflammatory genes by LPS (Fig. 4). On the other hand, in ATP-activated microglia, we observed increased gene expression of the three markers, but in this case co-exposure with either PK or Ro decreased the ATP-induced increase in COX-2 gene expression relative to ATP-treated alone (Fig. 4). No effects were measured for TNF-α and IL-1β. This indicates that while TSPO-specific ligands do not affect the expression of these genes on their own, nor do they alter the increases of pro-inflammatory markers by LPS, they were able to decrease COX-2 gene expression in ATP-activated microglia.
FIGURE 4. TSPO-specific ligands modulate COX-2 gene expression induced by ATP.

Microglia were pretreated with 10 nM PK or Ro for 1 h before co-exposing with and withour LPS (100 ng/mL) or ATP (1 mM) for an additional 4 hours. Gene expression of COX-2, TNF-α, and IL-1β were determined using quantitative real-time PCR. Neither PK nor Ro had an effect on the gene expression of the three pro-inflammatory genes (COX-2: F2,8= 0.52, p= 0.61; TNF-α: F2,9= 0.25, p= 0.78; IL-1β: F2,7= 3.6, p= 0.084). LPS increased the expression of all three pro-inflammatory genes (COX-2: F3,9= 11.0, p < 0.002; TNF-α: F3,12= 31.2, p < 0.0001; IL-1β: F3,9= 40.8, p < 0.0001), but PK or Ro had no effect on LPS-induced increase of COX-2, TNF-α, and IL-1β expression. ATP also increased the gene expression of COX-2, TNF-α, and IL-1β (COX-2: F3,12= 30.2, p < 0.0001; TNF-α: F3,14= 75.6, p < 0.0001; IL-1β: F3,12= 20.1, p < 0.0001). However, in this case, both PK and Ro decreased the ATP-induced increase of COX-2 gene expression. Data is shown as the mean of the ratio to vehicle ± SEM of at least three independent experiments. * p < 0.05 compared to vehicle-treated microglia. # p < 0.05 compared to ATP-activated microglia.
Release of inflammatory cytokines
We next examined the effects of TSPO-specific ligands on the release of two pro-inflammatory cytokines, TNF-α and IL-1β. With LPS, microglia dramatically increased the release of both TNF-α and IL-1β relative to vehicle-control. Co-exposure of 10 nM PK or Ro with LPS did not alter TNF-α release. However, co-exposure of 10 nM Ro and LPS significantly increased the release of IL-1β relative to LPS-treated alone (Fig. 5). ATP also increased the release of both cytokines and co-exposure of PK with ATP decreased the TNF-α release compared to ATP alone, and co-exposure of Ro and ATP decreased both TNF-α and IL-1β releases (Fig. 5). Taken together, these findings suggest that the interaction of PK or Ro with TSPO can decrease the expression of pro-inflammatory genes and cytokine release by microglia when the activating agent is ATP, a chemical that is known to be released from injured neurons and signals microglia to the site of damage (Haynes et al., 2006; Skaper et al., 2010). On the other hand, these TSPO ligands, at the concentrations tested, were not effective in reducing the expression of pro-inflammatory genes or cytokine release when LPS was used to activate microglia. On the contrary, Ro stimulated IL-1β release in the presence of LPS relative to LPS alone (Fig. 5).
FIGURE 5. TSPO-specific ligands differentially modulate cytokine release induced by LPS and ATP.

Neither 10 nM PK nor Ro had an effect on the release of TNF-α or IL-1β compared to vehicle-treated microglia (IL-1β: F2,6=0.1306; p=0.8800). Exposure to LPS (100 ng/mL) increased the release of both cytokines. While PK and Ro had no effect on the LPS-induced release of TNF-α, Ro but not PK significantly increased the LPS-induced release of IL-1β relative to LPS alone. Exposure to ATP (1 mM) also increased the release of both TNF-α and IL-1β but to a lower extent than LPS. Both PK and Ro decreased the ATP-induced release of TNF-α. Furthermore, Ro but not PK decreased the ATP-induced release of IL-1β. Data is expressed as mean ± SEM of at least three independent experiments. ND = non detectable. * p < 0.05 compared to vehicle-treated microglia. & p < 0.05 compared to LPS-activated microglia. # p < 0.05 compared to ATP-activated microglia.
TSPO ligands modulate apoptosis of LPS-activated microglia
TSPO has been suggested to play a role in apoptosis (Hirsch et al., 1998; Veenman et al., 2007). Therefore, we examined the effects of PK or Ro on microglia apoptosis induced by exposure to LPS. Microglia were pre-treated with vehicle, 10 nM PK, or 10 nM Ro for 1 hr before being exposed to LPS (100 ng/mL) and the same concentrations of TSPO ligands for an additional 4 hrs. Apoptosis was measured via a method that detects active caspase-3/7 and by observing nuclear fragmentation (Fig. 6A). We categorized microglia under three distinct groupings: 1) normal, non-apoptotic- defined as lacking expression of the red fluorescence indicative of activated caspase-3/7 in the cytoplasm and having a normal, large nucleus, 2) early apoptotic-defined as expressing cytoplasmic red fluorescence indicative of activated caspase-3/7 and having a normal, large nucleus, and 3) late apoptotic-defined as expressing the red fluorescence indicative of activated caspase-3/7 in the cytoplasm and having a fragmented and/or shrunken nucleus. We found that exposure of microglia to 10 nM PK, 10 nM Ro or LPS alone did not significantly change the number of early or late apoptotic microglia in the total 5 hr period of exposure (Fig. 6B). However, co-exposure of 10 nM Ro and LPS significantly increased the number of late apoptotic cells compared to all of the treatments (Fig. 6B). Importantly, the presence of 10 nM PK blocked the Ro- LPS increase in the number of late apoptotic cells, suggesting an antagonistic effect of PK. Representative images of the treatments are shown in Figure 6C.
FIGURE 6. Effect of TSPO ligands on LPS-induced microglia apoptosis.

Microglia were pretreated with 10 nM PK or Ro for 1 hour before co-exposing to 10 nM PK or Ro and LPS (100 ng/mL) for an additional 4 hours. Apoptosis was assessed by the detection of caspase-3/7 and nuclear morphology. (A) Images of vehicle-treated microglia and 10 nM Ro with LPS treated microglia. Microglia with no caspase-3/7 with rounded nuclei are considered as non-apoptotic. Microglia with caspase-3/7 red fluorescence in the cytoplasm and rounded nuclei are considered as early apoptotic, and microglia with caspase-3/7 red fluorescence and with shrunken or fragmented nuclei are considered as late apoptotic. (B) Ro co-exposed with LPS resulted in an increase of late apoptotic microglia (F7,19=6.895; p=0.0004). Importantly, PK reduced the number of Ro-LPS-induced late apoptotic microglia. Data is shown as mean ± SEM of three independent experiments. (C) Fluorescent images of microglia stained with Hoechst (seen in blue) and caspase-3/7 (seen in red). # p < 0.05 compared to all treatments for non-apoptotic microglia. * p < 0.05 compared to all treatments for late-apoptotic microglia. Scale bar, 50 μm.
It should be noted that exposure of LPS-activated microglia to 10 nM Ro was the only condition that increased the number of apoptotic microglia (Fig. 6B). This is the same treatment combination that also produced a significant increase in IL-1β release relative to the LPS-alone condition (Fig. 5). The combined data suggests that the increase in the number of apoptotic microglia by Ro co-exposed with LPS may be mediated by IL-1β release. This is consistent with studies showing that LPS activation of microglia increased IL-1β release and microglia apoptosis (Lawrence et al., 1998; Nesic et al., 2001).
DISCUSSION
We used the TSPO specific ligands PK11195 (PK) and Ro5-4864 (Ro), to examine their effect on microglia function. We show for the first time that both PK and Ro at concentrations consistent with their affinities for TSPO (in the nM range) are able to increase the ability of microglia to proliferate and phagocytize with no effect on microglia motility. Further, both ligands increased intracellular ROS production and produced a small but detectable increase in the release of the pro-inflammatory cytokine IL-1β. We also show that the increase in intracellular ROS produced by microglia following TSPO ligand exposure may be mediated through the activation of NADPH oxidase, an enzyme that is enriched in microglia. This is based on the fact that two NADPH oxidase inhibitors (DPI and apocynin) inhibited PK- and Ro-induced ROS production (Fig. 2C). DPI is a very potent inhibitor of NADPH oxidase and directly inhibits the catalytic activity of the enzyme (Irani et al., 1997; Nathan and Shiloh, 2000) while apocynin inhibits NADPH oxidase by preventing the assembly of the active NADPH oxidase complex (Stolk et al., 1994). We should note, however, that there is evidence that DPI and to a lesser extent apocynin are not selective inhibitors of NADPH oxidase (Aldieri et al., 2008; Li and Trush, 1998). It has been shown that DPI at concentrations that inhibits NADPH oxidase also inhibits the production of superoxide by mitochondrial respiration by inhibiting NADH-ubiquinone oxireductase (complex I) (Li and Trush, 1998). Thus, it is possible that the increased production of ROS by these two TSPO-specific ligands may not only be from NADPH oxidase but also from mitochondria. Studies have suggested that activation of TSPO can lead to increased ROS production by mitochondria via modulation of the proton pump provided by the FO unit of ATP(synth)ase (Veenman et al., 2008, 2010; Zeno et al., 2009). Nevertheless, our present results on the ability of TSPO ligands to induce ROS production is consistent with a growing literature indicating that TSPO ligands increase ROS production in microglia and other cell types (Jayakumar et al., 2002).
TSPO is a mitochondrial membrane protein thought to form a multimeric complex with voltage-dependent anion channel and adenine nucleotide transporter of the mitochondrial permeability transition pore (MPTP) (McEnery et al., 1992; Papadopoulos et al., 2006; Papadopoulos and Lecanu, 2009; Chen and Guilarte, 2008). Currently, it is unclear exactly how PK or Ro binding to TSPO triggers cellular responses consistent with the activation of microglia. A previous study has shown that increased TSPO levels can be modulated by a phosphatidylinositol-3 kinase (PI3K) dependent mechanism since LY29002, a PI3K inhibitor, was able to decrease the number of TSPO binding sites in LPS-activated macrophages (Venneti et al., 2007). Another possibility is that ligand binding to TSPO may modulate calcium release by MPTP opening (Azarashvili et al., 2007; Ostuni et al., 2007), which can result in the activation of calcium-dependent protein kinase C (PKC) (Nishizuka, 1984). Activation of either PI3K or PKC has been implicated in the signaling cascade associated with the proliferative (Zassler et al., 2003; Suh et al., 2005) and phagocytic activities of macrophages and microglia (Makranz et al., 2004; Cohen et al., 2006; Rotshenker et al., 2008). Therefore, it is possible that some of the effects of TSPOs ligands on microglia may be mediated by the activation of PI3K or PKC. Consistent with this view, PI3K has been suggested to be involved in the regulation of the assembly and activation of NADPH oxidase (Vignais, 2002). PI3K activation results in the production of phosphatidylinositol-3,4,5-triphosphate (PIP3), which can bind to p40Phox, a cytosolic protein involved in the regulation of NADPH oxidase activation. PIP3 can also activate certain PKC isoforms that can phosphorylate the p47Phox and promote the interaction with p22Phox for NADPH oxidase assembly (Rommel et al., 2007). Therefore, it appears that there might be a putative link between TSPO, PI3K and PKC that might drive the activation of NADPH oxidase and subsequent ROS production in microglia. Because microglia activation has been associated with the assembly and activation of NADPH-oxidase and the production of reactive oxygen species (Block, 2008; Brown, 2007; Brown and Neher, 2010; Sorce and Krause, 2009), it may be possible that TSPO may play a role in activating NADPH-oxidase to generate ROS, and this may serve as a signal for microglia to produce and release pro-inflammatory cytokines, especially IL-1β (Jekabsone et al., 2006; Mander et al., 2006).
Recently, several studies have suggested that PK and Ro may have therapeutic effects in animal models of brain injury and inflammation. For example, Ro has been shown to protect against experimental diabetic neuropathy (Giatti et al., 2009), peripheral nerve injury (Mills et al. 2005, 2008), and an experimental model of cortical injury (Soustiel et al., 2008). Other studies have shown that PK has protective effects against LPS-induced neuroinflammation by reducing microglia activation (Veiga et al., 2007) and quinolinic acid-induced striatal injury (Ryu et al., 2005). In human microglia, PK can reduce COX-2 and TNF-α gene and protein expression induced by LPS and platelet activating factor (Choi et al., 2002; Hong et al., 2006) although these studies used PK concentrations in the high μM range and the effects may be TSPO independent. In the present study, we show that microglia exposed to PK or Ro (10 nM) before and during LPS and ATP can modulate the inflammatory response generated by these two different forms of activating microglia. Our results indicate that the effects of these ligands on the microglia inflammatory response were dependent on the type of inducer used. When microglia were activated with LPS, neither PK nor Ro had an effect on the LPS-induced increase of TNF-α, IL-1β, or COX-2 gene expressions. However, when microglia were activated with ATP, both PK and Ro decreased the ATP-induced increase of COX-2 gene expression. Furthermore, Ro but not PK enhanced the LPS-induced release of IL-1β. Ro also decreased the ATP-induced release of IL-1β and TNF-α. PK decreased the ATP-induced release of TNF-α. LPS and ATP are known to elicit a pro-inflammatory response in microglia, but these two compounds activate microglia in different ways. LPS is a commonly used agent to trigger a pro-inflammatory response in microglia (Block et al., 2007). It is derived from the outer membranes of Gram-negative bacteria and triggers an inflammatory response by binding to toll-like receptor 4 (TLR4), subsequently leading to the activation of the IKK complex, degradation of IκB, and activation of the NF-κB pathway (Akira and Takeda, 2004). On the other hand, ATP is a chemical signal released by injured neurons and can be detected by microglia via P2X and P2Y purinergic receptors (Haynes et al., 2006; Skaper et al., 2010). During neuronal injury, neurons can release ATP and microglia rapidly respond to ATP via chemotaxis and binding to purinergic receptors such as P2X7, which results in the opening of channels permeable to Na+, K+, and Ca2+. Subsequently, P2X7 receptor activation can lead to activation of phospholipases A2 and D and mitogen-activated protein (MAP) kinases, which can influence the transcriptional activities of not only NF-κB but also CREB and AP-1 (Skaper et al., 2010). Thus, it appears that there are significant differences on the potential therapeutic effects of PK and Ro depending upon the type of microglia activation.
This novel observation suggests that under conditions of inflammation, Ro or Ro-like endogenous TSPO ligands might further drive the pro-inflammatory response since microglia in the presence of LPS and Ro increase IL-1β release relative to LPS alone. However, during brain injury that targets neuronal death, Ro may elicit a neuroprotective effect by decreasing COX-2 gene expression and inhibiting the microglia release of TNF-α and IL-1β. Our findings are consistent with studies showing neuroprotective effects of Ro in injury that involves neuronal death (Mills et al., 2005, 2008; Soustiel et al., 2008).
Finally, we assessed the effect of TSPO ligands on apoptosis because TSPO has been suggested to be involved in this form of cell death (Papadopoulos et al., 2006; Veenman et al., 2007). We show that 10 nM Ro co-exposed with LPS enhanced the number of late apoptotic microglia compared to LPS-activated microglia alone. While 10 nM PK did not have an effect on LPS-induced microglia apoptosis, PK was able to antagonize the pro-apoptotic effect of Ro with LPS (Fig 6). From a cellular and pharmacological perspective, these two ligands bind to different sites on TSPO, and it has been claimed that Ro is a TSPO agonist while PK is a TSPO antagonist (Le Fur et al., 1983). Thus, it is possible that upon an inflammatory stimulus such as with LPS, endogenous ligands that may have similar properties as Ro may be involved in the elimination of activated microglia from the injured brain by inducing microglia apoptosis.
In summary, PK and Ro interaction with TSPO appears to signal microglia to become activated by increasing their phagocytic and proliferative activities, and by increasing the production of ROS, that results in a small but detectable level of IL-1β release. When microglia are activated, these TSPO-specific ligands exert different effects on pro-inflammatory genes and cytokine release depending on the type of activation. Our findings suggest that TSPO-specific ligands may have neuroprotective potential, and they may be involved in the removal of activated microglia from the injured brain via apoptotic mechanisms.
Supplementary Material
Acknowledgments
This work is in partial fulfillment of doctoral degree requirements for J. Choi. She is supported by NIEHS T32 ES07141 training grant. This work is funded by NIEHS grant number ES007062 to TRG.
References
- Akira S, Takeda K. Toll-like receptor signalling. Nat Rev Immunol. 2004;4(7):499–511. doi: 10.1038/nri1391. [DOI] [PubMed] [Google Scholar]
- Aldieri E, Riganti C, Polimeni M, Gazzano E, Lussiana C, Campia I, Ghigo D. Classical inhibitors of NOX NAD(P)H oxidases are not specific. Curr Drug Metab. 2008;9:686–696. doi: 10.2174/138920008786049285. [DOI] [PubMed] [Google Scholar]
- Aloisi F. Immune function of microglia. Glia. 2001;36(2):165–179. doi: 10.1002/glia.1106. [DOI] [PubMed] [Google Scholar]
- Azarashvili T, Grachev D, Krestinina O, Evtodienko Y, Yurkov I, Papadopoulos V, Reiser G. The peripheral-type benzodiazepine receptor is involved in control of Ca2+-induced permeability transition pore opening in rat brain mitochondria. Cell Calcium. 2007;42(1):27–39. doi: 10.1016/j.ceca.2006.11.004. [DOI] [PubMed] [Google Scholar]
- Banati RB, Newcombe J, Gunn RN, Cagnin A, Turkheimer F, Heppner F, Price G, Wegner F, Giovannoni G, Miller DH, et al. The peripheral benzodiazepine binding site in the brain in multiple sclerosis: Quantitative in vivo imaging of microglia as a measure of disease activity. Brain. 2000;123(11):2321–2337. doi: 10.1093/brain/123.11.2321. [DOI] [PubMed] [Google Scholar]
- Block ML, Zecca L, Hong JS. Microglia-mediated neurotoxicity: uncovering the molecular mechanisms. Nat Rev Neurosci. 2007;8:57–69. doi: 10.1038/nrn2038. [DOI] [PubMed] [Google Scholar]
- Block ML. NADPH oxidase as a therapeutic target in Alzheimer’s disease. BMC Neuroscience. 2008;9(Suppl 2):S8. doi: 10.1186/1471-2202-9-S2-S8. [DOI] [PMC free article] [PubMed] [Google Scholar]
- Brown GC. Mechanisms of inflammatory neurodegeneration: iNOS and NADPH oxidase. Biochem Soc Trans. 2007;35(5):1119–1121. doi: 10.1042/BST0351119. [DOI] [PubMed] [Google Scholar]
- Brown GC, Neher JJ. Inflammatory neurodegeneration and mechanisms of microglial killing of neurons. Mol Neurobiol. 2010;41(2-3):242–247. doi: 10.1007/s12035-010-8105-9. [DOI] [PubMed] [Google Scholar]
- Cagnin A, Brooks DJ, Kennedy AM, Gunn RN, Myers R, Turkheimer FE, Jones T, Banati RB. In-vivo measurement of activated microglia in dementia. Lancet. 2001;358(9280):461–467. doi: 10.1016/S0140-6736(01)05625-2. [DOI] [PubMed] [Google Scholar]
- Chen M-K, Baidoo K, Verina T, Guilarte TR. Peripheral benzodiazepine receptor imaging in CNS demyelination: functional implications of anatomical and cellular localization. Brain. 2004;127(6):1379–1392. doi: 10.1093/brain/awh161. [DOI] [PubMed] [Google Scholar]
- Chen M-K, Guilarte TR. Imaging the peripheral benzodiazepine receptor response in central nervous system demyelination and remyelination. Toxicol Sci. 2006;91(2):532–539. doi: 10.1093/toxsci/kfj172. [DOI] [PubMed] [Google Scholar]
- Chen M-K, Guilarte TR. Translocator protein 18 kDa (TSPO): Molecular sensor of brain injury and repair. Pharmacol Ther. 2008;118(1):1–17. doi: 10.1016/j.pharmthera.2007.12.004. [DOI] [PMC free article] [PubMed] [Google Scholar]
- Choi HB, Khoo C, Ryu JK, van Breemen E, Kim SU, McLarnon JG. Inhibition of lipopolysaccharide-induced cyclooxygenase-2, tumor necrosis factor-α and [Ca2+]i responses in human microglia by peripheral benzodiazepine receptor ligand PK11195. J Neurochem. 2002;83:546–555. doi: 10.1046/j.1471-4159.2002.01122.x. [DOI] [PubMed] [Google Scholar]
- Cohen G, Makranz C, Spira M, Kodama T, Reichert F, Rotshenker S. Non-PKC DAG/Phorbol-Ester receptor(s) inhibit complement receptor-3 and nPKC inhibit scavenger receptor-AI/II-mediated myelin phagocytosis but cPKC, PI3k, and PLCγ activate myelin phagocytosis by both. Glia. 2006;53(5):538–550. doi: 10.1002/glia.20304. [DOI] [PubMed] [Google Scholar]
- Debruyne JC, Versijpt J, Van Laere KJ, De Vos F, Keppens J, Strijckmans K, Achten E, Slegers G, Dierckx RA, Korf J, De Reuck JL. PET visualization of microglia in multiple sclerosis patients using [11C]PK11195. Eur J Neurol. 2003;10(3):257–264. doi: 10.1046/j.1468-1331.2003.00571.x. [DOI] [PubMed] [Google Scholar]
- Gavish M, Bachman I, Shoukrun R, Katz Y, Veenman L, Weisinger G, Weizman A. Enigma of the peripheral benzodiazepine receptor. Pharmacol Rev. 1999;51(4):629–650. [PubMed] [Google Scholar]
- Gerhard A, Neumaier B, Elitok E, Glatting G, Ries V, Tomczak R, Ludolph AC, Reske SN. In vivo imaging of activated microglia using [11C]PK11195 and positron emission tomography in patients after ischemic stroke. Neuroreport. 2000;11(13):2957–2960. doi: 10.1097/00001756-200009110-00025. [DOI] [PubMed] [Google Scholar]
- Gerhard A, Schwarz J, Myers R, Wise R, Banati RB. Evolution of microglial activation in patients after ischemic stroke: a [11C](R)-PK11195 PET study. NeuroImage. 2005;24(2):591–595. doi: 10.1016/j.neuroimage.2004.09.034. [DOI] [PubMed] [Google Scholar]
- Gerhard A, Pavese N, Hotton G, Turkheimer F, Es M, Hammers A, Eggert K, Oertel W, Banati RB, Brooks DJ. In vivo imaging of microglial activation with [11C](R)-PK11195 PET in idiopathic Parkinson’s disease. Neurobiol Dis. 2006;21(2):404–412. doi: 10.1016/j.nbd.2005.08.002. [DOI] [PubMed] [Google Scholar]
- Giatti S, Pesaresi M, Cavaletti G, Bianchi R, Carozzi V, Lombardi R, Maschi O, Lauria G, Garcia-Segura LM, Caruso D, Melcangi RC. Neuroprotective effects of a ligand of translocator protein-18kDa (Ro5-4864) in experimental diabetic neuropathy. Neuroscience. 2009;164(2):520–529. doi: 10.1016/j.neuroscience.2009.08.005. [DOI] [PubMed] [Google Scholar]
- Giulian D, Baker TJ. Characterization of ameboid microglia isolated from developing mammalian brain. J Neurosci. 1986;6(8):2163–2178. doi: 10.1523/JNEUROSCI.06-08-02163.1986. [DOI] [PMC free article] [PubMed] [Google Scholar]
- Guilarte TR, Kuhlmann AC, O’Callaghan JP, Miceli RC. Enhanced expression of peripheral benzodiazepine receptors in trimethyltin-exposed rat brain: a biomarker of neurotoxicity. Neurotoxicology. 1995;16(3):441–50. [PubMed] [Google Scholar]
- Guilarte TR, Nihei MK, McGlothan JL, Howard AS. Methamphetamine-induced deficits of brain monoaminergic neuronal markers: distal axotomy or neuronal plasticity. Neuroscience. 2003;122(2):499–513. doi: 10.1016/s0306-4522(03)00476-7. [DOI] [PubMed] [Google Scholar]
- Haynes SE, Hollopeter G, Yang G, Kurpius D, Dailey ME, Gan W-B, Julius D. The P2Y12 receptor regulates microglial activation by extracellular nucleotides. Nat Neurosci. 2006;9(12):1512–1519. doi: 10.1038/nn1805. [DOI] [PubMed] [Google Scholar]
- Hirsch T, Decaudin D, Susin SA, Marchetti P, Larochette N, Resche-Rigon M, Kroemer G. PK11195, a ligand of the mitochondrial benzodiazepine receptor, facilitates the induction of apoptosis and reverses Bcl-2-mediated cytoprotection. Exp Cell Res. 1998;241(2):426–434. doi: 10.1006/excr.1998.4084. [DOI] [PubMed] [Google Scholar]
- Hong SH, Choi HB, Kim SU, McLarnon JG. Mitochondrial ligand inhibits store-operated calcium influx and COX-2 production in human microglia. J Neurosci Res. 2006;83:1293–1298. doi: 10.1002/jnr.20829. [DOI] [PubMed] [Google Scholar]
- Irani K, Xia Y, Zweier JL, Sollott SJ, Der CJ, Fearon ER, Sundaresan M, Finkel T, Goldschmidt-Clermont PJ. Mitogenic signaling mediated by oxidants in Ras-transformed fibroblasts. Science. 1997;275(5306):1649–1652. doi: 10.1126/science.275.5306.1649. [DOI] [PubMed] [Google Scholar]
- Jayakumar AR, Panickar KS, Norenberg MD. Effects on free radical generation by ligands of the peripheral benzodiazepine receptor in cultured neural cells. J Neurochem. 2002;83(5):1226–1234. doi: 10.1046/j.1471-4159.2002.01261.x. [DOI] [PubMed] [Google Scholar]
- Jekabsone A, Mander P, Tickler A, Sharpe M, Brown G. Fibrillar beta-amyloid peptide Aβ1-40 activates microglial proliferation via stimulating TNF-α release and H2O2 derived from NADPH oxidase: a cell culture study. J Neuroinflammation. 2006;3(1):24. doi: 10.1186/1742-2094-3-24. [DOI] [PMC free article] [PubMed] [Google Scholar]
- Kuhlmann AC, Guilarte TR. The peripheral benzodiazepine receptor is a sensitive indicator of domoic acid neurotoxicity. Brain Research. 1997;751(2):281–288. doi: 10.1016/s0006-8993(96)01409-6. [DOI] [PubMed] [Google Scholar]
- Kuhlmann AC, Guilarte TR. Regional and temporal expression of the peripheral benzodiazepine receptor in MPTP neurotoxicity. Toxicol Sci. 1999;48(1):107–116. doi: 10.1093/toxsci/48.1.107. [DOI] [PubMed] [Google Scholar]
- Kuhlmann AC, Guilarte TR. Cellular and subcellular localization of peripheral benzodiazepine receptors after trimethyltin neurotoxicity. J Neurochem. 2000;74(4):1694–1704. doi: 10.1046/j.1471-4159.2000.0741694.x. [DOI] [PubMed] [Google Scholar]
- Lawrence CB, Allan SM, Rothwell NJ. Interleukin-1β and the interleukin-1 receptor antagonist act in the striatum to modify excitotoxic brain damage in the rat. Eur J Neurosci. 1998;10(3):1188–1195. doi: 10.1046/j.1460-9568.1998.00136.x. [DOI] [PubMed] [Google Scholar]
- Le Fur G, Vaucher N, Perrier ML, Flamier A, Benavides J, Renault C, Dubroeucq MC, Guérémy C, Uzan A. Differentiation between two ligands for peripheral benzodiazepine binding sites, [3H]RO5-4864 and [3H]PK 11195, by thermodynamic studies. Life Sci. 1983;33(5):449–457. doi: 10.1016/0024-3205(83)90794-4. [DOI] [PubMed] [Google Scholar]
- Li Y, Trush MA. Diphenyleneiodonium, an NAD(P)H oxidase inhibitor, also potently inhibits mitochondrial reactive oxygen species production. Biochem Biophys Res Commun. 1998;253(2):295–299. doi: 10.1006/bbrc.1998.9729. [DOI] [PubMed] [Google Scholar]
- Mander PK, Jekabsone A, Brown GC. Microglia proliferation is regulated by hydrogen peroxide from NADPH oxidase. J Immunol. 2006;176(2):1046–1052. doi: 10.4049/jimmunol.176.2.1046. [DOI] [PubMed] [Google Scholar]
- Makranz C, Cohen G, Baron A, Levidor L, Kodama T, Reichert F, Rotshenker S. Phosphatidylinositol 3-kinase, phosphoinositide-specific phospholipase-Cγ and protein kinase-C signal myelin phagocytosis mediated by complement receptor-3 alone and combined with scavenger receptor-AI/II in macrophages. Neurobiol Dis. 2004;15(2):279–286. doi: 10.1016/j.nbd.2003.11.007. [DOI] [PubMed] [Google Scholar]
- McEnery MW, Snowman AM, Trifiletti RR, Snyder SH. Isolation of the mitochondrial benzodiazepine receptor: association with the voltage-dependent anion channel and the adenine nucleotide carrier. Proc Natl Acad Sci USA. 1992;89(8):3170–4. doi: 10.1073/pnas.89.8.3170. [DOI] [PMC free article] [PubMed] [Google Scholar]
- Mills CD, Bitler JL, Woolf CJ. Role of the peripheral benzodiazepine receptor in sensory neuron regeneration. Mol Cell Neurosci. 2005;30(2):228–237. doi: 10.1016/j.mcn.2005.07.010. [DOI] [PubMed] [Google Scholar]
- Mills C, Makwana M, Wallace A, Benn S, Schmidt H, Tegeder I, Costigan M, Brown RH, Jr, Raivich G, Woolf CJ. Ro5-4864 promotes neonatal motor neuron survival and nerve regeneration in adult rats. Eur J Neurosci. 2008;27(4):937–946. doi: 10.1111/j.1460-9568.2008.06065.x. [DOI] [PubMed] [Google Scholar]
- Nathan C, Shiloh MU. Reactive oxygen and nitrogen intermediates in the relationship between mammalian hosts and microbial pathogens. Proc Natl Acad Sci USA. 2000;97(16):8841–8848. doi: 10.1073/pnas.97.16.8841. [DOI] [PMC free article] [PubMed] [Google Scholar]
- Nesic O, Xu G-Y, McAdoo D, Westlund High K, Hulsebosch C, Perez-Polo R. IL-1 receptor antagonist prevents apoptosis and caspase-3 activation after spinal cord injury. J Neurotrauma. 2001;18(9):947–956. doi: 10.1089/089771501750451857. [DOI] [PubMed] [Google Scholar]
- Nishizuka Y. The role of protein kinase C in cell surface signal transduction and tumour promotion. Nature. 1984;308(5961):693–698. doi: 10.1038/308693a0. [DOI] [PubMed] [Google Scholar]
- Ostuni MA, Ducroc R, Péranzi G, Tonon M-C, Papadopoulos V, Lacapere J-J. Translocator protein (18 kDa) ligand PK 11195 induces transient mitochondrial Ca2+ release leading to transepithelial Cl- secretion in HT-29 human colon cancer cells. Biol Cell. 2007;99(11):639–647. doi: 10.1042/BC20070048. [DOI] [PubMed] [Google Scholar]
- Ouchi Y, Yoshikawa E, Sekine Y, Futatsubashi M, Kanno T, Ogusu T, Torizuka T. Microglial activation and dopamine terminal loss in early Parkinson’s disease. Ann Neurol. 2005;57(2):168–175. doi: 10.1002/ana.20338. [DOI] [PubMed] [Google Scholar]
- Papadopoulos V, Baraldi M, Guilarte TR, Knudsen TB, Lacapère JJ, Lindemann P, Norenberg MD, Nutt D, Weizman A, Zhang MR, Gavish M. Translocator protein (18kDa): new nomenclature for the peripheral-type benzodiazepine receptor based on its structure and molecular function. Trends Pharmacol Sci. 2006;27(8):402–9. doi: 10.1016/j.tips.2006.06.005. [DOI] [PubMed] [Google Scholar]
- Papadopoulos V, Lecanu L. Translocator protein (18 kDa) TSPO: An emerging therapeutic target in neurotrauma. Exp Neurol. 2009;219(1):53–57. doi: 10.1016/j.expneurol.2009.04.016. [DOI] [PMC free article] [PubMed] [Google Scholar]
- Rotshenker S, Reichert F, Gitik M, Haklai R, Elad-Sfadia G, Kloog Y. Galectin-3/MAC-2, Ras and PI3K activate complement receptor-3 and scavenger receptor-AI/II mediated myelin phagocytosis in microglia. Glia. 2008;56(15):1607–1613. doi: 10.1002/glia.20713. [DOI] [PubMed] [Google Scholar]
- Rommel C, Camps M, Ji H. PI3Kδ and PI3Kγ: partners in crime in inflammation in rheumatoid arthritis and beyond? Nat Rev Immunol. 2007;7(3):191–201. doi: 10.1038/nri2036. [DOI] [PubMed] [Google Scholar]
- Ryu JK, Choi HB, McLarnon JG. Peripheral benzodiazepine receptor ligand PK11195 reduces microglial activation and neuronal death in quinolinic acid-injected rat striatum. Neurobiol Dis. 2005;20(2):550–561. doi: 10.1016/j.nbd.2005.04.010. [DOI] [PubMed] [Google Scholar]
- Skaper SD, Debetto P, Giusti P. The P2X7 purinergic receptor: from physiology to neurological disorders. FASEB J. 24(2):337–345. doi: 10.1096/fj.09-138883. [DOI] [PubMed] [Google Scholar]
- Sorce S, Krause K-H. NOX enzymes in the central nervous system: from signaling to disease. Antioxid Redox Signal. 2009;11(10):2481–2504. doi: 10.1089/ars.2009.2578. [DOI] [PubMed] [Google Scholar]
- Soustiel JF, Zaaroor M, Vlodavsky E, Veenman L, Weizman A, Gavish M. Neuroprotective effect of Ro5-4864 following brain injury. Exp Neurol. 2008;214(2):201–208. doi: 10.1016/j.expneurol.2008.08.008. [DOI] [PubMed] [Google Scholar]
- Stolk J, Hiltermann TJ, Dijkman JH, Verhoeven AJ. Characteristics of the inhibition of NADPH oxidase activation in neutrophils by apocynin, a methoxy-substituted catechol. Am J Respir Cell Mol Biol. 1994;11(1):95–102. doi: 10.1165/ajrcmb.11.1.8018341. [DOI] [PubMed] [Google Scholar]
- Suh H-S, Kim M-O, Lee SC. Inhibition of granulocyte-macrophage colony-stimulating factor signaling and microglial Proliferation by anti-CD45RO: role of Hck tyrosine kinase and phosphatidylinositol 3-kinase/Akt. J Immunol. 2005;174(5):2712–271. doi: 10.4049/jimmunol.174.5.2712. [DOI] [PubMed] [Google Scholar]
- Tambuyzer BR, Ponsaerts P, Nouwen EJ. Microglia: gatekeepers of central nervous system immunology. J Leukoc Biol. 2009;85:1–19. doi: 10.1189/jlb.0608385. [DOI] [PubMed] [Google Scholar]
- Veenman L, Gavish M. Peripheral-type benzodiazepine receptors: Their implication in brain disease. Drug Dev Res. 2000;50(3-4):355–370. [Google Scholar]
- Veenman L, Leschiner S, Spanier I, Weisinger G, Weizman A, Gavish M. PK 11195 attenuates kainic acid-induced seizures and alterations in peripheral-type benzodiazepine receptor (PBR) protein components in the rat brain. J Neurochem. 2002;80(5):917–27. doi: 10.1046/j.0022-3042.2002.00769.x. [DOI] [PubMed] [Google Scholar]
- Veenman L, Papadopoulos V, Gavish M. Channel-like functions of the 18-kDa translocator protein (TSPO): regulation of apoptosis and steroidogenesis as part of the host-defense response. Curr Pharm Des. 2007;13(23):2385–405. doi: 10.2174/138161207781368710. [DOI] [PubMed] [Google Scholar]
- Veenman L, Shandalov Y, Gavish M. VDAC activation by the 18 kDa translocator protein (TSPO), implications for apoptosis. J Bioenerg Biomembr. 2008;40(3):199–205. doi: 10.1007/s10863-008-9142-1. [DOI] [PubMed] [Google Scholar]
- Veenman L, Alten J, Linnemannstöns K, Shandalov Y, Zeno S, Lakomek M, Gavish M, Kugler W. Potential involvement of F0F1-ATP(synth)ase and reactive oxygen species in apoptosis induction by the antineoplastic agent erucylphosphohomocholine in glioblastoma cell lines: a mechanism for induction of apoptosis via the 18 kDa mitochondrial translocator protein. Apoptosis. 2010;15(7):753–68. doi: 10.1007/s10495-010-0460-5. [DOI] [PMC free article] [PubMed] [Google Scholar]
- Veiga S, Carrero P, Pernia O, Azcoitia I, Garcia-Segura LM. Translocator protein (18 kDa) is involved in the regulation of reactive gliosis. Glia. 2007;55(14):1426–1436. doi: 10.1002/glia.20558. [DOI] [PubMed] [Google Scholar]
- Venneti S, Lopresti BJ, Wang G, Bissel SJ, Mathis CA, Meltzer CC, Boada F, Capuano S, Kress GJ, Davis DK, Murphey-Corb M, Trichel AM, Wisniewski SR, Wiley CA. PET imaging of brain macrophages using the peripheral benzodiazepine receptor in a macaque model of neuroAIDS. J Clin Invest. 2004;113(7):981–989. doi: 10.1172/JCI20227. [DOI] [PMC free article] [PubMed] [Google Scholar]
- Venneti S, Wang G, Wiley CA. Activated macrophages in HIV encephalitis and a macaque model show increased [3H](R)-PK11195 binding in a PI3-kinase-dependent manner. Neurosci Lett. 2007;426(2):117–122. doi: 10.1016/j.neulet.2007.08.053. [DOI] [PMC free article] [PubMed] [Google Scholar]
- Versijpt JJ, Dumont F, van Laere KJ, Decoo D, Santens P, Audenaert K, Achten E, Slegers G, Dierckx RA, Korf J. Assessment of neuroinflammation and microglial activation in Alzheimer’s disease with radiolabelled PK11195 and single photon emission computed tomography. Eur Neurol. 2003;50(1):39–47. doi: 10.1159/000070857. [DOI] [PubMed] [Google Scholar]
- Vignais PV. The superoxide-generating NADPH oxidase: structural aspects and activation mechanism. Cell Mol Life Sci. 2002;59(9):1428–1459. doi: 10.1007/s00018-002-8520-9. [DOI] [PMC free article] [PubMed] [Google Scholar]
- Vowinckel E, Reutens D, Becher B, Verge G, Evans A, Owens T, Antel JP. PK11195 binding to the peripheral benzodiazepine receptor as a marker of microglia activation in multiple sclerosis and experimental autoimmune encephalomyelitis. J Neurosci Res. 1997;50(2):345–353. doi: 10.1002/(SICI)1097-4547(19971015)50:2<345::AID-JNR22>3.0.CO;2-5. [DOI] [PubMed] [Google Scholar]
- Zassler B, Schermer C, Humpel C. Protein kinase C and phosphoinositol-3-kinase mediate differentiation or proliferation of slice-derived rat microglia. Pharmacology. 2003;67(4):211–215. doi: 10.1159/000068403. [DOI] [PubMed] [Google Scholar]
- Zeno S, Zaaroor M, Leschiner S, Veenman L, Gavish M. CoCl(2) induces apoptosis via the 18 kDa translocator protein in U118MG human glioblastoma cells. Biochemistry. 2009;48(21):4652–61. doi: 10.1021/bi900064t. [DOI] [PubMed] [Google Scholar]
Associated Data
This section collects any data citations, data availability statements, or supplementary materials included in this article.