

The use of 2-hydroxyglutarate (2HG) to predict the presence of isocitrate dehydrogenase (IDH)1/2 mutations in patients with glioma was explored. The ratio of the 2HG levels in the plasma and urine was significantly different between patients with and without an IDH1 mutation.
Keywords: Isocitrate dehydrogenase, 2-Hydroxyglutarate, Biomarker, Plasma, Urine, Glioma
Abstract
Background.
Mutant isocitrate dehydrogenase (IDH) 1/2 enzymes can convert α-ketoglutarate into 2-hydroxyglutarate (2HG). The aim of the present study was to explore whether 2HG in plasma and urine could predict the presence of IDH1/2 mutations in patients with glioma.
Materials and Methods.
All patients had histological confirmation of glioma and a recent brain magnetic resonance imaging scan showing the neoplastic lesion. Plasma and urine samples were taken from all patients, and the 2HG concentrations were determined using liquid chromatography tandem mass spectrometry.
Results.
A total of 84 patients were enrolled: 38 with R132H-IDH1 mutated and 46 with wild type. Among the 38 patients with mutant IDH1, 21 had high-grade glioma and 17 had low-grade glioma. Among the 46 patients with IDH1 wild-type glioma, 35 and 11 had high- and low-grade glioma, respectively. In all patients, we analyzed the mean 2HG concentration in the plasma, urine, and plasma/urine ratio (Ratio_2HG). We found a significant difference in the Ratio_2HG between patients with and without an IDH1 mutation (22.2 ± 8.7 vs. 15.6 ± 6.8; p < .0001). The optimal cutoff value for Ratio_2HG to identify IDH1 mutation was 19 (sensitivity, 63%; specificity, 76%; accuracy, 70%). In the patients with high-grade glioma only, the optimal cutoff value was 20 (sensitivity, 76%; specificity, 89%; accuracy, 84%; positive predictive value, 80%; negative predictive value, 86%). In 7 of 7 patients with high-grade glioma, we found a correlation between the Ratio_2HG value and the response to treatment.
Conclusion.
Ratio_2HG might be a predictor of the presence of IDH1 mutation. The measurement of 2HG could be useful for disease monitoring and also to assess the treatment effects in these patients.
Implications for Practice:
This study showed that the plasma to urinary 2-hydroxyglutarate concentration ratio could be an estimate of isocitrate dehydrogenase (IDH) gene status in patients with glioma. That could allow the identification of the IDH mutation status in patients who are not amenable to surgery and could facilitate the monitoring of treatment responses and disease recurrence in patients with glioma and an IDH mutation. The knowledge of IDH mutation status in patients with glioma represents a prognostic and diagnostic marker for these patients. In the future, it could allow a specific treatment, such as the selective R132H-IDH1 inhibitor.
Introduction
The most common primary malignant brain tumors are of glial origin. The World Health Organization (WHO) classification system is the most frequently used schema and is based on standard histologic criteria [1], dividing glioma into low and high grade. Mutations of the isocitrate dehydrogenase (IDH) 1/2 genes in glioma are undoubtedly one of the most groundbreaking discoveries in the field of neuro-oncology in recent years and represent important prognostic factors. Mutations of IDH1/2 are found in approximately 50%–90% of adult astrocytomas and oligodendrogliomas of WHO grades II and III and secondary glioblastomas. In contrast, IDH1/2 mutations occur in only a small subset (3%–16%) of primary glioblastomas [2]. When present, these gene mutations are the earliest genetic changes common to both astrocytic and oligodendroglial tumors [3].
Approximately 90% of all IDH1 mutations are G to A transition at the second nucleotide of codon 132, resulting in the substitution of arginine with histidine (R132H) [4]. The main function common to all isozymes is to catalyze the oxidative decarboxylation of isocitrate into α-ketoglutarate (αKG) [2]. The most prominent consequence of IDH mutation is that the altered enzyme acquires neomorphic activity to reduce αKG into 2-hydroxyglutarate (2HG) in an NADPH-dependent manner [5]. It seems likely that the gain-of-function ability of cells to produce 2HG as a result of R132 mutations in IDH1 contributes to tumorigenesis. In turn, hypoxia-inducible factor 1 (HIF-1) levels are increased, which was attributed to the release from negative regulation by αKG. αKG is required for prolyl hydroxylase activity. Prolyl hydroxylases promote the degradation of HIF-1. Increased HIF-1 activity has been shown to be of great importance in the biology of glioblastoma; moreover, IDH enzymes with altered activity profiles might directly or indirectly affect other metabolic pathways, including NADP-dependent pathways such as the pentose phosphate pathway, intracellular base acid balances, and antioxidant properties [6].
IDH1/2 mutations are also common in patients with cytogenetically normal acute myeloid leukemia (AML); in these patients, the incidence of IDH1/2 mutations is 5%–20% [7, 8]. Unlike gliomas, in which the incidence of IDH1 mutations is more frequent than IDH2 mutations, the frequency of IDH1 and IDH2 mutations is similar in patients with AML [9]. Various studies have analyzed 2HG levels, demonstrating that IDH1/2 mutant AML cells and sera have increased levels of 2HG [10, 11].
Likewise, it was demonstrated that 2HG levels are also elevated in gliomas with mutated IDH; in particular, gliomas with wild-type IDH1 had more than 100-fold less 2HG [5]. Because 2HG is a small molecule, it seems possible that it could reach the systemic circulation and be excreted by the urine and that altered 2HG serum or urine levels might help to identify patients harboring IDH1 mutated gliomas. In the present study, we measured and compared the 2HG levels in plasma and urine in patients with glioma to identify a surrogate circulatory biomarker of IDH gene mutation potentially useful in the clinical setting.
Materials and Methods
Study Population and Data Collection
Patients were enrolled in the present study in accordance with the Declaration of Helsinki, and all patients had to meet the following inclusion and exclusion criteria. The inclusion criteria were brain tumor biopsy and histological confirmation of glioma, neoplastic tissue available for analysis of the IDH1/2 genes using polymerase chain reaction (PCR) and sequence analysis, a recent (within 2 weeks) brain magnetic resonance imaging (MRI) scan of the neoplastic lesion, and approved written consent. The exclusion criteria were the absence of neoplastic lesions on the brain MRI scan, chemotherapy within the previous 28 days, other neoplastic and metabolic diseases, and renal and/or liver failure.
Samples from the patients with gliomas were collected at the Medical Oncology 1, Department of Clinical and Experimental Oncology, Veneto Institute of Oncology–IRCCS, Padua, Italy from January 2011 to May 2013, and were investigated for IDH1 and IDH2 mutations at the Immunology and Molecular Oncology Unit, Veneto Institute of Oncology–IRCCS, Padua, Italy. The 2HG measurements in the plasma and urinary samples were analyzed at the Experimental and Clinical Pharmacology Department, National Cancer Institute, Aviano, Italy.
IDH1/2 Gene Analysis
To analyze the IDH1 gene mutations, DNA isolated from formalin-fixed paraffin-embedded tumor tissue was subjected to PCR using primer pairs specific for exon 4 of the IDH1 and IDH2 genes. The amplified products were subjected to sequencing analysis by fluorescent capillary electrophoresis (ABI PRISM 310 genetic analyzer; Applied Biosystems, Foster City, CA, http://www.appliedbiosystems.com).
2HG Analysis
The serum and urine total concentrations of 2HG were measured using ion pair reverse-phase liquid chromatography coupled with tandem mass spectrometry (LC-MS/MS), according to Dang et al. [5]. The equipment consisted of HPLC Ultimate 3000 (Thermo Scientific, Waltham, MA, http://www.thermofisher.com) directly connected to a 4000 QTRAP mass spectrometer (Ab Sciex, Framingham, MA, http://www.sciex.com). In brief, 50 μL of serum was added with 200 μL of acetonitrile solution containing 100 ng/mL d4-1-5 pentanoic acid used as the internal standard (IS) (CDN Isotope, Pointe-Claire, Quebec, Canada, http://www.cdnisotopes.com). After 5” vortex and centrifugation at 15,000g for 10 minutes at 4°C, the clear supernatant was dried in Z2 speed vacuum (Genevac Ltd., Ipswich, U.K., http://www.genevac.com). The residues were dissolved in 250 μL of 10 mM tributylamine (15 mM acid; pH 4.6 [solution A]), and 10 μL was injected into a Synergi Hydro-RP (C18) 150 × 2.1 mm, 4-μm column (Phenomenex, Torrance, CA, http://www.phenomenex.com) equilibrated with 20% methanol in solution A at 0.3 mL/min and maintained at 40°C. Elution of the analytes was performed by a 12-minute gradient to 53% methanol in solution A. Under this condition, the retention times for 2HG and IS were 8.0 minutes and 7.3 minutes, respectively. Urine was diluted 40-fold with solution A containing IS, and 10 µL of the resulting solution was directly injected into the column. The 2HG quantitative mass spectrometry was performed by multiple reaction monitoring (MRM) in negative operation mode using the following optimized TuboIon source parameters: curtain gas, 20; collision gas, medium; ion spray voltage, −4500 V; nebulizer and auxiliary gas, 65; and temperature, 650°C. The MRM transitions for 2HG and the internal standard were 146.8 → 128.9 m/z and 134.9 → 102.1 m/z, respectively, and the respective optimized collision energy values were −14 V and −17 V. The method was validated according to Food and Drug Administration guidelines. The low limit of quantification was 10 ng/mL, and the linearity was in the range 10–2000 ng/mL, and the intra- and interassay accuracy and precision were less than 13%. The creatinine concentration in urine samples was quantified by validated isotope dilution LC-MS/MS method according to an established analytical protocol [12].
Statistical Analysis
All statistical analyses were performed using Statistical Package for Social Sciences statistical software, version 15.0 (IBM Corp., Armonk, NY, http://www-01.ibm.com/software/analytics/spss/). The Mann-Whitney U test was used to test for differences in metabolite concentrations between those with mutant and wild-type IDH. Correlations between plasma and urinary 2HG were estimated with Spearman rank-order correlation coefficient. The differences with p ≤ .05 were considered significant. The area under the receiver operating characteristic curve (ROC AUC) was performed to determine the cutoff value of the 2HG biomarker. The optimal cutoff value was determined at the point on the ROC curve at (sensitivity + specificity − 1) was maximized (Youden index).
On the brain MRI scan, the tumor volume was estimated using fluid-attenuated inversion recovery imaging for low-grade gliomas and the contrast-enhanced tumor area for high-grade gliomas (HGGs) using the formula for an ellipsoid: π (a × b × c)/6.
Results
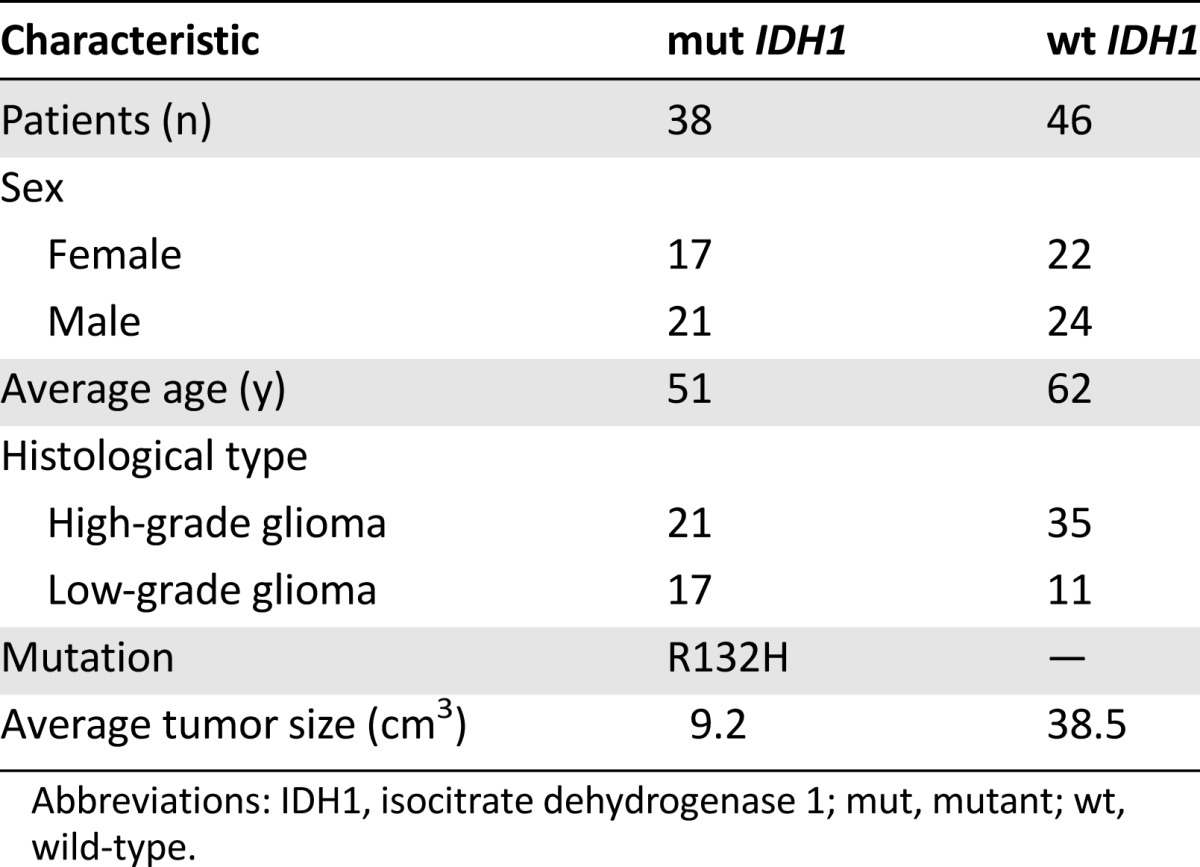
We enrolled 84 patients. The characteristics of all the patients are summarized in Table 1. All the mutations were R132H-IDH1. Of the 38 patients with mutant IDH1, 17 were women and 21 were men, with an average age of 51 years; 21 patients had high-grade gliomas and 17 had low-grade gliomas. The average tumor size was 9.2 cm3. Of the patients with wild-type IDH1, 22 were women and 24 were men, with an average age of 62 years; 35 patients had high-grade gliomas and 11 had low-grade gliomas. The average tumor size was 38.5 cm3.
Table 1.
Characteristics of patients with mutant and wild-type IDH1
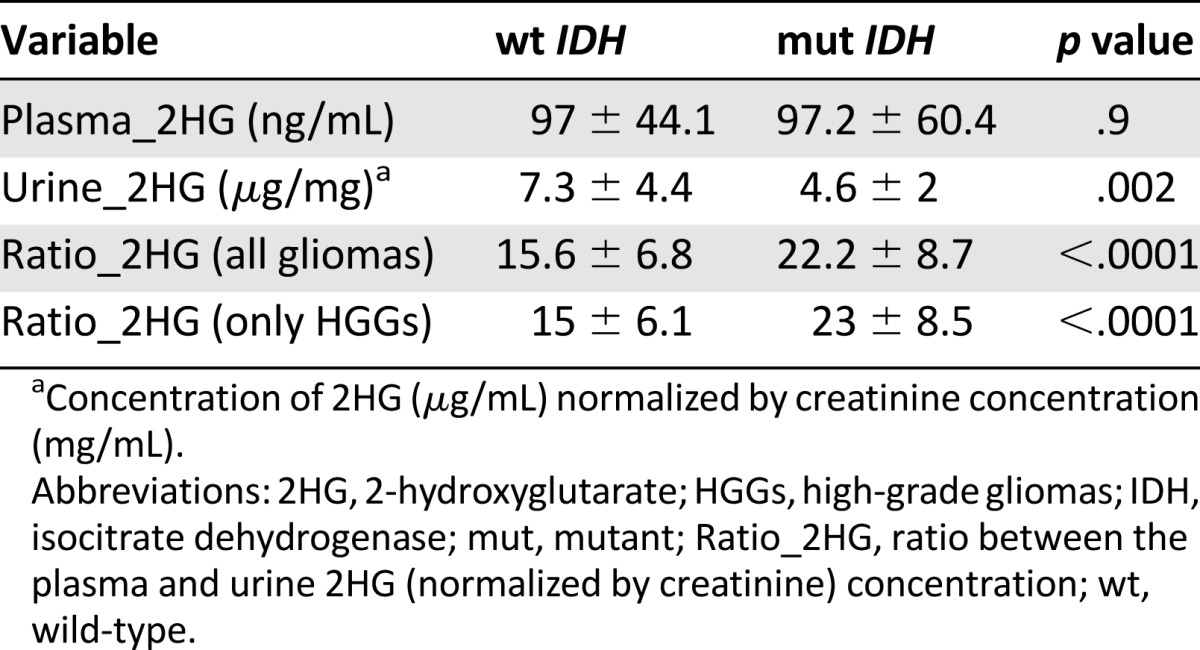
The mean concentration of 2HG (Table 2) in the plasma was not significantly different between the two groups: 97 ± 44.1 ng/mL in patients with wild-type IDH1 and 97.2 ± 60.4 ng/mL in those with IDH1 mutation (p = .9). In contrast, the 2HG concentration in the urine, normalized by creatinine, was significantly greater in those with wild-type IDH than in those with the IDH mutation: 7.3 ± 4.4 and 4.6 ± 2 μg/mg (p = .002), respectively. When the ratio between the plasma and urine 2HG (normalized by creatinine) concentration (Ratio_2HG) was considered, a statistically significant difference was found between the patients with wild-type and mutant IDH1: 15.6 ± 6.8 versus 22.2 ± 8.7 (p < .0001), respectively.
Table 2.
Plasma and urinary mean 2HG concentration in wild-type and mutated IDH gene
Analyzing the metabolite concentration in a subset of 56 patients with high-grade glioma, the difference in the Ratio_2HG was greater than that in the patients with low-grade glioma, between patients with and without the mutation: 23 ± 8.5 versus 15 ± 6.1 (p < .0000; Fig. 1).
Figure 1.

Ratio between the mean 2-hydroxyglutarate concentration in the plasma and urine in patients with high-grade glioma with mutant IDH and wild-type IDH.
Abbreviations: IDH, isocitrate dehydrogenase; mut, mutant; Ratio_2HG, ratio between the mean 2-hydroxyglutarate concentration in the plasma and urine; wt, wild-type.
ROC curve analysis was performed to determine the cutoff value of Ratio_2HG. In all patients with glioma, the optimal cutoff value of Ratio_2HG to discriminate between patients with and without the IDH1 mutation was 19, with an ROC AUC of 0.73 (95% confidence interval [CI] 0.62–0.84; Fig. 2). The sensitivity and specificity were 63% and 76%, respectively. The accuracy was 70%, positive predictive value was 69%, and negative predictive value was 71%. Analyzing only those patients with HGG, the optimal cutoff value of the Ratio_2HG was 20 (ROC AUC 0.83, 95% CI 0.71–0.94), with sensitivity and specificity of 76% and 89%, respectively. The accuracy was 84%, the positive predictive value was 80%, and the negative predictive value was 86% (Fig. 3).
Figure 2.

Receiver operating characteristic curve analyzing the cutoff value of ratio between the mean 2-hydroxyglutarate concentration in the plasma and urine in all patients with glioma.
Figure 3.
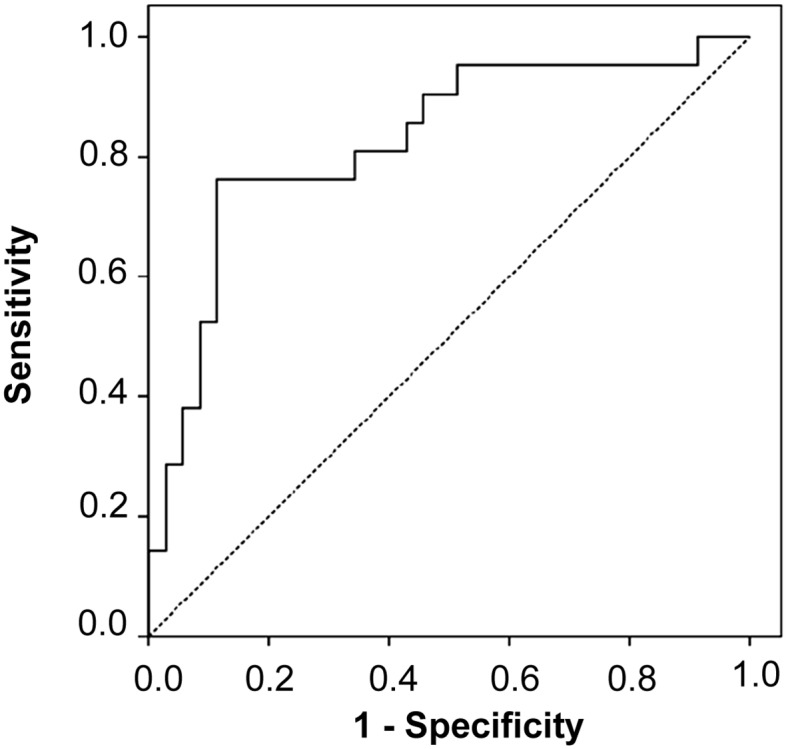
Receiver operating characteristic curve analyzing the cutoff value of the ratio between the mean 2-hydroxyglutarate concentration in the plasma and urine in patients with high-grade glioma.
The correlation study between the tumor size and Ratio_2HG within the mutated IDH1 group indicated that the Ratio_2HG levels were independent of the tumor size in both all patients with glioma (Spearman r = 0.6; p = .4) and the patients with HGG only (Spearman r = 0.4; p = .8). Moreover, no significant correlation was found between the tumor grade and Ratio_2HG in all patients with glioma.
In a subset of 7 patients with high-grade glioma, the level of Ratio_2HG before and after chemotherapy correlated with the change in the brain MRI findings evaluated using the Response Assessment in Neuro-Oncology criteria. The brain MRI findings of the investigated patients showed 4 with partial responses, 1 with complete response, and 2 with progressive disease. All the patients with a response had a decrease in the Ratio_2HG after chemotherapy compared with the baseline levels. In contrast, in both patients with progressive disease, the biomarker level had increased (Fig. 4).
Figure 4.

Variation in the ratio between the mean 2-hydroxyglutarate concentration in the plasma and urine levels before and after chemotherapy in patients with high-grade glioma in correlation with the response found on the brain magnetic resonance imaging scan.
Abbreviation: Ratio_2HG, ratio between the mean 2-hydroxyglutarate concentration in the plasma and urine.
Discussion
In the past few years, important advances have been made in understanding the role of mutant IDH1/2 in glioma tumorigenesis, and 2HG is an important mediator in this process. The intracellular accumulation of this oncometabolite in tumor cells can interfere with αKG-dependent dioxygenases, such as TET2, and modify the physiological degradation of HIF transcription factor [13]. The activity of mutant IDH1/2 genes in the production of cell-permeable 2HG lends itself to use as a circulating surrogate biomarker of IDH mutation status.
The role of 2HG as a surrogate biomarker has also been analyzed in other neoplastic diseases. Initially, Gross et al. [10], from a series of 145 AML patients, identified 11 patients with heterozygous IDH1 R132 mutations. In these patients, the investigators found higher levels of 2HG in the plasma and AML cells than in the plasma and AML cells of AML patients with the IDH1 wild type [10]. Subsequently, in another important study, Janin et al. [11] analyzed the serum samples from 82 patients with de novo acute myeloid leukemia and observed that in patients with IDH1/2 mutations, the median 2HG levels were significantly greater than in the patients with IDH1/2 wild type (21.2 vs. 1.2 μmol/L; p < .001). Moreover, high values of total 2HG were predictive of the presence of IDH mutation. The optimal diagnostic cutoff to discriminate IDH mutated and wild type showed 100% sensitivity and 79% specificity. However, the investigators demonstrated that in patients with an IDH mutation, the 2HG levels can reflect clinical status and correlated with “minimal residual disease” markers. The median 2HG concentration in patients with a complete response was significantly lower than that in the patients without a complete response after one induction course (6.2 vs. 8.3 μmol/L; p < .001). Serum 2HG could also be used as a predictor of outcome in patients with AML. Low 2HG levels after induction therapy were associated with longer overall survival and disease-free survival.
Recently, circulating 2HG was also demonstrated to be a surrogate biomarker of IDH mutation status in patients with cholangiocarcinoma. The 2HG levels were 343 and 55 ng/mL (p < .001) in the patients with and without IDH mutations, respectively [14]. Fathi et al. [15], in a very small size study, demonstrated that an IDH1 mutation could be present in some cases of breast cancer. They described the first reported case of an IDH1 mutation in 1 patient with breast adenocarcinoma. In addition, the 2HG levels in both plasma and urine were significantly greater than those measured in 6 other patients with breast carcinoma and IDH1 wild type.
In our study, we evaluated whether the 2HG levels in urine and plasma would correlate with IDH mutation status in patients with glioma. In contrast to the higher accumulation of 2HG in the plasma of patients with AML or cholangiocarcinoma with IDH mutations [11, 14], we found no statistically significant difference in the 2HG levels in the plasma between patients with and without IDH1 mutation. However, we found a significant difference in the urine 2HG levels. Moreover, in the patients with an IDH mutation, we found a lower 2HG concentration in the plasma (97.2 ng/mL) than that reported in the patients with AML or cholangiocarcinoma (12,400 and 343 ng/mL, respectively). It is likely that in patients with glioma, in contrast to the patients with AML, in whom the site of 2HG production is known to be in the peripheral blood, the site is in the brain. However, the exact mechanism of release of 2HG from neoplastic cells in the brain is unclear. A previous study demonstrated “in vitro” that in the glioma cells, a very low diffusion of passive 2HG across the cell membrane occurs. This might explain the lower concentration of this metabolite in the plasma of patients with glioma than in patients with other neoplastic diseases [16]. Moreover, necrosis might be the main condition responsible for 2HG release in those with glioma, and glioblastoma is known to be the HGG with the greatest extension of necrosis. Among our patients with HGG, only 20% had a diagnosis of glioblastoma. Although cytotoxic treatment causing tumoral necrosis might increase 2HG release, not all the patients enrolled in our study underwent chemotherapy within the previous 28 days. These reasons could explain the low 2HG concentration in plasma and its lack of statistical significance.
In accordance with our results, a previous study analyzing 16 glioma samples showed no significant difference in 2HG levels in the plasma from patients with and without an IDH mutation (1.64 vs. 1.3 μmol/L, respectively; p = NS) [17]. Therefore, in conclusion, these results seem to suggest that the 2HG levels in the plasma only cannot be used as a surrogate marker for IDH mutation status in patients with glioma.
For the first time, in addition to the plasma concentration, we analyzed the 2HG levels in the urine from patients with glioma. Owing to the low 2HG levels in plasma, we thought to analyze its concentration in urine, because, just as in other metabolic diseases involving 2HG, such as 2HG dehydrogenase deficiency, the accumulation of 2HG was much higher in the urine than in the plasma [18]. We found a significantly lower 2HG concentration in patients with mutated IDH1 than in patients lacking the mutation (p = .002). In IDH1 mutation glioma, the increase in intracellular 2HG results from a greater production of the d-enantiomer of 2HG only and not of the l-isomer [5]. It is likely that the d-enantiomer of 2HG has a shorter time to urinary excretion than the other isomer, or it might interfere with the urinary excretion of l-isomer, resulting in a lower concentration of urinary 2HG in patients with IDH mutations. This might explain our results. Moreover, in the kidneys, the organic anion transporters 1 and 3 (OAT1 and OAT3) in cooperation with sodium-dependent dicarboxylate transporter 3 and the OAT4 have been implied in the uptake of 2HG into and the efflux out of the tubular cells [19, 20]. The two enantiomers of 2HG might have a different affinity with the transporters. In particular, d-2HG might have a lower affinity than the l-isomer or might inhibit l-2HG uptake. However, these assumptions remain to be verified in an ongoing subsequent study. Just as in most clinical studies analyzing the 2HG metabolite [14, 15, 17], we focused our present investigation on the measurement of the total 2HG metabolite (l- plus d-isomer forms). Moreover, some metabolic or kidney diseases such as 2-hydroxyglutaric aciduria and chronic renal failure could alter the physiological 2HG metabolism and urinary excretion. However, all patients with these diseases were excluded from our study.
Although statistically significant, the difference in the 2HG levels in urine was too small (∆ = 2.7 μg/mg) to obtain a cutoff to discriminate the IDH mutation status in real clinical practice. Therefore, we explored the diagnostic power of the ratio between the 2HG levels in the plasma and urine. Adopting the Ratio_2HG as a biomarker, we obtained a wider difference (∆ = 6.6) between patients with and without an IDH1 mutation and the possibility of calculating a valid cutoff level. We found that the optimal cutoff value to discriminate the IDH mutation status in high-grade gliomas was 20, with optimal sensitivity, specificity, and accuracy. In particular, this cutoff level had a high negative and positive predictive value (86% and 80%, respectively). These data demonstrate that using the Ratio_2HG value, instead of the 2HG levels in urine and plasma alone, we can calculate a real cutoff value to discriminate IDH gene status.
We also analyzed the individual Ratio_2HG, because it could result in a more accurate value than the mean of the 2HG level in the plasma and urine, considering the production and excretion of 2HG in each individual patient and reducing interpatient variability. However, the difference between the metabolite concentration in plasma and that in urine reflects the total changes occurring during fluid transit through the proximal and distal tubules. The contribution of the tubule in metabolite handling could be better assessed as a fraction of the filtered molecule load that is excreted into the urine (Ratio_2HG). Likewise, Marenzi et al. [21] demonstrated that the plasma to urinary sodium concentration ratio is a better estimate of plasma renin activity in congestive heart failure than are the plasma and urinary sodium concentrations.
We found a significant difference in the 2HG levels in the urine and a significant difference in the Ratio_2HG between patients with and without an IDH mutation. We believe the Ratio_2HG was significantly higher in patients with a mutated IDH1 because of the lower concentration of 2HG in the urine. The 2HG level in the plasma was similar between the patients with and without an IDH mutation, but the urinary 2HG concentration was significantly lower in the patients with an IDH mutation, leading to an increase in the Ratio_2HG value in those patients. However, we did not find a correlation between tumor size or tumor grade and the Ratio_2HG level.
We also questioned whether serial 2HG monitoring in the urine and plasma could serve as a surrogate marker of the treatment response or recurrent disease in patients with IDH mutations. In a small subgroup of patients, we analyzed the Ratio_2HG as a tumoral biomarker. The level of a valid tumoral biomarker should increase in the case of progressive disease and should decrease in the case of a partial or complete response, as determined from the brain MRI findings. Although we analyzed only 7 patients with high-grade glioma and mutated IDH1, we found a correlation between the variation in the Ratio_2HG and the change in the tumoral lesion findings on the brain MRI scan. Therefore, the detection of Ratio_2HG might be a good biomarker to monitor treatment effects and during patient follow-up. However, larger samples need to be analyzed to investigate these results.
The use of the 2HG metabolite as a surrogate biomarker could allow the identification of the IDH mutation status in a large population of patients with glioma, including those who are not amenable to surgery. In addition, it could facilitate the monitoring of treatment responses in patients with mutated IDH. Currently, the available methods of detecting IDH mutations in gliomas are based on the analysis of glioma tissue, investigating either the altered structure of the protein using the monoclonal antibody against the common mutationIDH1-R132H or the sequence of the IDH gene using Sanger sequencing. However, the assessment of IDH mutation status is mandatory in patients with glioma, because it can serve for a combined histological and molecular classification. Various studies have demonstrated that patients with gliomas of grade II–IV with IDH mutations have a better prognosis than those with IDH wild-type tumors [22–25]. Moreover, the assessment of IDH status can be used as a diagnostic marker, because the IDH mutation can be a characteristic of some specific gliomas. For example, the presence of IDH mutation can recognize diffuse tumor infiltration of astrocytoma or oligodendroglioma from reactive gliosis or from pilocytic astrocytoma. Finally, the presence of IDH mutations could allow the use of new specific, targeted therapies. A selective R132H-IDH1 inhibitor has recently been shown to specifically impair the growth of IDH1-mutant glioma cells and promote their differentiation [26].
Conclusion
Knowledge of IDH mutation status is mandatory for patients with glioma, because it could represent a prognostic and diagnostic marker for these patients. In the future, it could allow for specific IDH-inhibitor treatment. In the present exploratory investigation, we found that the straightforward analysis of the total 2HG levels in the urine and plasma could be a reliable and simple surrogate biomarker of IDH mutation status, especially for patients who are not amenable to biopsy. Furthermore, serial 2HG monitoring could serve as a surrogate biomarker of the treatment response and disease recurrence in patients with glioma and an IDH mutation.
Although our data are encouraging, additional investigations are needed to determine the role of the 2HG metabolite as a surrogate marker of IDH mutation status in patients with glioma and to demonstrate whether the 2HG levels in the plasma and urine correlate with treatment effects.
Acknowledgment
We thank Christina Drace for English support.
Author Contributions
Conception/Design: Giuseppe Lombardi, Vittorina Zagonel
Provision of study material or patients: Giuseppe Lombardi, Alessandro Della Puppa, Domenico D’Avella, Vittorina Zagonel
Collection and/or assembly of data: Giuseppe Lombardi, Giuseppe Corona, Luisa Bellu, Ardi Pambuku, Roberta Bertorelle, Vittorina Zagonel
Data analysis and interpretation: Giuseppe Lombardi, Pasquale Fiduccia, Giuseppe Corona, Marina Paola Gardiman, Giuseppe Toffoli, Vittorina Zagonel
Manuscript writing: Giuseppe Lombardi, Giuseppe Corona
Final approval of manuscript: Giuseppe Lomardi, Vittorina Zagonel
Disclosures
The authors indicated no financial relationships.
References
- 1.Louis DN, Ohgaki H, Wiestler OD, et al. The 2007 WHO classification of tumours of the central nervous system. Acta Neuropathol. 2007;114:97–109. doi: 10.1007/s00401-007-0243-4. [DOI] [PMC free article] [PubMed] [Google Scholar]
- 2.Reitman ZJ, Yan H. Isocitrate dehydrogenase 1 and 2 mutations in cancer: Alterations at a crossroads of cellular metabolism. J Natl Cancer Inst. 2010;102:932–941. doi: 10.1093/jnci/djq187. [DOI] [PMC free article] [PubMed] [Google Scholar]
- 3.Watanabe T, Nobusawa S, Kleihues P, et al. IDH1 mutations are early events in the development of astrocytomas and oligodendrogliomas. Am J Pathol. 2009;174:1149–1153. doi: 10.2353/ajpath.2009.080958. [DOI] [PMC free article] [PubMed] [Google Scholar]
- 4.Pusch S, Sahm F, Meyer J, et al. Glioma IDH1 mutation patterns off the beaten track. Neuropathol Appl Neurobiol. 2011;37:428–430. doi: 10.1111/j.1365-2990.2010.01127.x. [DOI] [PubMed] [Google Scholar]
- 5.Dang L, White DW, Gross S, et al. Cancer-associated IDH1 mutations produce 2-hydroxyglutarate. Nature. 2009;462:739–744. doi: 10.1038/nature08617. [DOI] [PMC free article] [PubMed] [Google Scholar]
- 6.Frezza C, Tennant DA, Gottlieb E. IDH1 mutations in gliomas: When an enzyme loses its grip. Cancer Cell. 2010;17:7–9. doi: 10.1016/j.ccr.2009.12.031. [DOI] [PubMed] [Google Scholar]
- 7.Marcucci G, Maharry K, Wu YZ, et al. IDH1 and IDH2 gene mutations identify novel molecular subsets within de novo cytogenetically normal acute myeloid leukemia: A Cancer and Leukemia Group B study. J Clin Oncol. 2010;28:2348–2355. doi: 10.1200/JCO.2009.27.3730. [DOI] [PMC free article] [PubMed] [Google Scholar]
- 8.Chou WC, Hou HA, Chen CY, et al. Distinct clinical and biologic characteristics in adult acute myeloid leukemia bearing the isocitrate dehydrogenase 1 mutation. Blood. 2010;115:2749–2754. doi: 10.1182/blood-2009-11-253070. [DOI] [PubMed] [Google Scholar]
- 9.Zou Y, Zeng Y, Zhang DF, et al. IDH1 and IDH2 mutations are frequent in Chinese patients with acute myeloid leukemia but rare in other types of hematological disorders. Biochem Biophys Res Commun. 2010;402:378–383. doi: 10.1016/j.bbrc.2010.10.038. [DOI] [PubMed] [Google Scholar]
- 10.Gross S, Cairns RA, Minden MD, et al. Cancer-associated metabolite 2-hydroxyglutarate accumulates in acute myelogenous leukemia with isocitrate dehydrogenase 1 and 2 mutations. J Exp Med. 2010;207:339–344. doi: 10.1084/jem.20092506. [DOI] [PMC free article] [PubMed] [Google Scholar]
- 11.Janin M, Mylonas E, Saada V, et al. Serum 2-hydroxyglutarate production in IDH1- and IDH2-mutated de novo acute myeloid leukemia: A study by the Acute Leukemia French Association group. J Clin Oncol. 2014;32:297–305. doi: 10.1200/JCO.2013.50.2047. [DOI] [PubMed] [Google Scholar]
- 12.Takahashi N, Boysen G, Li F, et al. Tandem mass spectrometry measurements of creatinine in mouse plasma and urine for determining glomerular filtration rate. Kidney Int. 2007;71:266–271. doi: 10.1038/sj.ki.5002033. [DOI] [PubMed] [Google Scholar]
- 13.Prensner JR, Chinnaiyan AM. Metabolism unhinged: IDH mutations in cancer. Nat Med. 2011;17:291–293. doi: 10.1038/nm0311-291. [DOI] [PubMed] [Google Scholar]
- 14.Borger DR, Goyal L, Yau T, et al. Circulating oncometabolite 2-hydroxyglutarate is a potential surrogate biomarker in patients with isocitrate dehydrogenase-mutant intrahepatic cholangiocarcinoma. Clin Cancer Res. 2014;20:1884–1890. doi: 10.1158/1078-0432.CCR-13-2649. [DOI] [PMC free article] [PubMed] [Google Scholar]
- 15.Fathi AT, Sadrzadeh H, Comander AH, et al. Isocitrate dehydrogenase 1 (IDH1) mutation in breast adenocarcinoma is associated with elevated levels of serum and urine 2-hydroxyglutarate. The Oncologist. 2014;19:602–607. doi: 10.1634/theoncologist.2013-0417. [DOI] [PMC free article] [PubMed] [Google Scholar]
- 16.Xu W, Yang H, Liu Y, et al. Oncometabolite 2-hydroxyglutarate is a competitive inhibitor of α-ketoglutarate-dependent dioxygenases. Cancer Cell. 2011;19:17–30. doi: 10.1016/j.ccr.2010.12.014. [DOI] [PMC free article] [PubMed] [Google Scholar]
- 17.Capper D, Simon M, Langhans CD, et al. 2-Hydroxyglutarate concentration in serum from patients with gliomas does not correlate with IDH1/2 mutation status or tumor size. Int J Cancer. 2012;131:766–768. doi: 10.1002/ijc.26425. [DOI] [PubMed] [Google Scholar]
- 18.Kranendijk M, Struys EA, Salomons GS, et al. Progress in understanding 2-hydroxyglutaric acidurias. J Inherit Metab Dis. 2012;35:571–587. doi: 10.1007/s10545-012-9462-5. [DOI] [PMC free article] [PubMed] [Google Scholar]
- 19.Hagos Y, Krick W, Braulke T, et al. Organic anion transporters OAT1 and OAT4 mediate the high affinity transport of glutarate derivatives accumulating in patients with glutaric acidurias. Pflugers Arch. 2008;457:223–231. doi: 10.1007/s00424-008-0489-2. [DOI] [PubMed] [Google Scholar]
- 20.Kaufhold M, Schulz K, Breljak D, et al. Differential interaction of dicarboxylates with human sodium-dicarboxylate cotransporter 3 and organic anion transporters 1 and 3. Am J Physiol Renal Physiol. 2011;301:F1026–F1034. doi: 10.1152/ajprenal.00169.2011. [DOI] [PubMed] [Google Scholar]
- 21.Marenzi G, Lauri G, Assanelli E, et al. Serum to urinary sodium concentration ratio is an estimate of plasma renin activity in congestive heart failure. Eur J Heart Fail. 2002;4:597–603. doi: 10.1016/s1388-9842(02)00097-1. [DOI] [PubMed] [Google Scholar]
- 22.Dubbink HJ, Taal W, van Marion R, et al. IDH1 mutations in low-grade astrocytomas predict survival but not response to temozolomide. Neurology. 2009;73:1792–1795. doi: 10.1212/WNL.0b013e3181c34ace. [DOI] [PubMed] [Google Scholar]
- 23.Sanson M, Marie Y, Paris S, et al. Isocitrate dehydrogenase 1 codon 132 mutation is an important prognostic biomarker in gliomas. J Clin Oncol. 2009;27:4150–4154. doi: 10.1200/JCO.2009.21.9832. [DOI] [PubMed] [Google Scholar]
- 24.Wick W, Hartmann C, Engel C, et al. NOA-04 randomized phase III trial of sequential radiochemotherapy of anaplastic glioma with procarbazine, lomustine, and vincristine or temozolomide. J Clin Oncol. 2009;27:5874–5880. doi: 10.1200/JCO.2009.23.6497. [DOI] [PubMed] [Google Scholar]
- 25.Weller M, Felsberg J, Hartmann C, et al. Molecular predictors of progression-free and overall survival in patients with newly diagnosed glioblastoma: A prospective translational study of the German Glioma Network. J Clin Oncol. 2009;27:5743–5750. doi: 10.1200/JCO.2009.23.0805. [DOI] [PubMed] [Google Scholar]
- 26.Rohle D, Popovici-Muller J, Palaskas N, et al. An inhibitor of mutant IDH1 delays growth and promotes differentiation of glioma cells. Science. 2013;340:626–630. doi: 10.1126/science.1236062. [DOI] [PMC free article] [PubMed] [Google Scholar]