Summary
The proliferation of genetically modified mouse models has exposed phenotypic variation between investigators and institutions that has been challenging to control1-5. In many cases, the microbiota is the presumed culprit of the variation. Current solutions to account for phenotypic variability include littermate and maternal controls or defined microbial consortia in gnotobiotic mice6,7. In conventionally raised mice, the microbiome is transmitted from the dam2,8,9. Here we show that microbially–driven dichotomous fecal IgA levels in WT mice within the same facility mimic the effects of chromosomal mutations. We observed in multiple facilities that vertically-transmissible bacteria in IgA-Low mice dominantly lowered fecal IgA levels in IgA-High mice after cohousing or fecal transplantation. In response to injury, IgA-Low mice showed increased damage that was transferable by fecal transplantation and driven by fecal IgA differences. We found that bacteria from IgA-Low mice degraded the secretory component (SC) of SIgA as well as IgA itself. These data indicate that phenotypic comparisons between mice must take into account the non-chromosomal hereditary variation between different breeders. We propose fecal IgA as one marker of microbial variability and conclude that cohousing and/or fecal transplantation enables analysis of progeny from different dams.
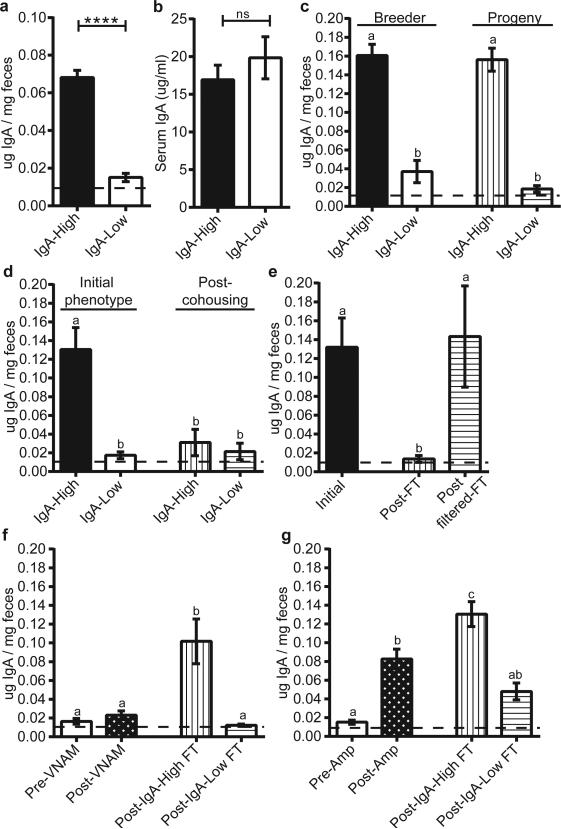
We chose to study the role of secretory Immunoglobulin A (SIgA), which is a critical intersection between the host immune system and the microbiota10. While interrogating baseline intestinal IgA levels in WT C57BL/6J (B6) mice, we observed a binary phenotype in fecal IgA levels between cages (Fig. 1a): those with high fecal IgA (defined as 0.05-0.25 μg IgA/mg feces), and those with nearly undetectable fecal IgA (hereafter designated IgA-High and IgALow mice). We observed this differential IgA phenotype in two separate facilities at our institution in independently derived WT B6 colonies (Extended Data Fig. 1a). While both facilities are specific pathogen-free, the protocols, access and personnel are distinct. All experiments were performed in both facilities unless otherwise noted. Despite the profound difference in fecal IgA, serum IgA levels were similar between these two groups, suggesting a gut-specific effect (Fig. 1b). The binary phenotype was passed from breeders to progeny, indicating a vertically transmissible phenotype (Fig. 1c). Furthermore, this phenotype was laterally transferable by cohousing IgA-High and IgA-Low mice. Remarkably, both IgA-High and IgA-Low mice were found to be IgA-Low post-cohousing (Fig. 1d). This result also occurred by cross-transfer experiments involving fecal transplantation between mice in our two facilities (Extended Data Fig. 1b-c). Hence, the IgA-Low phenotype was dominant, indicating that fecal IgA levels can be regulated by suppression and not only induction.
Figure 1. Low fecal IgA in WT mice is a vertically and horizontally transferable, dominant phenotype driven by ampicillin-sensitive bacteria.
a, b, Fecal (a) and serum IgA (b) by ELISA. Mann-Whitney test: (a) P<0.0001, n=40(IgA-High), n=34(IgA-Low) mice; (b) P=0.4704, n=12/group. c, Fecal IgA from IgA-High(n=10) and IgA-Low(n=11) breeders and their adult progeny [IgA-High(n=12), IgA-Low(n=9)]. d, Fecal IgA pre-[(IgA-High(n=9), IgA Low(n=11)] and post-cohousing [IgA-High(n=8), IgA-Low(n=10)]. One-way ANOVA: (c) F=45.95, P<0.0001; (d) F=15.56, P<0.0001. e, Fecal IgA from IgA-High mice pre-(n=18) and post-fecal transplant (FT) with unfiltered (Post-FT, n=13) or 0.45μm-filtered fecal material (Post-filter FT, n=5) from IgA-Low mice. f, g, Fecal IgA of post-FT mice pre-treated with (f) VNAM or (g) ampicillin (Amp). One-way ANOVA: (e) F=5.685, P=0.0076; (f) F=16.15, P<0.0001, n=16(Pre-VNAM), n=18(Post-VNAM), n=9(Post-IgA-High FT), n=8(Post-IgA-Low FT); (g) F=22.96, P<0.0001, n=22(Pre-Amp), n=28(Post-Amp), n=12(Post-IgA-High FT), n=12(Post-IgA-Low FT). All values=mean±s.e.m. Different letters indicate significant differences, Tukey's multiple comparison test. Dotted lines=limit of detection.
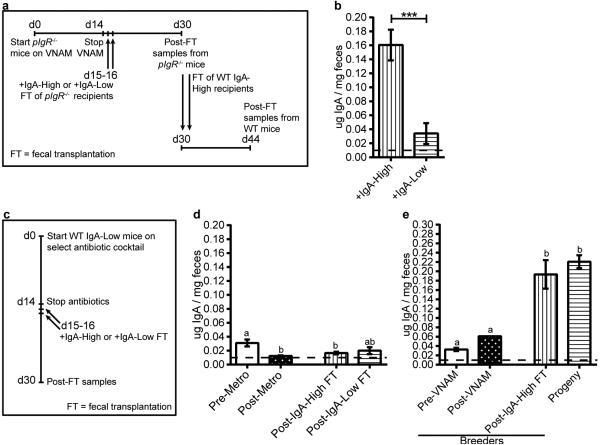
We next passaged microbes through polymeric Ig receptor mutant (pIgR−/−) mice which lack the ability to transport IgA into the lumen11. This experiment allowed us to test if the stability of the fecal microbiome creating this binary phenotype requires the presence of fecal SIgA (Extended Data Fig. 2a). Fecal samples from pIgR−/− mice transplanted with IgA-Low material conferred the IgA-Low phenotype to IgA-High WT mice (Extended Data Fig. 2b). Thus, exposure to a novel environment lacking SIgA (the pIgR−/− intestine) did not affect the ability of the fecal microbiota to regulate the IgA-High versus IgA-Low phenotype.
Because commensal bacteria and viruses modulate mucosal IgA12,13, we transplanted IgA-High mice with IgA-Low fecal material filtered to remove large microbes (e.g. bacteria, fungi). Mice transplanted with filtrate remained IgA-High, while mice transplanted with unfiltered material became IgA-Low (Fig. 1e), implicating intestinal microbes and excluding filterable viruses.
To determine if specific microbial pools could induce the IgA-Low phenotype, we pre-treated IgA-Low mice with a broad-spectrum antibiotic cocktail (vancomycin, neomycin, ampicillin, and metronidazole; VNAM), then performed fecal transplant from IgA-High or IgA-Low mice (Extended Data Fig. 2c). Transplantation with IgA-High microbes increased fecal IgA, indicating that VNAM eliminated IgA-Low-associated microbes (Fig. 1f). We found that ampicillin but not metronidazole was sufficient to reverse the IgA-Low phenotype, indicating ampicillin-sensitive microbe(s) were responsible for the IgA-Low phenotype (Fig. 1g, Extended Data Fig. 2d). Unlike VNAM, ampicillin treatment reversed the IgA-Low phenotype without transplantation, suggesting VNAM eliminated both IgA-suppressive and IgA-inductive microbes while ampicillin eliminated only IgA-suppressive microbes (Fig. 1f-g). We assessed whether the fecal IgA status of treated mice was vertically transmissible, and found that VNAM-treated IgA-Low mice transplanted with IgA-High samples gave rise to IgA-High progeny (Extended Data Fig. 2e). Taken together, these results support a model where the IgA-Low phenotype is bacterially-driven, transmissible, and dominant.
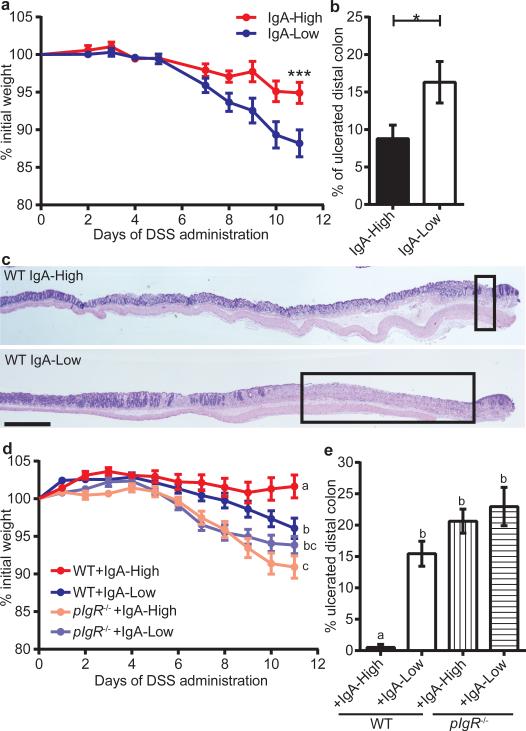
Previous studies have shown that pIgR−/− mice are more susceptible to dextran sodium sulfate (DSS) injury14,15. With DSS treatment, IgA-Low mice lost significantly more weight than their IgA-High counterparts (Fig. 2a), and exhibited increased distal colon ulceration (Fig. 2b-c). This DSS sensitivity could be secondary to diminished SIgA or altered microbial composition.
Figure 2. The IgA-Low phenotype alters susceptibility to DSS in an IgA-dependent manner.
a-c, DSS treatment of IgA-High/IgA-Low mice; (a) percent initial weight, (b) percentage of ulcerated distal colon, (c) representative H&E-stained histologic sections of IgA-High(n=10) and IgA-Low(n=11) mice. d, e, DSS treatment of WT and pIgR−/− mice after VNAM treatment +IgA-High/IgA-Low fecal transplant; (d) percent initial weight, (e) percentage of ulcerated distal colon. Two-way repeated measures ANOVA: (a) column factor P=0.0285; P<0.001, Sidak's multiple comparisons test, final timepoint, IgA-High(n=10) and IgALow(n=11) mice; (d) column factor P<0.0001, n=15(WT+IgA-High), n=18(WT+IgA-Low), n=20(pIgR−/−+IgA-High), n=21(pIgR−/−+IgA-Low); Tukey's multiple comparison test, final timepoint. Unpaired t-test: (b) P=0.0385, IgA-High(n=10), IgA-Low(n=11) mice. One-way ANOVA: (e) F=8.272, P=0.0007, n=3(WT+IgA-High), n=6(WT+IgA-Low), n=8(pIgR−/−+IgA- High), n=10(pIgR−/−+IgA-Low). All values=mean±s.e.m. Different letters indicate significant differences, Tukey's multiple comparison test. Bars=1 mm; boxeg=mlcerated areas.
To address these possibilities, we re-colonized WT and pIgR−/− mice with IgA-High or IgA-Low fecal material after VNAM treatment (Extended Data Fig. 2a) prior to DSS treatment (Extended Data Fig. 3a). As expected, WT+IgA-Low mice showed enhanced DSS sensitivity compared to WT+IgA-High mice (Fig. 2d-e, Extended Data Fig. 3b). We observed increased weight loss and colonic ulceration in pIgR−/− mice compared to WT mice, a finding consistent with previous reports14,15. Interestingly, this sensitivity was independent of IgA-Low microbes, as pIgR−/− mice colonized with IgA-High or IgA-Low microbes had no significant differences in weight loss or ulceration (Fig. 2d-e, Extended Data Fig. 3b). This finding implied that altered SIgA levels, and not the microbes themselves, caused increased DSS damage in WT+IgA-Low mice.
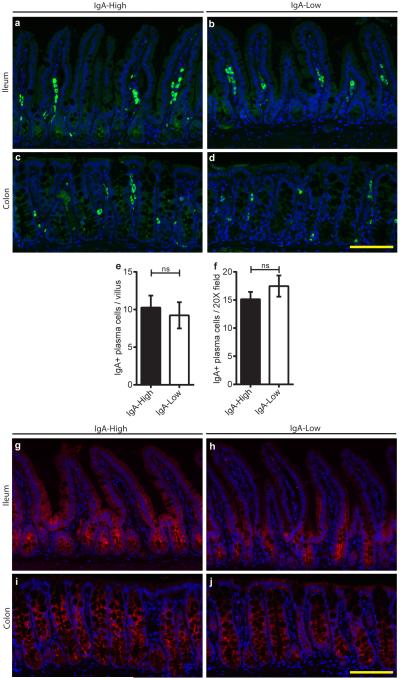
To study the mechanism by which IgA-Low microbes suppress fecal IgA, we assessed IgA production and transport capacity by pIgR in IgA-High versus IgA-Low mice. We found no difference in lamina propria plasma cell numbers between these mice (Extended Data Fig. 4a-f), nor in immunofluorescence staining for pIgR (Extended Data Fig. 4g-j).
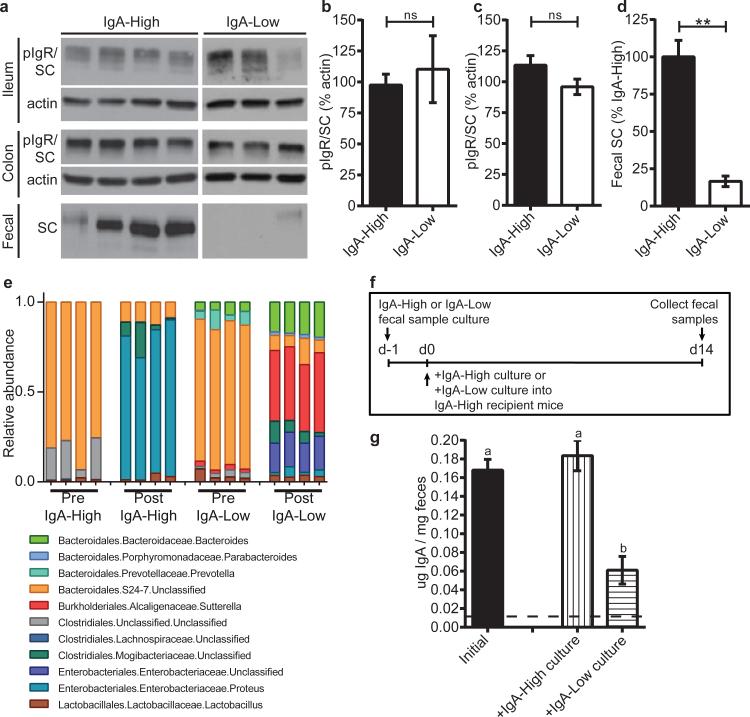
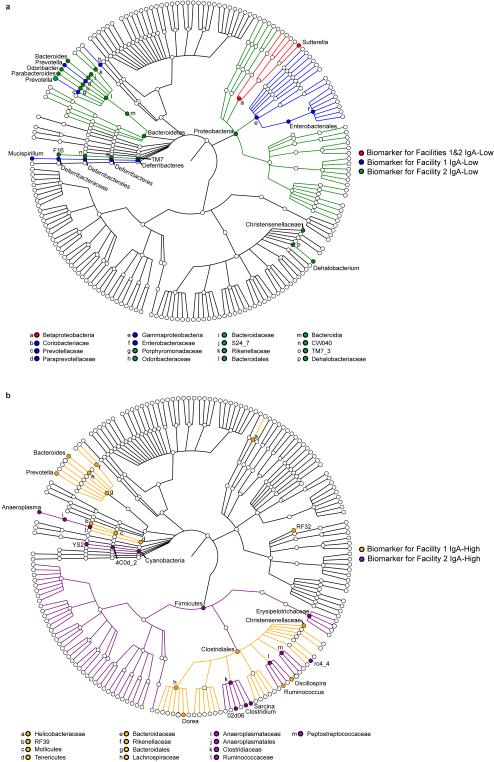
On the apical surface of intestinal epithelial cells, pIgR is cleaved and the extracellular portion is released into the lumen bound to its ligand (multimeric immunoglobulins containing the J chain, such as dimeric IgA)16. This cleaved form of pIgR, called bound secretory component (SC) when complexed in SIgA, helps protect dimeric IgA from degradation by bacterial proteases17,18. We hypothesized that low SIgA levels were secondary to SC degradation. By immunoblotting for pIgR/SC in fecal samples and whole tissue, we found that IgA-High and IgA-Low mice had comparable tissue pIgR levels (Fig. 3a-c), but IgA-Low mice had reduced fecal SC (Fig. 3a,d). To identify potential microbe(s) responsible for enhanced SC degradation in IgA-Low mice, we performed 16S rDNA sequencing of IgA-High and IgA-Low fecal samples. Comparison of samples within individual facilities revealed taxonomic biomarkers associated with fecal IgA levels (Extended Data Fig. 5a-b, Extended Data Table 1). The only genus-level IgA-Low biomarker common to both facilities was Gram-negative fecal anaerobe Sutterella19 (Extended Data Fig. 5a, Extended Data Fig. 6, Extended Data Table 1). We grew anaerobic cultures with fecal inoculum from IgA-High and IgA-Low mice, which enriched for Sutterella in IgA-Low-derived samples (Fig. 3e, Extended Data Table 2). When administered to IgA-High recipients, IgA-High cultures maintained the IgA-High phenotype, while IgA-Low cultures converted mice to the IgA-Low phenotype, indicating causative IgA-Low microbes were culturable in these conditions (Fig. 3f-g). From these results, we concluded the IgA-Low-inducing microbes may include Sutterella species.
Figure 3. The IgA-Low phenotype correlates with an absence of fecal SC and the presence of specific microbial taxa in vivo, which can be anaerobically cultured in vitro.
a, Representative anti-pIgR/SC immunoblots (of n=3 replicates) of intestinal tissue/fecal samples from IgA-High/IgA-Low mice. b-d, Quantification of immunoblots for (b) ileal, (c) colonic, and (d) fecal pIgR/SC. Mann-Whitney test: (b) P=0.7424, n=7(IgA-High), n=5(IgA-Low) mice; (c) P=0.1285, n=10(IgA-High), n=15(IgA-Low) mice; (d) P=0.0025, n=7(IgA-High), n=5(IgALow) mice. e, Relative abundance of Order/Family/Genus 16S rDNA sequence assignments of culture inoculate from IgA-High/IgA-Low samples (Pre) or overnight cultures of these inoculates (Post); n=4 samples/group. Statistical analysis: Extended Data Table 2. f, Schematic of culturing/administration experiments. g, Fecal IgA measured in IgA-High mice pre-(n=18) and post-cultured microbe administration [+IgA-High culture(n=10), +IgA-Low culture(n=9)] depicted in (f). One-way ANOVA: F=18.60, P<0.0001. All values=mean±s.e.m. Different letters indicate significant differences, Tukey's multiple comparison test. Dotted lines=limit of detection.
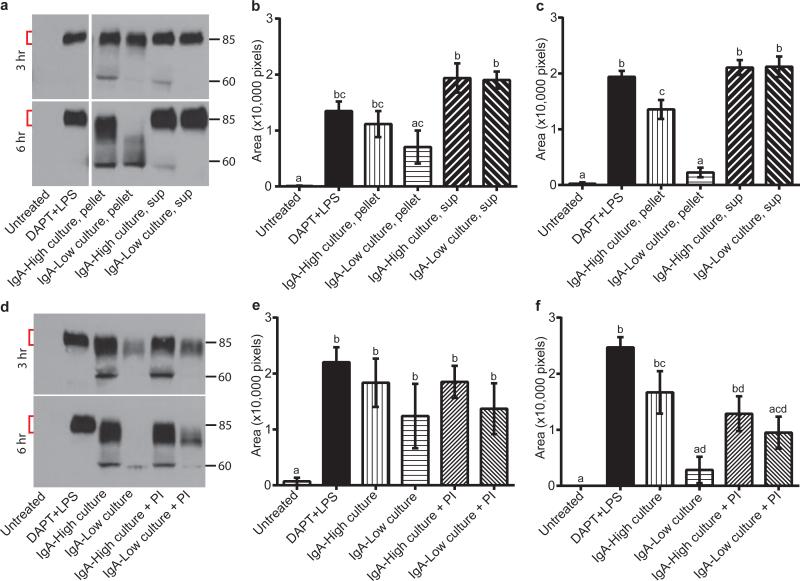
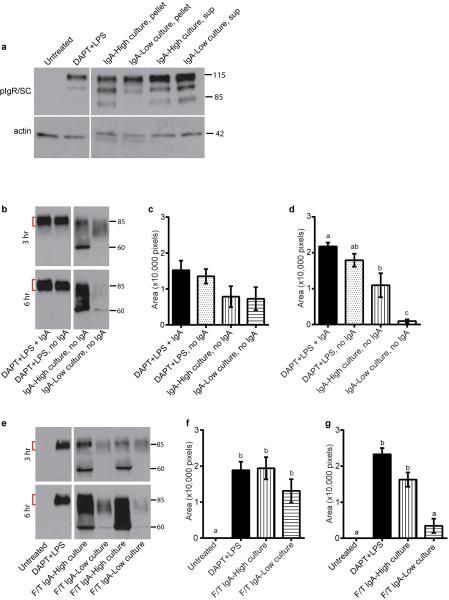
We next employed cultured microbes to explore the mechanism of SC degradation. We generated polarized, differentiated monolayers of primary intestinal epithelial cells in Transwells20 and assessed dimeric IgA transport from the basolateral to the apical compartment. Treatment with γ-secretase inhibitor DAPT and LPS robustly induced pIgR in these cells (Extended Data Fig. 7a), which is necessary for IgA transport across the epithelium. After addition of IgA to the basal compartment, we detected SC in the apical supernatant of DAPT+LPS-treated cells (Fig 4a-c). We co-cultured monolayers with either pelleted bacteria or culture supernatants from IgA-High or IgA-Low cultures in the apical compartment (Fig. 4a-c). In co-cultures with IgA-High pelleted bacteria, we detected SC in apical supernatants at three and six hours with evidence of limited degradation, while co-cultures with IgA-Low pelleted bacteria exhibited substantially greater SC degradation at six hours. This SC degradation did not depend on the presence of IgA as free SC was also degraded by IgA-Low microbes (Extended Data Fig. 7b-d). Incubation of monolayers with IgA-High/IgA-Low culture supernatants did not cause SC degradation (Fig. 4a-c). SC level differences were not due to differential epithelial cell pIgR expression (Extended Data Fig. 7a). Freeze/thaw (F/T) of IgA-Low cultures also led to SC degradation, indicating that live bacteria were not necessary (Extended Data Fig. 7e-g). Taken together, these data suggest bacteria in the IgA-Low microbiota degrade free and bound SC in vitro (Fig. 4a-c), consistent with our observation of absent fecal SC in vivo (Fig. 3a,d). Addition of a broad-spectrum protease inhibitor cocktail partially prevented SC degradation, implicating proteases in this process (Fig. 4d-f). These findings are consistent with a model in which degradation of bound SC of SIgA by IgA-Low microbes makes the IgA portion more susceptible to proteolysis. Bacteria make proteases that can cleave human IgA1/IgA2 and SC, though this to our knowledge has not been addressed in murine models21,22. In addition to SC degradation, we found that fecal IgA was degraded and thus decreased after co-culture with IgA-Low microbes, consistent with our initial in vivo observations (Extended Data Fig. 8a-b). In the future it will be of interest to identify the protease(s) involved in the degradation of SC and/or IgA, and to look for additional host substrates of these proteases.
Figure 4. Culturable anaerobic bacteria present in IgA-Low samples degrade SC.
a-c, IgA transcytosis assay with primary intestinal epithelial Transwell monolayers apically treated with pelleted/supernatant fraction of IgA-High/IgA-Low cultures. SC in apical supernatants was measured by anti-SC immunoblots. Representative anti-SC immunoblot (a) and quantification of undegraded SC (red brackets) at 3h (b) and 6h (c). d-f, Transwell monolayers treated as in (a-c), with protease inhibitor (PI) cocktail added to IgA-High/IgA-Low cultures (pelleted bacterial fraction). Representative anti-SC immunoblot (d) and quantification of undegraded SC at 3h (e) and 6h (f). One-way ANOVA: (b) F=11.11, P<0.0001, n=5 experiments, 3 containing “sup” samples; (c) F=54.83, P<0.0001, n=5; (e) F=3.830, P=0.0263, n=3; (f) F=12.07, P=0.0002, n=3. All values=mean±s.e.m. Different letters indicate significant differences, Tukey's multiple comparison test.
This study shows that phenotypic effects can be vertically transmitted through the microbiome which can mimic alterations of host genes. To distinguish host genetic from extra-chromosomal effects, ideally mice must be bred so that comparisons can be performed between WT and mutated mice that have equivalent microbial exposure. Hence, breeding mice that are heterozygous for a given mutation is critical even for the study of extra-intestinal phenotypes23,24. Secondary options are fecal transplantation and cohousing. These can serve as methodological controls for phenotypic variation dependent on extra-chromosomal factors that may be easily transmissible between hosts. Lastly, fecal IgA serves as a readily measurable marker that can be compared within and between facilities/institutions to compare phenotypic differences.
Methods
Mice
Animal protocols were approved by the Washington University Animal Studies Committee. All mice were maintained in one of two specific pathogen-free barrier facilities, with different procedures for maintaining food, water, and caging. In Facility 2 (Specialized Research Facility), complete cages (including food, bedding, isolator top, wires, and cage) are autoclaved after assembly, water is autoclaved and kept sterile, and a higher concentration of disinfectant is used (1:5:1 Clidox, Pharmacal Research Laboratories, Inc.). Facility 1 (Clinical Sciences Research Building facility) also uses autoclaved cage components but cages are assembled after autoclaving. The food is irradiated but not autoclaved, and a lower concentration of disinfectant is used (1:18:1 Clidox).
For Facility 2, C57BL/6J WT mice were originally obtained from Jackson Laboratories (stock #000664) and maintained as a breeding colony. For Facility 1, multiple sources of C57BL/6J WT mice were utilized to create breeding colonies. Within our WT mouse colonies, multiple IgA- High and IgA-Low breeders were identified and maintained as independent lines. The polymeric immunoglobulin receptor (pIgR) knockout mice (B6.129P2-Pigrtm1Fejo/Mmmh11) were initially obtained from Mutant Mouse Regional Resource Center and were backcrossed to 98.4% C57BL/6J. Male and female mice between 2-6 months of age were used, and fecal samples were only collected after mice were at least 8 weeks of age. Sample sizes used for studies reflect the number of mice needed for three independent experiments with at least two mice used per group in each experiment, and n reflects individual mice that were unique biological replicates. For animal studies, mice were confirmed to be IgA-High or IgA-Low prior to subsequent experimental manipulation.
Mouse treatments
For cohousing studies, mice were cohoused 1:1 for 14 days. For fecal transplantation, fecal samples were collected from mice and resuspended in sterile PBS to a final concentration of 200 mg ml−1 by weight. Mice were orally administered 25 μl of the fecal mixture on two consecutive days.
Antibiotic treatments included 0.5 mg ml−1 vancomycin, 1mg ml-1 neomycin, 1mg ml−1 ampicillin, and 1mg ml−1 metronidazole (Sigma); VNAM indicates the cocktail for these combined antibiotics25.
For dextran sodium sulfate (DSS) experiments, 2.5% DSS (TdB Consultancy) was administered in drinking water for 11 days. Mice were weighed daily and sacrificed at 70% of initial body weight if needed. Intestines were taken for histology. All mice used in DSS experiments were from Facility 2.
Preparation of fecal samples for enzyme linked immunosorbent assay (ELISA) and immunoblotting
Fecal samples were collected from mice and resuspended in sterile PBS to a final concentration of 100 mg ml-1 by weight. Supernatants were collected and stored at −20°C until needed.
Preparation of fecal samples for bacterial culture
Fecal samples were collected from mice and resuspended in sterile PBS to a final concentration of 200 mg ml-1 by weight. 250μl of this mixture was used to inoculate anaerobic chopped meat broth in Hungate tubes (Fisher Scientific) for overnight culturing in a 37°C shaking incubator26. Individual culture samples reflect unique biological replicates. For culture administration to mice, 25 μl was orally administered for two consecutive days. The fecal suspensions as well as the overnight cultures were used in epithelial co-culture experiments described below.
16S rDNA Illumina sequencing and analysis
Fecal pellets (individual biological replicates) were collected into 2-ml tubes (Sarstedt) with 1 mM diameter zirconia/silica beads (Biospec). 500μL each of Phenol:Chloroform:IAA (25:24:1, pH 8.0) (Fisher) and Buffer A (200mM NaCl, 200mM Tris, 20mM EDTA) were added to the samples, as well as 210μL of 20% SDS, and samples were homogenized for 1 minute at maximum speed with a MiniBeadBeater24 (Biospec). Samples were centrifuged for 5 minutes at maximum speed, the aqueous phase was transferred and added to 500μL of Phenol:Chloroform:IAA and gently mixed, and samples were recentrifuged. The aqueous phase was added to 500μL of isopropanol, stored at −80°C for 20 minutes, and spun at maximum speed at 4°C for 20 minutes. The resulting pellet was then washed with 100% ethanol, and resuspended in 50uL of water. 25μL of the sample was then cleaned with the 96-well format DNeasy Blood & Tissue Kit (Qiagen) according to the manufacturer's instructions, and purified DNA samples were resupended at 25ng/μL. For DNA purification from bacterial culture inoculate and anaerobic bacterial cultures (all individual biological replicates), the QIAamp DNA mini kit (Qiagen) was used according to the manufacturer's protocol. Primer selection and polymerase chain reaction (PCR) was performed similarly to that described previously27. Briefly, each sample was amplified in triplicate, combined, and confirmed by gel electrophoresis, with Golay-barcoded primers specific for the V4 region (F515/R806). PCR solutions contained 18.8μL RNase/DNase-free water, 2.5μL 10X High Fidelity PCR Buffer (Invitrogen), 0.5μL 10 mM dNTPs, 1μL 50 mM MgSO4, 0.5μL each of the forward and reverse primers (10 μM final concentration), 0.1μL Platinum High Fidelity Taq (Invitrogen) and 1.0μL genomic DNA. Reactions were held at 94°C for 2 min to denature the DNA, with amplification proceeding for 26 cycles at 94°C for 15s, 50°C for 30s, and 68°C for 30s; a final extension of 2 min at 68°C was added to ensure complete amplification. Amplicons were pooled and purified with 0.6x Agencourt Ampure XP beads (Beckman-Coulter) according to the manufacturer's instructions. The final pooled samples, along with aliquots of the three sequencing primers, were sent to the Center for Genome Sciences (Washington University School of Medicine) for sequencing by the 2×250bp protocol with the Illumina MiSeq platform.
16S sequence analysis was performed with QIIME (Quantitative Insights Into Microbial Ecology, version 1.8.0)28. Raw sequence fastq files were quality filtered and demultiplexed with the following criteria: the maximum number of consecutive low quality base calls allowed was 3, the minimum number of consecutive high quality base calls must be greater than 75% of the input sequence length, the PHRED quality threshold was set to 19, and reverse-complement mapping barcodes were used. Closed reference operational taxonomic units (OTUs) sharing 97% identity were clustered with the UCLUST algorithm29 and assigned taxonomy according to the Greengenes database (version 13.8)30. Fecal samples were rarefied to 1000 sequences for subsequent analyses and culture/culture inoculate samples were rarefied to 5000 sequences. For culture/culture inoculate samples, a minimum relative abundance of 0.005 in at least one sample was set to filter out very rare OTUs before subsequent analysis.
Relative OTU abundance data was input into LEfSe to determine biomarkers with significant Linear Discriminant Analysis (LDA) effect size31. Biomarkers for Facility 1 and for Facility 2 alone were identified by comparison of samples within each facility. Biomarkers for Facilities 1&2 were identified by comparison of samples from both facilities. After Kruskal-Wallis analysis (with an alpha-value of 0.05) of all features, an LDA model was used to rank discriminant features by the effect size with which they differentiate classes. The threshold for logarithmic LDA score for discriminative features was set at 2.0. Biomarkers were graphically annotated on a taxonomic tree with GraPhlAn (publicly available at http://huttenhower.sph.harvard.edu/graphlan).
Primary intestinal epithelial cell culture
Primary colonic epithelial stem cells were isolated, grown, and maintained as 3D spheroid cultures in Matrigel (BD Biosciences) as described previously32,33. Cells were kept in 50% L-WRN conditioned media (CM). Media were changed every two days, and cells were passaged every three days (1:3 split). Primary intestinal epithelial cell monolayers were formed as described previously20. Briefly, spheroids were recovered from three-day-old 3D Matrigel cultures, trypsinized, dissociated to single cells by vigorous pipetting, and re-suspended in 50% L-WRN CM containing 10 μM Y-27632 (R&D Systems). These cells were plated in Transwell inserts (Corning Costar) coated with 1 mg ml−1 gelatin. Each individual experiment using the colonic epithelial stem cells reflects unique biological replicates.
Cell treatments
On day one (24 hours after seeding the Transwells) the 50% L-WRN CM supplemented with Y-27632 was removed and replaced with 0% CM (Advanced DMEM/F12 containing 20% fetal bovine serum (FBS), 100 units of Penicillin, 0.1 mg ml−1 Streptomycin and 2mM L-glutamine). At this time, any additional treatments were also administered to the cells: 1 μg ml−1 LPS (Sigma), and 10 μM DAPT (N-[N-(3,5-Difluorophenacetyl)-L-alanyl]-S-phenylglycine t-butyl ester) γ-secretase inhibitor (Millipore). Cells were given fresh media with the respective treatments on day two, and were treated for a total of 48 hours before being used for transcytosis of dimeric IgA on day three.
IgA transcytosis assay
On day three, the Transwells were removed from the various treatment conditions, and switched to base media (Advanced DMEM/F12 supplemented with 2mM L-glutamine only; no FBS, no antibiotics). 600μl of base media containing 3μg of mouse IgA (BD Pharmingen) was added to the lower compartment (final concentration of IgA = 5μg ml−1). In some experiments, 600μl of base media alone (no IgA) was added to the lower compartment. 100 μl of base media (with or without various treatments) was added to the upper compartment. Treatments included 1/10 fecal bacterial suspensions (bacterial pellet or supernatant fractions), 1/10 overnight anaerobic chopped meat bacterial cultures (live or freeze/thawed), and 1X Roche cOmplete protease inhibitor cocktail (Roche). The apical supernatant or cells were collected at 3 or 6 hours to evaluate the amount of pIgR/SC by immunoblotting or IgA by ELISA (Immunology Consultants Labs). Each experiment reflects unique biological replicates.
Immunostaining and histologic analysis
For whole tissue immunostaining, mouse colons were harvested and prepared as previously described34. 5μm thick transverse sections were cut for hematoxylin and eosin staining and immunostaining. For this procedure, the sections were de paraffinized, hydrated, boiled in Trilogy solution (Cell Marque) for 20 minutes, rinsed in PBS, blocked with 10 mg ml−1 bovine serum albumin/0.1% Triton-X100 for 30 minutes, and incubated with primary antibody at 4°C overnight. Primary antibodies include: goat anti-mouse pIgR (1/500, R&D Systems, catalog #AF2800) and goat anti-mouse IgA-AlexaFluor488 (1/200, Serotec, catalog #STAR137F). The slides were rinsed three times in PBS and incubated with AlexaFluor594-conjugated species-specific secondary antibody for one hour at room temperature (1/500, Invitrogen, catalog #A11058) if needed. Slides were washed three times in PBS and stained with bis-benzimide/Hoechst (Invitrogen) to visualize nuclei and mounted with a 1:1 PBS:glycerol solution. Staining was visualized with a Zeiss Axiovert 200 microscope with an Axiocam MRM digital camera.
Immunoblotting
Protein was isolated from intestinal tissue segments of ~1cm in 500 μl RIPA buffer with protease inhibitors with the Fastprep bead-beater system (MP Bio, BioSpec). Samples were subjected to 4 rounds of lysis at speed 6 for 20 seconds at 4°C. Primary intestinal epithelial cells were lysed in Transwells with 50 μl RIPA buffer with protease inhibitors (Sigma). Total protein was quantified by Pierce BCA Protein Assay Kit (Thermo Scientific). Supernatants from fecal samples and Transwells were taken as described above. Samples were run on SDS- PAGE gels (AnykD or 7.5% Mini-Protean TGX gels, Bio Rad) and transferred onto nitrocellulose membrane (Bio Tris-Rad). Membranes were blocked with 3% milk in 0.1% Tween-20 tris-buffered saline for 1 h at room temperature and probed with goat IgG anti-pIgR/SC (R&D, catalog #AF2800) and rabbit IgG anti-Actin (Sigma, catalog #A2066) overnight at 4°C. Blots were incubated for 1 h with horseradish peroxidase conjugated secondary antibodies (Invitrogen catalog #A16005, BioRad catalog #170-6515) before development with the SuperSignal West Dura chemiluminescent kit (Thermo Scientific). Immunoblots were quantified by ImageJ software35. Whole tissue pIgR/SC was normalized to actin, fecal samples were normalized by weight as described above, and apical supernatants were normalized by volume.
Statistical analysis and experimental design
Statistical significance between two groups was determined by unpaired Student's t-test if the data passed the D'Agostino-Pearson normality test or by Mann-Whitney test if the data did not pass the normality test. P-value calculations were two-tailed. Comparison of more than two groups was performed with One-way analysis of variance (ANOVA) followed by Tukey's multiple comparisons test, or Two-way repeated measures ANOVA in Prism GraphPad Software. Methods and P-values are detailed in figure legends. Additional details of 16S rDNA analysis are included in the “16S rDNA Illumina sequencing and analysis” section above. n refers to number of mice per group unless otherwise noted. All samples reflect unique biological replicates.
Inclusion of in vitro experiments was dependent upon expected performance of positive and negative controls. IgA ELISAs were performed blinded by a single investigator. Histological and immunofluorescence observations were performed blinded by two independent investigators. Samples were assessed in random order after being assigned numbers. Animals initially cohoused were randomly distributed to experimental groups, though no investigator blinding occurred during the execution of animal experiments.
Extended Data
Extended Data Figure 1. WT mice within two independent facilities exhibit binary fecal IgA levels, and the IgA-Low phenotype is transferable between these facilities.
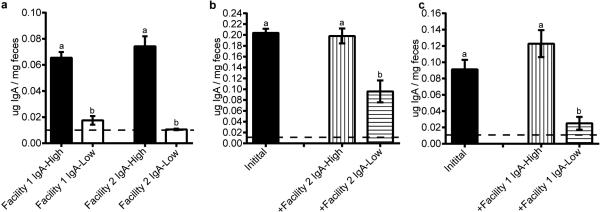
a, Fecal IgA (normalized to fecal weight) from mice housed in either Facility 1 (n=28 IgA-High and n=22 IgA-Low mice) or Facility 2 (n=12 mice/group) was detected by anti-mouse IgA ELISA. b-c, WT IgA-High mice from one mouse facility were transplanted with homogenized fecal material from WT IgA-High or IgA-Low mice from the other mouse facility, and fecal IgA was measured 14 days later by anti-mouse IgA ELISA. b, Facility 1 mice pre- (n=18 mice) and post-fecal transplantation with Facility 2 fecal samples (n=8 Post-IgA-High and n=10 Post-IgA-Low mice). c, Facility 2 mice pre- (n=10 mice) and post-fecal transplantation with Facility 1 fecal samples (n=4 Post-IgA-High and n=6 Post-IgA-Low mice). The dotted lines represent the limit of detection by ELISA. All values are indicated as mean±s.e.m. One-way ANOVA: (a) F=44.59, P<0.0001. (b) F=20.93, P<0.0001. (c) F=12.92, P=0.0004. Means with different letters are significantly different by Tukey's multiple comparison test.
Extended Data Figure 2. IgA-High and IgA-Low-associated microbes can be stably passaged through pIgR−/− recipients, and are vertically transmissible after recolonization.
a, Schematic for repopulation of pIgR−/− microbiota with WT IgA-High/IgA-Low samples, followed by fecal transplantation (FT) of pIgR−/− IgA-High or IgA-Low samples to WT IgA-High mice. b, Fecal IgA on day 44 depicted in (a). Mann-Whitney test: P=0.0006, n=8 mice/group. c, Experimental schematic of antibiotic treatment and transplant protocol for (d) and Figure 1f-g. d, Fecal IgA of post-FT mice on day 30 pre-treated with metronidazole (Metro). One-way ANOVA: F=6.525, P=0.0012, n=13(Pre-Metro), n=15(Post-Metro), n=8(Post-IgA-High FT), and n=5(Post-IgA-Low FT). All values are indicated as mean±s.e.m. e, IgA-Low mice converted to IgA-High from Figure 1f were mated, and fecal IgA of their adult progeny were measured. One-way ANOVA: F=18.29, P=0.0002, n=2 breeders, n=10 progeny from 4 litters. Different letters indicate significant differences by Tukey's multiple comparison test. Dotted lines: limit of detection.
Extended Data Figure 3. DSS effects on pIgR−/− mice are dependent on IgA and not microbes.
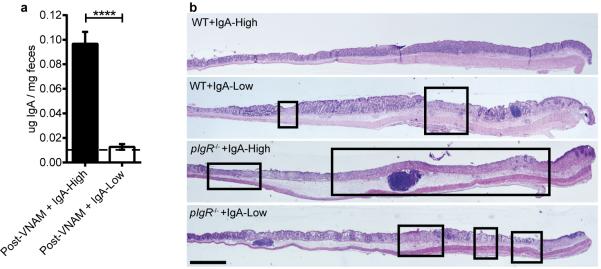
a, Fecal IgA levels were measured in WT mice from Figure 2d-e after vancomycin, neomycin, ampicillin, and metronidazole (VNAM) treatment and IgA-High/IgA-Low fecal transplantation (FT), prior to the start of DSS treatment. Statistical analysis by Mann-Whitney test: P=0.0006, n=7 mice per group. b, Representative H&E-stained histologic sections of WT and pIgR−/− mice from Figure 2d-e after 14 day VNAM treatment +IgA-High/IgA-Low FT. Representative of n=3(WT+IgA-High), n=6(WT+IgA-Low), n=8(pIgR−/−+IgA-High), and n=10(pIgR−/−+IgA-Low) mice. All values indicated as mean±s.e.m. Means with different letters are significantly different by Tukey's multiple comparison test. Dotted lines: limit of detection.
Extended Data Figure 4. Plasma cell numbers and pIgR expression are unchanged in the ileum and colon between IgA-High and IgA-Low mice.
a-d, Ileal and colonic sections from IgA-High and IgA-Low mice were stained with anti-IgA (green) and bis-benzamide dye (blue); representative 20X images are shown of n=10 (a,b,c) or n=9 mice (d). Bars = 100 μm. e, f, Quantification of ileal plasma cells per villus (e) and colonic plasma cells per 20X field (area = 1.5 × 105 μm2) (f) based on IgA staining. All values are indicated as mean±s.e.m. Statistical analysis by Mann-Whitney test: (e) P=0.5191, n=10 mice per group, and (f) P=0.3117, n=10 IgA-High and n=9 IgA-Low mice. g-j, Ileal and colonic sections from IgA-High and IgA-Low mice were stained with anti-pIgR/SC (red) and bis-benzamide dye (blue); representative images are shown (n=10 mice per group). Bars = 100 μm.
Extended Data Figure 5. 16S rDNA sequencing identifies biomarkers for IgA-Low and IgA-High samples.
a, b, LEfSe analysis31 of 16S rDNA sequencing of IgA-Low and IgA-High fecal samples from Facilities 1 and 2 identified statistically significant bacterial taxa biomarkers for (a) IgA-Low and (b) IgA-High samples. Biomarkers for Facility 1 and Biomarkers for Facility 2 alone were identified by comparison of IgA-High and IgA-Low samples within each facility. Biomarkers for Facilities 1&2 were identified by comparison of all IgA-High and IgALow samples from both facilities. No IgA-High biomarkers were identified when comparing all IgA-High and IgA-Low samples from both facilities. Biomarkers for the indicated groups are plotted as taxonomic trees with GraPhlAn (http://huttenhower.sph.harvard.edu/graphlan).n=13(Facility 1 IgA-High), n=14(Facility 1 IgA-Low), n=73(Facility 2 IgA-High), and n=68(Facility 2 IgA-Low) samples. Statistical analysis is shown in Extended Data Table 1.
Extended Data Figure 6. Sutterella is more abundant in IgA-Low samples than IgA-High samples in both facilities.

a-c, Relative abundance of sequences assigned by QIIME to the bacterial genus Sutterella from 16S rDNA analysis in (a) Facility 1 and (b) Facility 2. These results are summarized in (c). One-way ANOVA: F=12.85, P<0.0001. n=13(Facility 1 IgA- High), n=14(Facility 1 IgA-Low), n=73(Facility 2 IgA-High), and n=68(Facility 2 IgA-Low) samples. Values in (c) are indicated as mean±s.e.m. Means with different letters are significantly different by Tukey's multiple comparison test.
Extended Data Figure 7. IgA-Low cultured bacteria can degrade free SC in the absence of IgA, and SC-degrading properties of these bacteria are active after freeze/thaw.
Primary intestinal epithelial Transwell monolayers were pre-treated with 10 μM DAPT + 1μg ml−1 LPS on days 1 and 2 post-seeding to induce differentiation and pIgR expression. Some wells were left untreated as negative controls. On day 3 post-seeding, either 3 μg of normal mouse dimeric IgA or media alone was added to the lower compartment of the Transwells. Different subsets of the DAPT+LPS-treated Transwells were also treated with one of the following conditions in the apical compartment: IgA-High/IgA-Low bacterial cultures (pelleted bacterial or supernatant fraction), live or freeze/thawed (F/T) IgA-High/IgA-Low bacterial cultures (pelleted bacterial fraction). Apical Transwell supernatants were collected at 3h and 6h, and the amount of SC was measured by anti-SC immunoblot. a, Representative anti-pIgR/SC and anti-actin immunoblots of intestinal epithelial monolayers at 6h (one of three experiments). b-d, SC degradation in the absence of IgA. (b) Representative anti-SC immunoblot and quantification of undegraded SC (denoted by the red brackets) at 3 hours (c) and 6 hours (d) over 4 independent experiments by ImageJ. e-g, SC degradation by F/T bacterial cultures. (e) Representative anti-SC immunoblot and quantification of undegraded SC at 3 hours (f) and 6 hours (g) over 5 independent experiments by ImageJ. All values are indicated as mean±s.e.m. One-way ANOVA: (c) F=1.834, P=0.1831, n=4 independent experiments with DAPT+LPS, no IgA repeated 2 times; (d) F=23.96, P=0.0002, n=4 independent experiments with DAPT+LPS, no IgA repeated 2 times; (f) F=7.444, P=0.0045, n=5 independent experiments with Untreated and DAPT+LPS repeated 3 times; (g) F=31.53, P<0.0001, n=5 independent experiments with Untreated and DAPT+LPS repeated 3 times. Means with different letters are significantly different by Tukey's multiple comparison test.
Extended Data Figure 8. IgA-Low cultured bacteria can degrade IgA.
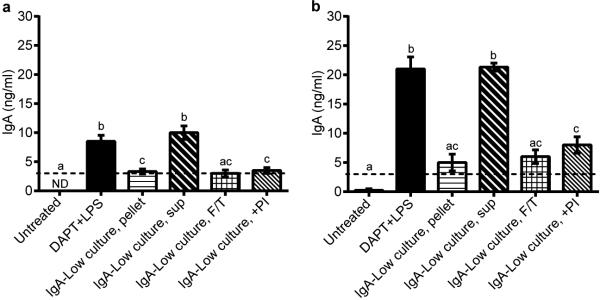
Primary intestinal epithelial cell monolayers were pre-treated with 10 μM DAPT + 1μg ml−1 LPS on days 1 and 2 post-seeding to induce differentiation and pIgR expression. Some wells were left untreated as negative controls. On day 3 post-seeding, 3 μg of normal mouse IgA was added to the lower compartment of the Transwells. Different subsets of the DAPT+LPS-treated Transwells were also treated with combinations of the following in the apical compartment: live IgA-Low bacterial cultures (either the pelleted bacterial or supernatant fraction), freeze/thawed (F/T) IgALow bacterial cultures, and a 1X protease inhibitor (PI) cocktail. Apical Transwell supernatants were collected at 3 hours (a) and 6 hours (b), and the amount of IgA was measured by anti-mouse IgA ELISA. The dotted lines represent the limit of detection by ELISA. All values are indicated as mean±s.e.m. One-way ANOVA: (a) F=26.32, P<0.0001, n=8(Untreated), n=8(DAPT+LPS), n=6(IgA-Low culture, pellet), n=3(IgA-Low culture, sup), n=4(IgA-Low culture, F/T), and n=4(IgA-Low culture, +PI); (b) F=35.57, P<0.0001, n=8(Untreated), n=8(DAPT+LPS), n=6(IgA-Low culture, pellet), n=3(IgA-Low culture, sup), n=3(IgA-Low culture, F/T), and n=4(IgA-Low culture, +PI). Means with different letters are significantly different by Tukey's multiple comparison test; ND, not detected.
Extended Data Table 1.
16S rDNA analysis of fecal samples from two facilities identified discriminant biomarkers between IgA-High and IgA-Low samples.
| All Sample Comparison |
Facility 1 Comparison |
Facility 2 Comparison |
|||||||
|---|---|---|---|---|---|---|---|---|---|
| LDA Effect Size | LDA Effect Size | LDA Effect Size | |||||||
| Discriminant Biomarker | (log 10) | P-value | IgA | (log 10) | P-value | IgA | (log 10) | P-value | IgA |
| Proteobacteria.Betaproteobacteria | 3.37952 | 4.28E-17 | Low | 3.35270 | 0.004907 | Low | 3.43121 | 1.9E-15 | Low |
| Proteobacteria.Betaproteobacteria.Burkholderiales.Alcaligenaceae.Sutterella | 3.35757 | 4.28E-17 | Low | 3.35295 | 0.004907 | Low | 3.39543 | 1.9E-15 | Low |
| Bacteroidetes.Bacteroidia.Bacteroidales.Bacteroidaceae | 3.81243 | 0.003826 | High | 3.46226 | 7.65E-05 | Low | |||
| Bacteroidetes.Bacteroidia.Bacteroidales.Bacteroidaceae.Bacteroides | 3.81243 | 0.003826 | High | 3.45972 | 7.65E-05 | Low | |||
| Bacteroidetes.Bacteroidia.Bacteroidales.Prevotellaceae.Prevotella | 3.46939 | 0.008456 | High | 3.94783 | 6.31E-16 | Low | |||
| Bacteroidetes.Bacteroidia.Bacteroidales.Rikenellaceae | 3.72308 | 0.015021 | High | 3.82644 | 1.56E-12 | Low | |||
| Bacteroidetes.Bacteroidia.Bacteroidales | 3.20353 | 0.009979 | High | 3.13301 | 1.6E-12 | Low | |||
| Firmicutes.Clostridia.Clostridiales.Christensenellaceae | 3.53769 | 0.016585 | High | 3.33080 | 0.036190 | Low | |||
| Actinobacteria.Coriobacteriia.Coriobacteriales.Coriobacteriaceae | 3.22514 | 0.044352 | Low | ||||||
| Bacteroidetes.Bacteroidia.Bacteroidales.Paraprevotellaceae | 3.67592 | 9.65E-05 | Low | ||||||
| Bacteroidetes.Bacteroidia.Bacteroidales.Paraprevotellaceae.Prevotella | 3.67592 | 9.65E-05 | Low | ||||||
| Bacteroidetes.Bacteroidia.Bacteroidales.Prevotellaceae | 3.82596 | 9.65E-05 | Low | ||||||
| Deferribacteres | 3.35837 | 0.005758 | Low | ||||||
| Deferribacteres.Deferribacteres | 3.35874 | 0.005758 | Low | ||||||
| Deferribacteres.Deferribacteres.Deferribacterales | 3.36137 | 0.005758 | Low | ||||||
| Deferribacteres.Deferribacteres.Deferribacterales.Deferribacteracea | 3.35772 | 0.005758 | Low | ||||||
| Deferribacteres.Deferribacteres.Deferribacterales.Deferribacteraceae.Mucispirillum | 3.36082 | 0.005758 | Low | ||||||
| Proteobacteria.Gammaproteobacteria | 3.30927 | 0.019810 | Low | ||||||
| Proteobacteria.Gammaproteobacteria.Enterobacteriales | 3.30713 | 0.019810 | Low | ||||||
| Proteobacteria.Gammaproteobacteria.Enterobacteriales.Enterobacteriaceae | 3.31707 | 0.019810 | Low | ||||||
| Firmicutes.Clostridia.Clostridiales | 4.57889 | 0.000680 | High | ||||||
| Firmicutes.Clostridia.Clostridiales.Lachnospiraceae | 3.82545 | 0.017366 | High | ||||||
| Firmicutes.Clostridia.Clostridials.Lachnospiraceae.Dorea | 3.31929 | 0.026676 | High | ||||||
| Firmicutes.Clostridia.Clostridiales.Ruminococcaceae.Oscillospira | 3.84527 | 0.006447 | High | ||||||
| Firmicutes.Clostridia.Clostridiales.Ruminococcaceae.Ruminococcus | 3.77812 | 0.000499 | High | ||||||
| Proteobacteria.Alphaproteobacteria.RF32 | 3.27961 | 0.008611 | High | ||||||
| Proteobacteria.Epsilonproteobacteria.Campylobacterales.Helicobacteraceae | 3.62530 | 0.000393 | High | ||||||
| Tenericutes | 3.27403 | 0.001065 | High | ||||||
| Tenericutes.Mollicutes | 3.25535 | 0.003120 | High | ||||||
| Tenericutes.Mollicutes.RF39 | 3.25409 | 0.003120 | High | ||||||
| Bacteroidetes | 4.70727 | 0.000397 | Low | ||||||
| Bacteroidetes.Bacteroidia | 4.70727 | 0.000397 | Low | ||||||
| Bacteroidetes.Bacteroidia.Bacteroidales.Odoribacteraceae | 3.41723 | 1.22E-18 | Low | ||||||
| Bacteroidetes.Bacteroidia.Bacteroidales.Odoribacteraceae.Odoribacter | 3.47274 | 1.22E-18 | Low | ||||||
| Bacteroidetes.Bacteroidia.Bacteroidales.Porphyromonadaceae | 3.11464 | 0.000676 | Low | ||||||
| Bacteroidetes.Bacteroidia.Bacteroidales.Porphyromonadaceae.Parabacteroides | 3.06586 | 0.000676 | Low | ||||||
| Bacteroidetes.Bacteroidia.Bacteroidales.S24_7 | 4.49336 | 0.034288 | Low | ||||||
| Firmicutes.Clostridia.Clostridials.Dehalobacteriaceae | 3.44482 | 0.010761 | Low | ||||||
| Firmicutes.Clostridia.Clostridials.Dehalobacteriaceae.Dehalobacterium | 3.45906 | 0.010761 | Low | ||||||
| Proteobacteria | 3.38346 | 8.98E-13 | Low | ||||||
| TM7 | 3.94808 | 0.013973 | Low | ||||||
| TM7.TM7_3 | 3.79262 | 0.013973 | Low | ||||||
| TM7.TM7 3.CW040 | 3.60561 | 0.013973 | Low | ||||||
| TM7.TM7_3.CW040.F16 | 3.84749 | 0.013973 | Low | ||||||
| Cyanobacteria | 3.19671 | 0.000962 | High | ||||||
| Cyanobacteria.4C0d_2 | 3.38513 | 0.001431 | High | ||||||
| Cyanobacteria.4C0d_2.YS2 | 3.31490 | 0.001431 | High | ||||||
| Firmicutes | 4.64404 | 0.003823 | High | ||||||
| Firmicutes.Clostridia.Clostridiales.Clostridiaceae | 3.92271 | 2.01 E-05 | High | ||||||
| Firmicutes.Clostridia.Clostridiales.Clostridiaceae.02d06 | 2.56784 | 0.024838 | High | ||||||
| Firmicutes.Clostridia.Clostridiales.Clostridiaceae.Clostridium | 2.54472 | 0.019193 | High | ||||||
| Firmicutes.Clostridia.Clostridiales.Clostridiaceae.Sarcina | 2.56391 | 0.021179 | High | ||||||
| Firmicutes.Clostridia.Clostridiales.Peptococcaceae.rc4_4 | 3.26329 | 0.000457 | High | ||||||
| Firmicutes.Clostridia.Clostridiales.Peptostreptococcaceae | 2.74377 | 0.034900 | High | ||||||
| Firmicutes.Clostridia.Clostridiales.Ruminococcaceae | 3.68674 | 0.000262 | High | ||||||
| Firmicutes.Erysipelotrichi.Erysipelotrichales.Erysipelotrichaceae | 2.56710 | 0.014173 | High | ||||||
| Tenericutes.Mollicutes.Anaeroplasmatales | 3.43058 | 0.012537 | High | ||||||
| Tenericutes.Mollicutes.Anaeroplasmatales.Anaeroplasmataceae | 3.41372 | 0.012537 | High | ||||||
| Tenericutes.Mollicutes.Anaeroplasmatales.Anaeroplasmataceae.Anaeroplasma | 3.43713 | 0.012537 | High | ||||||
The relative abundance of operational taxonomic units from 16S rDNA amplification of fecal sample DNA was determined with QIIME, and these data were input into LEfSe31 to identify discriminant biomarkers. After Kruskal-Wallis analysis (with an alpha-value of 0.05) of all features, a Linear Discriminant Analysis (LDA) model was used to rank discriminant features by the effect size with which they differentiate classes, in this case IgA-High versus IgA-Low samples. Analysis was performed to discriminate between IgA-High and IgA-Low samples from both facilities (“All Sample Comparison”), from Facility 1 only (“Facility 1 Comparison”) or Facility 2 only (“Facility 2 Comparison”). Biomarkers are depicted as Phylum.Class.Order.Family.Genus, to the level to which the taxonomic units were assignable by QIIME. “IgA” indicates whether the biomarker is enriched in IgA-High samples (“High”) or IgA-Low samples (“Low”).
Extended Data Table 2.
IgA-Low sample cultures enrich for unique bacterial taxa compared to cultures from IgA-High samples.
| Mean and Standard Deviation |
One-way analysis of variance |
Tukey's multiple comparisons test |
|||||||||
|---|---|---|---|---|---|---|---|---|---|---|---|
| Bacterial Taxa | Pre IgA-High | Post IgA-High | Pre IgA-Low | Post IgA-Low | Pre IgA-High vs. Post IgA-High | Pre IgA-High vs. Pre IgA-Low | Pre IgA-High vs. Post IgA-Low | Post IgA-High vs. Pre IgA-Low | Post IgA-High vs. Post IgA-Low | Pre IgA-Low vs. Post IgA-Low | |
| Bacteroidales.Bacteroidaceae.Bacteroides | 0.0007+/−0.0005 | 0.0001+/−0.0001 | 0.0535+/−0.0122 | 0.1791+/−0.0127 | F=367.9 P<0.0001 |
ns | **** | **** | **** | **** | **** |
| Bacteroidales.Porphyromonadaceae.Parabacteroides | 0.0002+/−0.0003 | 0.0001+/−0.0001 | 0.0015+/−0.0015 | 0.0173+/−0.0034 | F=80.90 P< 0.0001 |
ns | ns | **** | ns | **** | **** |
| Bacteroidales.Prevotellaceae.Prevotella | 0 +/−0 | 0 +/−0 | 0.0657+/−0.0343 | 0.0002+/−0.0003 | F=14.66 P=0.0003 |
ns | *** | ns | *** | ns | *** |
| Bacteroidales.S24-7.Unclassified | 0.8166+/−0.0809 | 0.1087+/−0.0164 | 0.7920+/−0.0098 | 0.0905+/−0.0377 | F=318.0 P< 0.0001 |
**** | ns | **** | **** | ns | **** |
| Burkholderiales.Alcaligenaceae.Sutterella | 0.0006+/−0.0003 | 0.0004+/−0.0002 | 0.0241+/−0.0057 | 0.4037+/−0.0303 | F=660.5 P< 0.0001 |
ns | ns | **** | ns | **** | **** |
| Clostridiales.Unclassified.Unclassified | 0.1665+/−0.0850 | 0.0019+/−0.0014 | 0.0264+/−0.0109 | 0.0002+/−0.0002 | F=13.75 P=0.0003 |
*** | ** | *** | ns | ns | ns |
| Clostridiales.Lachnospiraceae.Unclassified | 0.0007+/−0.0004 | 0.0012+/−0.0007 | 0.0001+/−0.0002 | 0.0014+/−0.0010 | F=3.717 P=0.0423 |
ns | ns | ns | ns | ns | * |
| Clostridiales.Mogibacteriaceae.Unclassified | 0.0004+/−0.0003 | 0.0753+/−0.0851 | 0.0007+/−0.0008 | 0.0674+/−0.0407 | F=3.021 P=0.0716 |
ns | ns | ns | ns | ns | ns |
| Enterobacteriales.Enterobacteriaceae.Unclassified | 0.0003+/−0.0005 | 0.0004+/−0.0004 | 0.0004+/−0.0000 | 0.1760+/−0.0152 | F=531.4 P< 0.0001 |
ns | ns | **** | ns | **** | **** |
| Enterobacteriales.Enterobacteriaceae.Proteus | 0.0014+/−0.0016 | 0.7870+/−0.0793 | 0.0015+/−0.0006 | 0.0322+/−0.0198 | F=360.4 P< 0.0001 |
**** | ns | ns | **** | **** | ns |
| Lactobacillales.Lactobacillaceae.Lactobacillus | 0.0127+/−0.0066 | 0.0249+/−0.0176 | 0.0339+/−0.0245 | 0.0319+/−0.0048 | F=1.510 P=0.2622 |
ns | ns | ns | ns | ns | ns |
Means and standard deviations of assigned Order.Family.Genus operational taxonomic units are depicted. Each taxa was compared between groups by one-way ANOVA followed by Tukey's multiple comparisons test.
Acknowledgments
This work was supported by National Institutes of Health (NIH) grant AI08488702, the CCFA Genetics initiative, the Rainin Foundation, and the Helmsley Charitable Trust. CM was supported by an NIH training grant T32AI007163, and MTB was supported by NIH training grant T32CA009547 and the W.M. Keck Fellowship from Washington University.
The authors would like to thank H. Miyoshi for technical recommendations, D. Kreamalmeyer for animal care and breeding, and members of the Stappenbeck and Virgin labs for discussion. Experimental support was provided by the Speed Congenics Facility of the Rheumatic Diseases Core Center (NIH award number P30AR048335) and the Digestive Disease Research Core Center (NIH award number P30DK052574) of Washington University. The content is solely the responsibility of the authors and does not necessarily represent the official views of the National Institutes of Health.
Footnotes
Authorship Contributions:
MTB and CM designed the project, performed experiments, and wrote the paper. TSS and HWV assisted with project design and paper writing. CDB and MAW assisted with microbial characterization and project design.
16S rDNA sequencing data has been uploaded to the European Nucleotide Archive (accession # PRJEB7854).
The authors declare no competing financial interests statement.
Supplementary Information is linked to the online version of the paper at www.nature.com/nature.
References
- 1.Hao LY, Liu X, Franchi L. Inflammasomes in inflammatory bowel disease pathogenesis. Current opinion in gastroenterology. 2013;29:363–369. doi: 10.1097/MOG.0b013e32836157a4. doi:10.1097/MOG.0b013e32836157a4. [DOI] [PubMed] [Google Scholar]
- 2.Ubeda C, et al. Familial transmission rather than defective innate immunity shapes the distinct intestinal microbiota of TLR-deficient mice. J Exp Med. 2012;209:1445–1456. doi: 10.1084/jem.20120504. doi:10.1084/jem.20120504. [DOI] [PMC free article] [PubMed] [Google Scholar]
- 3.Letran SE, et al. TLR5-deficient mice lack basal inflammatory and metabolic defects but exhibit impaired CD4 T cell responses to a flagellated pathogen. Journal of immunology. 2011;186:5406–5412. doi: 10.4049/jimmunol.1003576. doi:10.4049/jimmunol.1003576. [DOI] [PMC free article] [PubMed] [Google Scholar]
- 4.Ivanov, et al. Induction of intestinal Th17 cells by segmented filamentous bacteria. Cell. 2009;139:485–498. doi: 10.1016/j.cell.2009.09.033. doi:10.1016/j.cell.2009.09.033. [DOI] [PMC free article] [PubMed] [Google Scholar]
- 5.Cadwell K, et al. Virus-plus-susceptibility gene interaction determines Crohn's disease gene Atg16L1 phenotypes in intestine. Cell. 2010;141:1135–1145. doi: 10.1016/j.cell.2010.05.009. doi:10.1016/j.cell.2010.05.009. [DOI] [PMC free article] [PubMed] [Google Scholar]
- 6.Holmdahl R, Malissen B. The need for littermate controls. Eur J Immunol. 2012;42:45–47. doi: 10.1002/eji.201142048. doi:10.1002/eji.201142048. [DOI] [PubMed] [Google Scholar]
- 7.Hooper LV, Littman DR, Macpherson AJ. Interactions between the microbiota and the immune system. Science. 2012;336:1268–1273. doi: 10.1126/science.1223490. doi:10.1126/science.1223490. [DOI] [PMC free article] [PubMed] [Google Scholar]
- 8.Spor A, Koren O, Ley R. Unravelling the effects of the environment and host genotype on the gut microbiome. Nat Rev Microbiol. 2011;9:279–290. doi: 10.1038/nrmicro2540. doi:10.1038/nrmicro2540. [DOI] [PubMed] [Google Scholar]
- 9.Fujiwara R, Watanabe J, Sonoyama K. Assessing changes in composition of intestinal microbiota in neonatal BALB/c mice through cluster analysis of molecular markers. The British journal of nutrition. 2008;99:1174–1177. doi: 10.1017/S0007114507862349. doi:10.1017/S0007114507862349. [DOI] [PubMed] [Google Scholar]
- 10.Brandtzaeg P. Secretory IgA: Designed for Anti-Microbial Defense. Frontiers in immunology. 2013;4:222. doi: 10.3389/fimmu.2013.00222. doi:10.3389/fimmu.2013.00222. [DOI] [PMC free article] [PubMed] [Google Scholar]
- 11.Johansen FE, et al. Absence of epithelial immunoglobulin A transport, with increased mucosal leakiness, in polymeric immunoglobulin receptor/secretory component-deficient mice. J.Exp.Med. 1999;190:915–922. doi: 10.1084/jem.190.7.915. [DOI] [PMC free article] [PubMed] [Google Scholar]
- 12.Tsuji M, Suzuki K, Kinoshita K, Fagarasan S. Dynamic interactions between bacteria and immune cells leading to intestinal IgA synthesis. Semin Immunol. 2008;20:59–66. doi: 10.1016/j.smim.2007.12.003. doi:10.1016/j.smim.2007.12.003. [DOI] [PubMed] [Google Scholar]
- 13.Blutt SE, Conner ME. The Gastrointestinal Frontier: IgA and Viruses. Frontiers in immunology. 2013;4:402. doi: 10.3389/fimmu.2013.00402. doi:10.3389/fimmu.2013.00402. [DOI] [PMC free article] [PubMed] [Google Scholar]
- 14.Murthy AK, Dubose CN, Banas JA, Coalson JJ, Arulanandam BP. Contribution of polymeric immunoglobulin receptor to regulation of intestinal inflammation in dextran sulfate sodium-induced colitis. Journal of gastroenterology and hepatology. 2006;21:1372–1380. doi: 10.1111/j.1440-1746.2006.04312.x. doi:10.1111/j.1440-1746.2006.04312.x. [DOI] [PubMed] [Google Scholar]
- 15.Reikvam DH, et al. Epithelial-microbial crosstalk in polymeric Ig receptor deficient mice. European journal of immunology. 2012;42:2959–2970. doi: 10.1002/eji.201242543. doi:10.1002/eji.201242543. [DOI] [PubMed] [Google Scholar]
- 16.Brandtzaeg P, Prydz H. Direct evidence for an integrated function of J chain and secretory component in epithelial transport of immunoglobulins. Nature. 1984;311:71–73. doi: 10.1038/311071a0. [DOI] [PubMed] [Google Scholar]
- 17.Brown WR, Newcomb RW, Ishizaka K. Proteolytic degradation of exocrine and serum immunoglobulins. J Clin Invest. 1970;49:1374–1380. doi: 10.1172/JCI106354. doi:10.1172/JCI106354. [DOI] [PMC free article] [PubMed] [Google Scholar]
- 18.Lindh E. Increased risistance of immunoglobulin A dimers to proteolytic degradation after binding of secretory component. J Immunol. 1975;114:284–286. [PubMed] [Google Scholar]
- 19.Wexler HM, et al. Sutterella wadsworthensis gen. nov., sp. nov., bile-resistant microaerophilic Campylobacter gracilis-like clinical isolates. International journal of systematic bacteriology. 1996;46:252–258. doi: 10.1099/00207713-46-1-252. [DOI] [PubMed] [Google Scholar]
- 20.Moon C, Vandussen KL, Miyoshi H, Stappenbeck TS. Development of a primary mouse intestinal epithelial cell monolayer culture system to evaluate factors that modulate IgA transcytosis. Mucosal immunology. 2013 doi: 10.1038/mi.2013.98. doi:10.1038/mi.2013.98. [DOI] [PMC free article] [PubMed] [Google Scholar]
- 21.Plaut AG, Gilbert JV, Artenstein MS, Capra JD. Neisseria gonorrhoeae and neisseria meningitidis: extracellular enzyme cleaves human immunoglobulin A. Science. 1975;190:1103–1105. doi: 10.1126/science.810892. [DOI] [PubMed] [Google Scholar]
- 22.Loomes LM, Senior BW, Kerr MA. A proteolytic enzyme secreted by Proteus mirabilis degrades immunoglobulins of the immunoglobulin A1 (IgA1), IgA2, and IgG isotypes. Infect Immun. 1990;58:1979–1985. doi: 10.1128/iai.58.6.1979-1985.1990. [DOI] [PMC free article] [PubMed] [Google Scholar]
- 23.Ichinohe T, et al. Microbiota regulates immune defense against respiratory tract influenza A virus infection. Proc Natl Acad Sci U S A. 2011;108:5354–5359. doi: 10.1073/pnas.1019378108. doi:10.1073/pnas.1019378108. [DOI] [PMC free article] [PubMed] [Google Scholar]
- 24.Lee YK, Menezes JS, Umesaki Y, Mazmanian SK. Proinflammatory T-cell responses to gut microbiota promote experimental autoimmune encephalomyelitis. Proc Natl Acad Sci U S A. 2011;108(Suppl 1):4615–4622. doi: 10.1073/pnas.1000082107. doi:10.1073/pnas.1000082107. [DOI] [PMC free article] [PubMed] [Google Scholar]
- 25.Rakoff-Nahoum S, Paglino J, Eslami-Varzaneh F, Edberg S, Medzhitov R. Recognition of commensal microflora by toll-like receptors is required for intestinal homeostasis. Cell. 2004;118:229–241. doi: 10.1016/j.cell.2004.07.002. [DOI] [PubMed] [Google Scholar]
- 26.Williams BL, Hornig M, Parekh T, Lipkin WI. Application of novel PCR-based methods for detection, quantitation, and phylogenetic characterization of Sutterella species in intestinal biopsy samples from children with autism and gastrointestinal disturbances. MBio. 2012;3 doi: 10.1128/mBio.00261-11. doi:10.1128/mBio.00261-11. [DOI] [PMC free article] [PubMed] [Google Scholar]
- 27.Caporaso JG, et al. Global patterns of 16S rRNA diversity at a depth of millions of sequences per sample. Proceedings of the National Academy of Sciences of the United States of America. 2011;108:4516–4522. doi: 10.1073/pnas.1000080107. doi:10.1073/pnas.1000080107. [DOI] [PMC free article] [PubMed] [Google Scholar]
- 28.Caporaso JG, et al. QIIME allows analysis of high-throughput community sequencing data. Nature Methods. 2010;7:335–336. doi: 10.1038/nmeth.f.303. doi:10.1038/nmeth.f.303. [DOI] [PMC free article] [PubMed] [Google Scholar]
- 29.Edgar RC. Search and clustering orders of magnitude faster than BLAST. Bioinformatics. 2010;26:2460–2461. doi: 10.1093/bioinformatics/btq461. doi:10.1093/bioinformatics/btq461. [DOI] [PubMed] [Google Scholar]
- 30.McDonald D, et al. An improved Greengenes taxonomy with explicit ranks for ecological and evolutionary analyses of bacteria and archaea. The ISME journal. 2012;6:610–618. doi: 10.1038/ismej.2011.139. doi:10.1038/ismej.2011.139. [DOI] [PMC free article] [PubMed] [Google Scholar]
- 31.Segata N, et al. Metagenomic biomarker discovery and explanation. Genome biology. 2011;12:R60. doi: 10.1186/gb-2011-12-6-r60. doi:10.1186/gb-2011-12-6-r60. [DOI] [PMC free article] [PubMed] [Google Scholar]
- 32.Miyoshi H, Stappenbeck TS. In vitro expansion and genetic modification of gastrointestinal stem cells in spheroid culture. Nat Protoc. 2013;8:2471–2482. doi: 10.1038/nprot.2013.153. doi:10.1038/nprot.2013.153. [DOI] [PMC free article] [PubMed] [Google Scholar]
- 33.Miyoshi H, Ajima R, Luo CT, Yamaguchi TP, Stappenbeck TS. Wnt5a potentiates TGF-beta signaling to promote colonic crypt regeneration after tissue injury. Science. 2012;338:108–113. doi: 10.1126/science.1223821. doi:10.1126/science.1223821. [DOI] [PMC free article] [PubMed] [Google Scholar]
- 34.Kang SS, et al. An antibiotic-responsive mouse model of fulminant ulcerative colitis. PLoS Med. 2008;5:e41. doi: 10.1371/journal.pmed.0050041. [DOI] [PMC free article] [PubMed] [Google Scholar]
- 35.Schneider CA, Rasband WS, Eliceiri KW. NIH Image to ImageJ: 25 years of image analysis. Nature methods. 2012;9:671–675. doi: 10.1038/nmeth.2089. [DOI] [PMC free article] [PubMed] [Google Scholar]


