Abstract
Purpose:
In C-arm computed tomography (CT), the field of view (FOV) is often not sufficient to acquire certain anatomical structures, e.g., a full hip or thorax. Proposed methods to extend the FOV use a fixed detector displacement and a 360° scan range to double the radius of the FOV. These trajectories are designed for circular FOVs. However, there are cases in which the required FOV is not circular but rather an ellipsoid.
Methods:
In this work, the authors show that in fan-beam CT, the use of a dynamically adjusting detector offset can reduce the required scan range when using a noncircular FOV. Furthermore, the authors present an analytic solution to determine the minimal required scan ranges for elliptic FOVs given a certain detector size and an algorithmic approach for arbitrary FOVs.
Results:
The authors show that the proposed method can result in a substantial reduction of the required scan range. Initial reconstructions of data sets acquired with our new minimal trajectory yielded image quality comparable to reconstructions of data acquired using a fixed detector offset and a full 360° rotation.
Conclusions:
Our results show a promising reduction of the necessary scan range especially for ellipsoidal objects that extend the FOV. In noncircular FOVs, there exists a set of solutions that allow a trade-off between detector size and scan range.
Keywords: computed tomography, extended FOV, noncircluar FOV, weight-bearing imaging
1. INTRODUCTION
Thorough imaging of the knee under load is essential to improve our understanding of the knee’s functionality during activities of daily living in healthy and diseased joints.1–3 To obtain functional information about joint biomechanics, radiographic images of the weight-bearing knee are invaluable. However, applying weight to the knee joint during standard 3D imaging methods such as conventional MR or computed tomograph (CT) scans poses additional challenges, as the patient is typically scanned in a supine position.
In some earlier work, the knee morphology has been investigated using weight-bearing magnetic resonance imaging. Here, the weight-bearing state can be achieved by using open-configuration MR imaging4 or clinical MR imaging with a weight-application apparatus.5 These systems have the drawback that the range of weight-bearing postures and loads is limited. Compared to CT, they require a relatively long acquisition time, offer lower spatial resolution, and have a limited ability to image bone tissue.
In the last years, dedicated cone beam CT scanners for musculoskeletal imaging were introduced,6–8 which allow for weight-bearing imaging in an upright position. These scanners offer a field of view (FOV) of 16 cm (Ref. 7) and 20 cm,6 which only allows imaging of one knee at a time. Increasing the FOV of these systems would help to position the patient in a more natural stance. Additionally, other application areas such as therapy planning could benefit from an increased FOV. Here, the focus is on imaging the body in an upright position, as this is also the position in which the surgery is performed.9
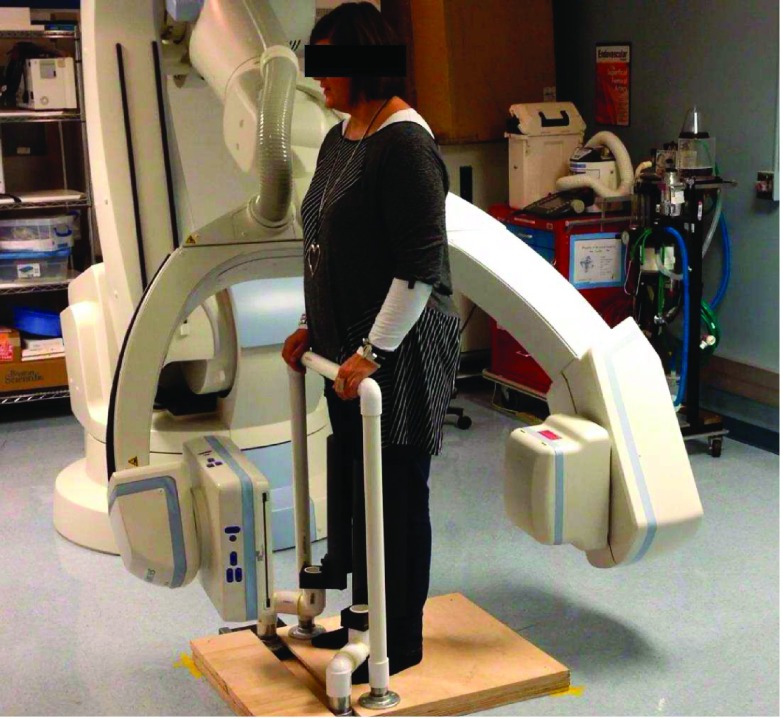
Maier et al.10 showed that C-arm CT devices allow horizontal trajectories. This renders medical examination of the weight-bearing knees possible with already available devices (Fig. 1). The diameter of a C-arm CT’s FOV is usually determined and thereby limited by its detector size. Typically for these systems, the FOV’s diameter is about 25 cm. In most cases, this diameter is insufficient to cover both knees at once. For that reason, a standard short scan11 which requires a rotation of about 200° is not sufficient. To scan both knees at once, large volume techniques have to be applied.
FIG. 1.
An experimental setup for a weight-bearing acquisition of the knees using a horizontal trajectory.
One solution to increase the FOV is to displace the detector array and adjust the scan range accordingly.12–14 The maximal radius of the FOV can be almost doubled if a displacement of half the detector width is used. With this offset detector geometry, only half of the extended FOV is acquired with a single projection. Prior to reconstruction, these truncated projections are then rebinned to a complete data set which covers the fully extended FOV. One drawback of these methods is that a full 360° scan range is required to sample the extended FOV completely. Even state-of-the-art robot-mounted systems might not be able to use a 360° scan range in certain angulations. Angular restriction can be due to a nonstandard patient position, such as when scanning knees under weight-bearing conditions (Fig. 1).10,15
Currently, these trajectories and their reconstruction methods are designed for circular FOVs, but many anatomical structures may be better described by a noncircular boundary, e.g., an ellipse.
In the following, we derive an analytic formula to describe rotational range vs detector size for ellipses in fan-beam CT (2D). This is followed by an algorithm for the numerical determination of these parameters for arbitrary objects. Initial results on this new trajectory optimization have been presented previously.16 Furthermore, the 3D coverage of the presented trajectory is evaluated.
2. MATERIALS AND METHODS
2.A. Correspondences in the sinogram
In a sinogram of a complete rotation, i.e., a scan range of 360°, every ray is detected twice.17 These rays are well-known as complementary rays. The corresponding line integrals of the complementary rays are equal and their position in the fan-beam sinogram can be described by the relation
| (1) |
Here, α denotes the angle between the considered ray and the central ray, and β is the rotation angle of a C-arm CT system. f(α, β) is the value of the line-integral at the given position.
If a flat-panel detector is used, α has to be replaced by a function of the position xα on the detector,
| (2) |
This redundancy allows for shorter scan ranges, among which the most common one is known as the short scan.11 Furthermore, the FOV can also be extended using an offset detector which is often referred to as large volume scan.18
2.B. Proposed algorithm
Subsequently, we consider simple objects that are used to represent various shapes of possible FOVs. Ellipses are useful to represent an outline of a hip slice or two circles that are positioned off-center as a suitable FOV for a cross-section of both knees. A virtual detector is defined that is large enough to cover the whole object such that none of the acquired projections suffer from data truncation. Then, a ground truth sinogram is generated using the defined FOV model and an arbitrary but nonzero density distribution within the FOV. For simplicity, we assume a constant density over the entire FOV and use the mean density value of water. There are line integrals in the sinogram that do not intersect the object, i.e., their sum is zero (cf. Fig. 2, right side), and such data are not necessary for reconstruction. Consequently, the idea is to move the detector in such a way that only nonzero line integrals are collected in each projection. This motion is possible when robot-mounted C-arm CT devices are used. For these, the detector can be moved dynamically in either direction.
FIG. 2.
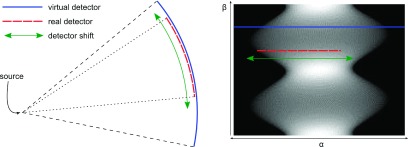
To acquire only nonzero line integrals, the detector has to be moved dynamically as shown on the left. To describe this motion, a dynamic frame of reference is required. In order to describe the motion in a static frame of reference, we introduce a virtual large detector that is able to cover the entire object in all views indicated by the solid blue line in the right image. Then the motion indicated by the green arrows of the dynamic detector indicated by the dashed red line is equivalent to a shift along the virtual large detector row. With this dynamic offset of the detector, the acquired data change as shown on the right side. This kind of movement is possible for robot-mounted C-arm CT devices.
In order to cope with the dynamic frame of reference, we project the dynamic detector offsets into a static frame of reference that is a virtual large detector. In this large detector, we only use detector pixels that can actually be acquired with a dynamic detector offset and a smaller detector.
This motion of the detector is illustrated in Fig. 2. The projection of a single angle taken with the virtual detector is depicted by the solid line and represents a single line of the sinogram. The dashed line represents the real detector and its corresponding data in the sinogram. Moving the dashed line in the sinogram to the left and right is equivalent to rotating the real detector while performing the rotation of the whole C-arm system. The movement of the detector can be described with the angle between the central ray of the virtual detector and the central ray of the real detector. It will change while rotating the whole C-arm and can be described as a function of β. In this way, only segments of interest are acquired in the sinogram. The most intuitive way of moving the detector is to follow the contour of the object in the sinogram (see Fig. 3). This results in a dynamic detector offset. Doing so, a minimal amount of background is scanned. If this movement is performed and a full data set is to be acquired, the following constraints have to be fulfilled:
-
•
The first requirement is the same as for a static off-center detector acquisition: the detector has to be at least as wide as half of the object’s widest extent in the sinogram. Otherwise the object cannot be covered within the static detector range and a complete rotation.
-
•
For the dynamic off-center acquisition there is a new additional requirement: the detector has to be large enough to cover the data for the rotation angle where the outline is narrowest.
FIG. 3.

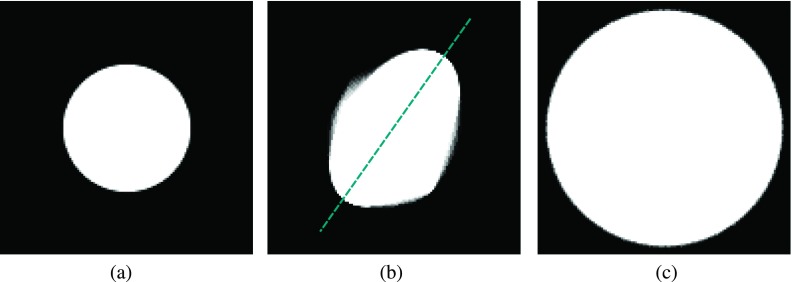
(a) Shape of the knees represented by two circles. (b) Sinogram of (a) acquired with a static detector that is big enough to cover the object in any view. (c) Example of the data acquired with a smaller detector with the proposed dynamic offset.
Note that this new constraint is not equivalent to the first one for noncircular objects, and thus allows to achieve a smaller scan range.
In Fig. 3, we visualize the proposed detector motion by a simple example. Figure 3(a) shows an object that represents the cross-section of the shape of two knees by using two uniform circles. Figure 3(b) depicts the full virtual sinogram of the object and Fig. 3(c) shows the data that are acquired if the proposed movement of the detector is realized. The superimposed lines represent the sinogram boundaries of the rotated detector.
2.C. Determining the minimally required scan range—analytic solution for ellipses
In order to compute the required rotation range depending on the fan angle and the object, we examine the boundaries of an ellipse in the sinogram in Fig. 4.
FIG. 4.

Design of the new trajectory presented by means of the sinogram of an ellipse. (a) shows the data that are acquired with the proposed detector motion. (b) shows the missing data (highlighted areas on the right side) and the corresponding redundant areas (on the left side). (c) finally shows the minimal required scan range and the still contained redundant data.
Figure 4(a) shows which part of the sinogram data would be acquired if the detector performs the proposed movement. Thus, the data between the superimposed lines are acquired. Doing so, some data will be missing: these parts are the highlighted areas in Fig. 4(b) on the right side. According to Eq. (1), there are some areas that contain the same line integrals. These are exactly the highlighted areas on the right side. As the information given by these data is redundant, it is sufficient to acquire the areas on the left side. Thus, the minimal required scan range is determined by these areas.
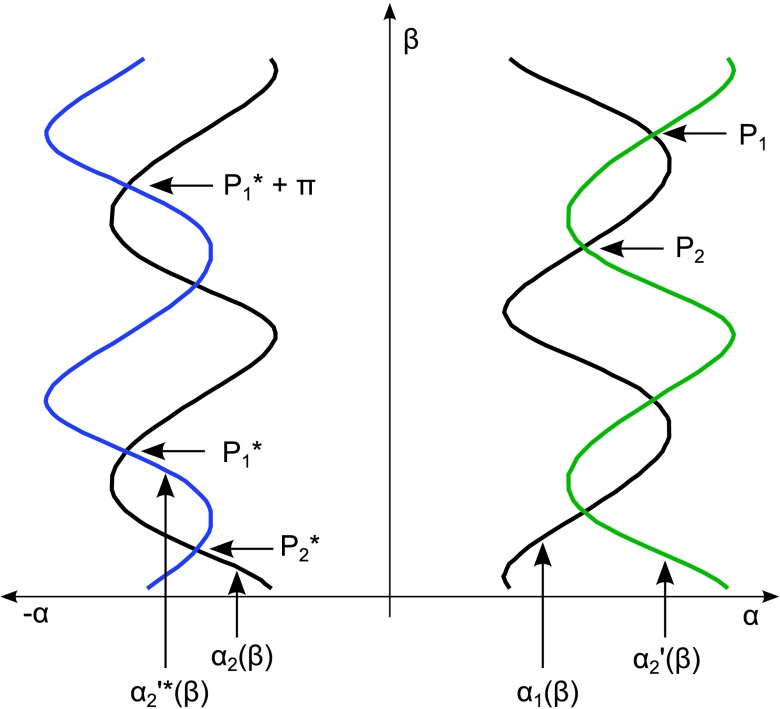
Figure 5 shows the borders in the sinogram and the related lines. These are described by the angle α, which changes depending on the rotation β. α2(β) is the function that describes the left boundary and α1(β) describes the right boundary. In the following, a shift of a line point by the width of the detector is denoted by a prime symbol and the corresponding data according to Eq. (1) are denoted by an asterisk. is α2 shifted by the fan angle, which we denote by w. Hence, if the detector follows the left boundary, the area between α2(β) and is acquired. represents the corresponding line to according to Eq. (1)
| (3) |
| (4) |
FIG. 5.
Boundaries of the ellipse in the sinogram and related lines. α1(β) and α2(β) are the boundaries of the object in the sinogram. is α2(β) shifted by the fan angle, thus the data between α2(β) and are acquired with the proposed dynamic detector offset. is the redundant line [cf. Eq. (1)] to . It is required for the computation of the minimal scan range.
The highlighted areas on the left side in Fig. 4 are defined by α2(β), and their intersections and . The corresponding points using Eq. (1) are P1 and P2, the intersections of α1(β) and . These intersections repeat periodically with a period of π.
Acquisition of a complete dataset requires that the data in the highlighted areas on the left side in Fig. 4 are obtained. So the required rotation is defined by and . The most straightforward way to get those points is to first compute P1 and P2 and then their corresponding points using Eq. (1).
To sum up, the required rotation can be computed as follows:
-
•
First, compute the functions α1(β) and α2(β) that describe the boundary of the object in the sinogram. They are the right- and left-most tangent line integrals from source to object onto the detector.
-
•
Computing the intersections of α1(β) and provides the points P1 and P2.
-
•
and , corresponding to P1 and P2, define the required rotation.
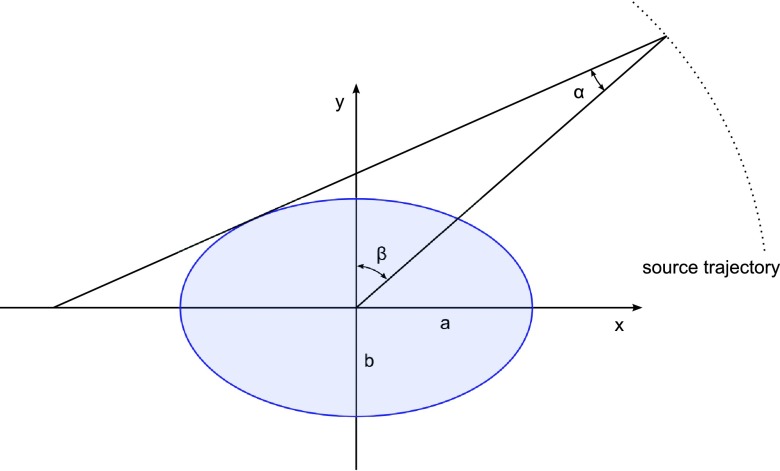
The rays that describe the boundaries in the sinogram are the rays that hit the object tangentially. This ray is shown in Fig. 6 and is described by α = f(β) because α changes depending on β.
FIG. 6.
The tangential ray for an ellipse. The angle α between the tangential ray and the ray going through the isocenter changes depending on rotation angle β. The tangential rays define the position of the boundary of the object in the sinogram.
For ellipses, the functions α1(β) and α2(β) can be computed analytically. Their detailed derivations including the computation of the intersection points are shown in the Appendix.
For the case a < b, the intersection point P1 is given by (α2(β1), β1) and P2 is given by (α2(β2), β2) (Fig. 5). The corresponding points are
| (5) |
The starting point and the end point of the trajectory are
| (6) |
The required rotation Δβ is therefore given by
| (7) |
2.D. Numerical method for arbitrary shapes
An analytic solution as described before may not be found for an arbitrarily shaped object. Thus, we present a numerical solution to determine the required scan range for arbitrary shaped FOVs in the following.
This method performs a grid search over all possible starting points and all possible scan ranges of the trajectory in order to find the set of parameters that leads to the minimal complete dataset.
In order to check whether the acquired data are complete, i.e., that they are sufficient for reconstruction, the truncated sinogram is first completed by using the approach described in Algorithm I. First, the acquired projection data are written into the sinogram. Positions in the sinogram which have a value of zero are assumed to be missing rays. Next, these are filled by their corresponding rays given by the redundancy condition in Eq. (1). After this completion step, the sinogram is compared to the ground truth. The ground truth is given by the complete data from the sinogram that was simulated using a detector large enough to cover the whole FOV in any view. If some data are still missing in this comparison, the acquired data set is not complete. If there are no differences between the completed sinogram and the ground truth, the acquired data set is complete and therefore sufficient to perform the reconstruction.
ALGORITHM I.
Sinogram completion.
| for all (α, β) do |
| if f(α, β) was acquired with the trajectory then |
| f(α, β) = f(α, β) |
| else |
| f(α, β) = f(−α, β + π + 2α) |
| (interpolation is required in this step) |
| end if |
| end for |
We now focus on the derivation of a numerical approach to determine the minimal scan range such that the virtually extended sinogram is still complete. The proposed algorithm to solve this problem is presented in Algorithm II. To determine the minimally required scan range Δβmin for an arbitrary FOV and a given detector size, we perform a grid search over all possible starting angles βStart ∈ [0°, 360°] and over all possible scan ranges Δβ ∈ [180°, 360°]. First, the minimally required rotation for every starting point is determined by starting with a small Δβ. Then, we increase it until the data set is complete. Next, the overall minimal Δβ and the corresponding βStart are chosen as a final result. For the step size in the angular direction, the angular spacing between the generated projections is used, which also limits the accuracy of the determined minimum scan range.
ALGORITHM II.
Find the minimal complete set for given object and detector size.
| Δβmin = ∞ |
| βStart,min = 0 |
| for all βStart do |
| Δβ = 180° |
| while data set is not complete do |
| Acquire data with βStart and Δβ |
| Complete sinogram with Algorithm I |
| if data set is complete then |
| if Δβ < Δβmin then |
| Save the values for the new minimal set: |
| Δβmin = Δβ and βStart,min = βStart |
| end if |
| else |
| Increase Δβ |
| end if |
| end while |
| end for |
Here, a selection of scanning configurations for the example depicted in Fig. 3 is presented. Figure 7 shows an incomplete configuration with β ∈ [53°, 299°]. Figure 7(a) shows the acquired sinogram, Fig. 7(b) shows the sinogram after the completion step using Algorithm I, and the white areas in Fig. 7(c) depict the detected missing rays. The two missing areas correspond to each other via Eq. (1), and thus, to fill the missing areas it is sufficient to acquire only one of them. In this configuration, the detector follows the left boundary in the sinogram. Thus, the range of β has to be extended toward the bottom of the sinogram until the lower part of the two missing areas is covered completely.
FIG. 7.

Example where the acquired data are insufficient for a complete data set. (a) Acquired data with the proposed dynamic detector offset. (b) Data completed with Algorithm I. (c) Missing data in the completed sinogram.
Figure 8 shows a scanning configuration with β ∈ [10°, 357°]. Here, more than the minimal complete data set is acquired. Figure 8(a) shows the acquired sinogram, Fig. 8(b) shows the sinogram after completion and the gray areas in Fig. 8(c) depict the redundantly acquired data. The range of β could be reduced in the highlighted region of the sinogram.
FIG. 8.

Example where more data are acquired than necessary for the minimal complete data set. (a) Acquired data with the proposed dynamic detector offset. (b) Data completed with Algorithm I. (c) The gray areas show the redundant data.
In Fig. 9, a minimal complete data set with a scan range of β ∈ [53°, 357°] is shown. Figure 9(a) shows the acquired sinogram, Fig. 9(b) shows the resulting completed sinogram, and Fig. 9(c) shows the acquired redundant areas. With this configuration, there are no missing parts and no redundant areas that can be left out without losing data that are required for the complete data set.
FIG. 9.

Example where exactly the minimal complete data set is acquired. (a) Acquired data with the proposed dynamic detector offset. (b) Data completed with Algorithm I. (c) The gray areas show the redundant data.
All algorithms were implemented using conrad, an open source software for simulation and reconstruction of CT data (see Ref. 19).
The ground truth sinogram for our numerical simulations was generated by using 360 projections with an angular increment of 1°. The source to detector distance was set to 574 mm, and the virtual detector, which is big enough to cover the object from every view, had 501 elements with a spacing of 1 mm leading to a virtual fan angle of approximately 47°. The sinogram resulting of the proposed dynamic detector offset was generated by extracting the relevant data out of the ground truth sinogram. Then, the minimal complete scan range was estimated according to Algorithm II.
3. RESULTS
3.A. Results for the analytical solution
In Fig. 10(a), we show the different FOVs that were used for the evaluation of the minimally required scan range for different detector sizes. Figure 10 shows the off-center circles introduced above, Figs. 10(b)–10(d) depict ellipses with varying diameter in the y-direction, and Fig. 10(d) shows a uniform circle. For detailed parameters of the shapes, please refer to Table I.
FIG. 10.

The shape of different objects modifies the required field of view. For detailed parameters, please refer to Table I. (a) Two circles. Here, the major axis encompasses both circles. (b) Ellipse 1 with large eccentricity. (c) Ellipse 2 with moderate eccentricity. (d) Ellipse 3 with small eccentricity. (e) Circle.
TABLE I.
Dimensions of the different objects.
| Object | Major axis (mm) | Minor axis (mm) |
|---|---|---|
| Two circles | 358.4 | 153.6 |
| Ellipse 1 | 358.4 | 153.6 |
| Ellipse 2 | 358.4 | 204.8 |
| Ellipse 3 | 358.4 | 256 |
| Ellipse 4 | 358.4 | 340 |
| Circle | 358.4 | 358.4 |
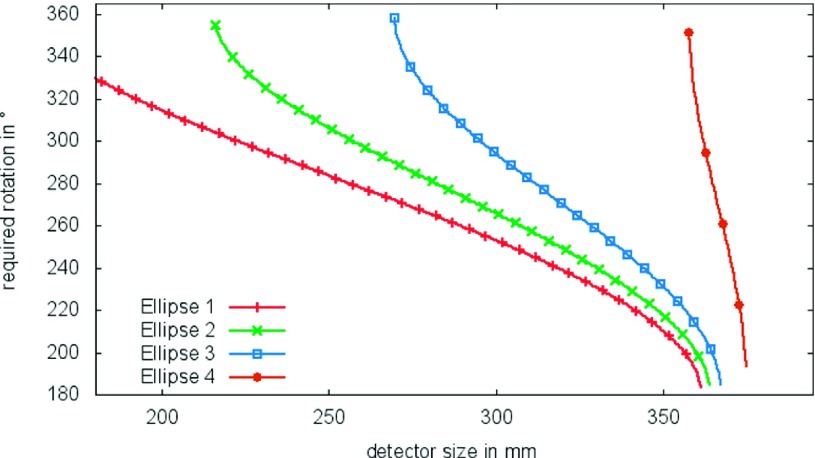
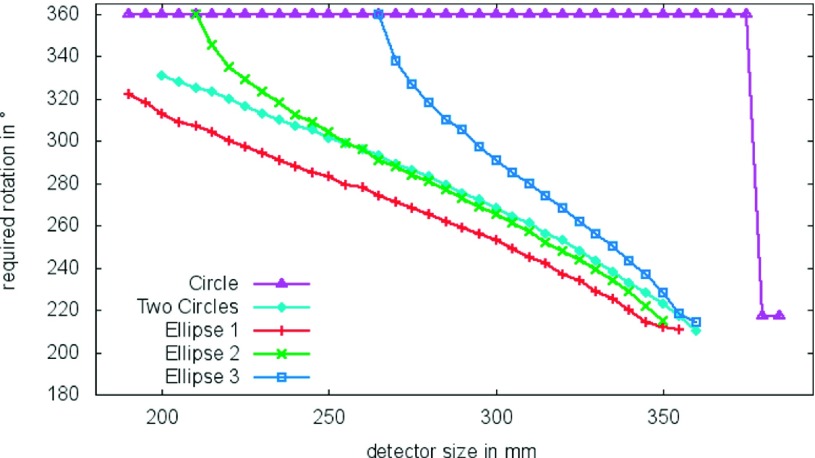
For ellipses, the analytic approach can be applied to evaluate the required rotation. In Fig. 11, the required rotation is plotted as a function of the detector size for the different ellipses in Table I. Ellipse 4 is nearly a circle and used as a substitute of a circle, for which no analytic solution can be found because Eq. (7) evaluates to non-numeric values (there are no intersections of the boundaries in the sinogram). In this simulation, the source to isocenter distance is set to 574 mm, and the source to detector distance is set to the same value. This configuration is used for all simulations in this paper.
FIG. 11.
Plot of required rotation for elliptic FOVs with different aspect ratios (cf. Table I) and different detector sizes. The source to detector distance used in this example is 574 mm.
The graphs clearly depict the connection between the detector size used and the minimally required scan range. Further, we see that changing the aspect ratio of the ellipse describing the FOV leads to a change of the minimally required scan range, given a certain detector size.
An average pair of knees with a maximal extent in the x-direction of 360 mm and a maximal extent in the y-direction of 180 mm could be described by an ellipse with radius a = 90 mm and b = 180 mm. Using the technical data of the Artis zeego (Siemens AG) as described in Table II with a fan angle of 19° and a source to isocenter distance of 574 mm, the proposed trajectory leads to a reduced scan range of 348°. This setting leads to a very poor reduction in the required range, but the chosen source to isocenter distance is small as well. If the source to isocenter distance is set to 785 or 950 mm, the resulting minimal required scan range is 293° or 246°, respectively.
TABLE II.
Technical data of the C-arm System Artis zeego (Siemens AG).
| Source to detector distance | 1200 mm |
|---|---|
| Source to isocenter distance (adjustable) | 550–950 mm |
| Detector size | 300 × 400 mm |
| Fan angle | 19° |
3.B. Results for the numerical solution
Figure 12 shows the required rotation depending on the detector size for the different objects in Table I. For noncircular objects, the graphs clearly depict the connection between detector size used and the minimally required scan range. Further, we see that if the aspect ratio of the elliptic FOV is changed, this leads to a change of the minimally required scan range, while leaving the detector size fixed. At the point where the detector size is greater than the large diameter of the FOV, the trajectory degenerates to a normal short scan approach. For the uniform circle, only two possibilities exist. For the first case where the detector is big enough to cover the circle, a normal short scan11 is sufficient. If the detector is too small for the circle, a full 360° scan range needs to be acquired. For objects that have different dimensions in the x- and y-direction, a smaller rotation range is sufficient for a complete data set compared to a circumscribed circular object.
FIG. 12.
Required rotation for the FOVs described in Table I, containing elliptic FOVs with different aspect ratios. The source to detector distance used in this example is 574 mm.
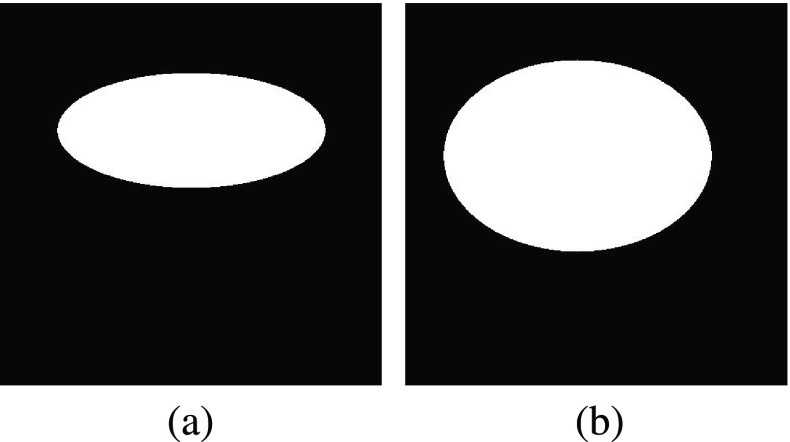
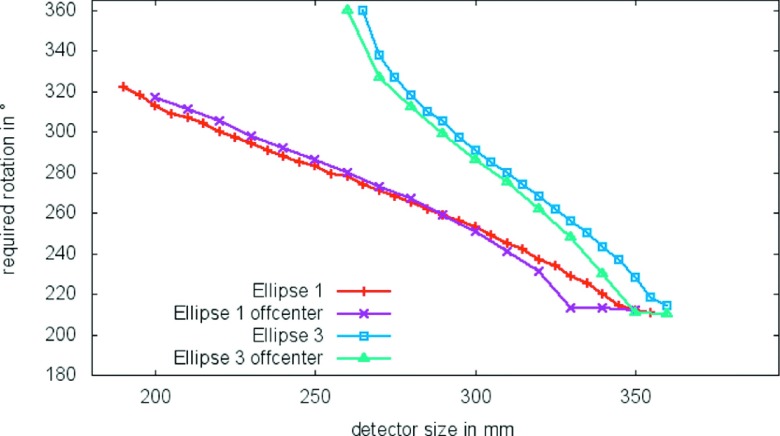
The minimal required rotation range was evaluated for off-centered FOVs (Fig. 13). Figure 14 shows the results compared to the results of the centered FOVs. The results for the off-centered FOVs are slightly different and depend on how far and in which direction they are off-center. In some cases, the required rotation range is smaller, and in some cases, the minimal required rotation range is greater. Thus, the center position is another parameter that allows modification of the scan range.
FIG. 13.
Two off-centered FOVs. (a) is the same FOV as Ellipse 1, moved in x direction. (b) is the same FOV as Ellipse 3, moved slightly in x and y direction.
FIG. 14.
Plot of required rotation for off-centered FOVs compared to centered FOVs. The source to detector distance used in this example is 574 mm.
3.C. Reconstruction results
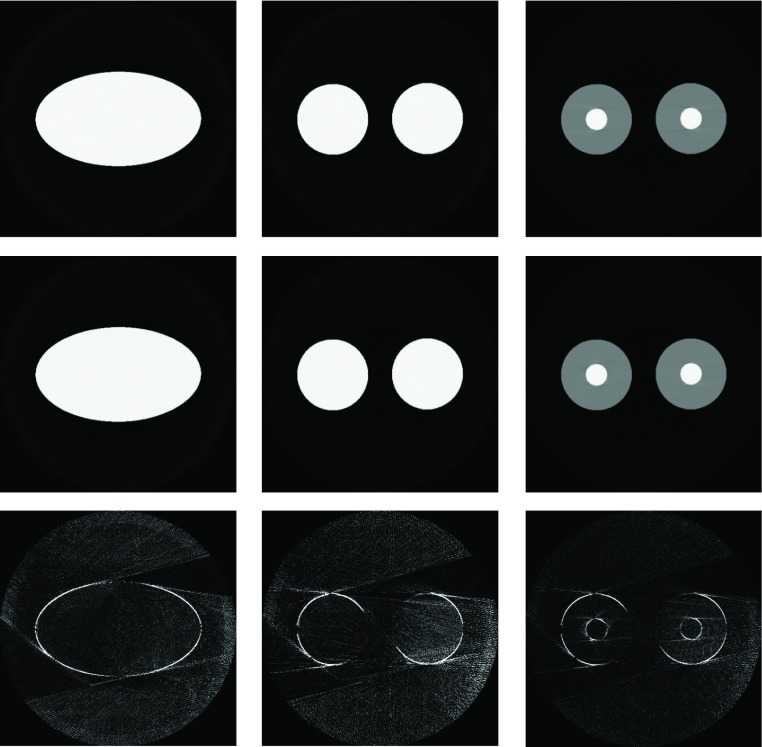
As a proof of concept of our approach, we conducted image reconstructions. First, we reconstructed using a full 360° scan range, and then the rebinned sinogram for the minimally determined scan range was reconstructed. A visual comparison of both reconstruction results is shown in Fig. 15 for an ellipse and for the object containing two circles. To show that our method is indeed independent of the intensity distributions withing the FOVs, we also adjusted the two circles with additional high-density objects in their center. The images show the reconstruction result for the full virtual sinogram (top row), for the minimally complete sinogram (middle row) and the absolute difference image (bottom row). The reconstruction results of the full virtual sinogram as well as the completed sinogram are in good agreement with each other, showing only minor deviations at the object boundaries. For a quantitative evaluation, we also computed the relative root-mean-square-error (rRMSE) for the reconstruction results. We determined an rRMSE of 1.11%, 1.15%, and 0.66% for the ellipse, the two circles and the modified two circles, respectively.
FIG. 15.
Reconstruction results, top: reconstruction of the original sinogram, middle: reconstruction of the trajectory result, bottom: absolute difference images. The gray scale window for the reconstruction results is [ − 1000, 50 HU] and for the absolute difference images [0, 50 HU]. The maximal absolute difference for the ellipse is 232 HU, for the two circles 256 HU and for the modified two circles 125 HU.
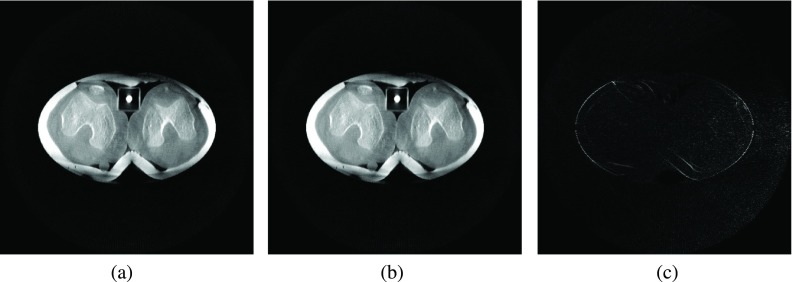
The dynamic offset was tested with simulations based on real reconstructed images. For this, a slice of a supine real dataset was extracted. Then, an elliptic area was selected. The ground truth sinogram was generated by simulating the projections of the real data. Figure 16(a) shows the reconstruction result of the ground truth sinogram. Then, we extracted the data out of the sinogram that would be acquired by performing a dynamic offset scan. This sinogram was completed according to Algorithm II. The reconstruction result is shown in Fig. 16(b). Figure 16(c) shows the absolute difference between the two reconstruction results. The highest differences appear at the high contrast areas, the low contrast areas are hardly affected. The rRMSE for this example is 0.42%.
FIG. 16.
Reconstruction results using real data. (a) shows the result for the reconstruction of the original sinogram, (b) shows the reconstruction result for the dynamic offset trajectory, and (c) shows the absolute difference between (a) and (b). The grayscale window for the reconstruction results is [ − 1000, 1000 HU] and for the absolute difference image [0, 120 HU].
4. DISCUSSION
In this work, we present a method that can be used to determine the minimally required scan range for extended and arbitrary shaped FOVs given a certain detector size. FOV extensions using a fixed detector displacement produce a circular FOV with the double radius compared to a centered detector.12,13 This comes with the cost that projections need to be acquired over a scan range of 360°. Due to space restrictions or limitations given by the scanner geometry, these large scan ranges are sometimes not feasible in an interventional suite. The presented approach, however, enables FOV shapes that are tailored to the actual object and automatically determines the minimally required scan-range to allow for an automatic trajectory planning. We show in Fig. 12 that this can result in a substantial reduction of the required scan range, especially for FOVs that are similar to ellipsoids with different semiaxis lengths.
For a FOV, as the two circles in Fig. 10(a) that consist of two or more parts, there will be some line integrals that have no attenuation and therefore result in the value zero. Nevertheless, these values are valid measurements in the convex hull and need to be included in the reconstruction. Thus, the FOV for such objects should be described by the convex hull of the objects as this is the essential variable to determine the required rotation range.
The sizes of the elliptic FOVs for the analytical and the numerical simulations differ slightly, because the resolution of the FOV for the numerical simulation is limited by the pixel size.
To date, we have considered a fixed focal spot to isocenter distance. In some systems, the focal-spot-to-detector distance could be reduced by moving the detector closer to the patient, which increases the detector size projected to the isocenter. Using this variable-isocenter distance approach, the required rotation can be further decreased. A detailed analysis of this approach would require access to the exact geometry of the system and the path planner since self- and patient-collisions would have to be considered.
We assume that the detector can be moved throughout the C-arm’s global rotation movement, which is already feasible with state-of-the-art C-arm CT scanners. The reconstruction results show that our minimally acquired sinogram achieves an almost identical reconstruction when compared to the reconstruction from the 360° reference sinogram. The difference images in the bottom row of Fig. 15 reveal that most of the deviations are located at the objects’ boundaries. We related this to the data completion step where the incomplete sinogram is filled by simple bilinear interpolation. Thus, inaccuracies are introduced in the sinograms which subsequently lead to the observable loss of spatial resolution in the reconstruction domain. In a yet to be developed online filtered back-projection algorithm, we expect less resolution loss.
For practical application, the method needs to be extended to cone beam CT (3D imaging). In a first experiment, we used an approach presented by Liu et al.20 to estimate whether a complete dataset can be acquired in cone beam scans. This method determines the percentage of voxel-wise data completeness for discretely sampled trajectories. Doing so, it is possible to model any sequence of source and detector positions. Implementation details are found in Ref. 21.
Figure 17 shows that the central slices indeed cover the intended FOV. The short scan shows a small FOV, the proposed method an ellipse, and the configuration with static detector offset a large FOV. Figure 18 shows the data completeness in z-direction. With increasing size of the FOV, the coverage in z-direction gets worse. The short scan has the best coverage and loses about 2% data completeness toward the boundary of the FOV. The coverage in z-direction is further reduced with the slight extension of the FOV in the ellipse. The biggest FOV in the static offset detector case also results in the worst coverage in z-direction. Thus, the data completeness using a dynamic detector offset in the slices below and above the central slice lies between the short scan and the large volume scan.
FIG. 17.
Visualization of the data coverage for different trajectories. A 100% coverage is achieved when all necessary line integrals for reconstruction have been acquired. (a) shows the data coverage for a standard cone beam acquisition, (b) shows the data coverage for the proposed dynamic offset trajectory, and (c) shows the data coverage for a half detector offset trajectory. The grayscale window for the data coverage is [90%, 100%].
FIG. 18.

Visualization of the data coverage for different trajectories in z-direction. For this visualization, a slice in z-direction was extracted along the superimposed line in Fig. 17(a). 100% coverage mean that all necessary line integrals for reconstruction have been acquired. (a) shows the data coverage in z-direction for a standard cone beam acquisition, (b) shows the data coverage in z-direction for the proposed dynamic offset trajectory, and (c) shows the data coverage in z-direction for a half detector offset trajectory. The grayscale window for the data coverage is [98%, 100%].
In terms of noise, we expect the method to be as robust as any filtered back-projection-type reconstruction method. Common noise reduction methods will be applicable with minor modifications.22 Furthermore, truncation correction can be applied as in any C-arm scan.23
The trajectory has to be determined prospectively. One way how this could be done is to define a set of different FOVs, e.g., for different knee sizes. Before the acquisition, the suitable FOV has to be chosen. In the clinical protocol that we have in mind, we will have prior scan data in supine position that will give us quite exact knowledge on the object to be scanned.
For practical application, we plan to mark the isocenter on the floor. Thus, the patients will be approximately isocentered and the orientation of the axes of the ellipse will be known. We will expand the VOI by approximately 10%–15% to allow for slight patient motion. Thus, we expect to have robust positioning in a real application.
In practice, it is wise to have an overlap between the sinograms,14 that can help to avoid truncation artifacts, e.g., caused by small vibrations of the CBCT system.
For future work, we plan to compute the redundancy weights for these trajectories, such that we no longer need to complete the sinogram before reconstruction.
There are some other concepts to reduce the required scan range. They are called reduced fan beam scan24 or super short scan.25 These papers show reconstruction methods for the part of the object that lies within the convex hull of the source trajectory. The main problem that is solved by these methods is that they are able to reconstruct the part within the convex hull exactly while the part that lies outside the convex hull is not reconstructed or reconstructed with artifact. For the proposed dynamic offset trajectory, the object is always completely within the convex hull of the source trajectory. Thus, reconstruction of the entire object is generally possible as the scan is complete. Our focus in on how we can reduce redundancy in the scan to save angular scan range.
5. SUMMARY
In C-arm computed tomography, the detector is often too small for the region of interest. Recent trajectories are designed for circular fields of view. This configuration allows two minimal sets: the short scan and the large volume scan.
For imaging of certain parts of the human body, the required FOV may be noncircular, e.g., for imaging of the thorax, abdomen, or knees. In this paper, we presented an approach to minimize the required rotation for fan-beam geometry. We showed how to analytically compute the minimal required scan range for ellipsoidal objects. For other, arbitrary shaped objects, we presented a numerical method to investigate scan length vs detector size. We further showed that there exists a continuum of solutions for some noncircular objects and that reconstruction from such trajectories yields image qualities comparable to a full scan acquisition.
ACKNOWLEDGMENTS
We acknowledge funding support from NIH Shared Instrument Grant No. S10 RR026714 supporting the zeego@StanfordLab, and Siemens AX. The authors also gratefully acknowledge funding of the Research Training Group 1773 Heterogeneous Image Systems and the Erlangen Graduate School in Advanced Optical Technologies (SAOT) by the German Research Foundation (DFG).
APPENDIX: COMPUTATION OF INTERSECTION POINTS
To compute the functions α1(β) and α2(β) for ellipses, we start from the parallel beam case where the boundaries of an ellipse are denoted as follows:26
| (A1) |
Transforming the equation to fan beam geometry using17
| (A2) |
| (A3) |
leads to
| (A4) |
This equation has to be solved for α. Applying the addition theorems for cosine and sine and division by cos2(α) leads to
| (A5) |
With x ≔ tan(α) Eq. (A5) can be written as
| (A6) |
where
| (A7) |
| (A8) |
| (A9) |
Defining
| (A10) |
the solutions of the quadratic equation (A6) are
| (A11) |
The solutions for α are therefore given by
| (A12) |
Next, we want to compute the intersections of α1(β) translated by the fan angle w and α2(β). For this purpose, we have to solve the equation
| (A13) |
for β. This is possible with the addition theorem for the arcustangens27
| (A14) |
We set for X and for Y so that
| (A15) |
Computing
| (A16) |
we can assume XY < 1 for D > 2max(a, b). Thus, Eq. (A13) becomes
| (A17) |
With K ≔ − tan(w)/2, the equation to be solved is
| (A18) |
We further compute
| (A19) |
and with Eq. (A6), Eq. (A18) becomes
| (A20) |
and with the equality arccos(−δ) = π − arccos(δ), we finally get the solutions
| (A21) |
REFERENCES
- 1.Choi J.-H., Maier A., Keil A., Pal S., McWalter E. J., Beaupré G. S., Gold G. E., and Fahrig R., “Fiducial marker-based correction for involuntary motion in weight-bearing C-arm CT scanning of knees. II. Experiment,” Med. Phys. 41, 061902(16pp.) (2014). 10.1118/1.4873675 [DOI] [PMC free article] [PubMed] [Google Scholar]
- 2.Muhit A. A.et al. , “Peripheral quantitative CT (pQCT) using a dedicated extremity cone-beam CT scanner,” Proc. SPIE 8672, 867203 (2013). 10.1117/12.2006939 [DOI] [PMC free article] [PubMed] [Google Scholar]
- 3.Hirschmann A., Pfirrmann C. W. A., Klammer G., Espinosa N., and Buck F. M., “Upright cone CT of the hindfoot: Comparison of the non-weight-bearing with the upright weight-bearing position,” Eur. Radiol. 24, 553–558 (2014). 10.1007/s00330-013-3028-2 [DOI] [PubMed] [Google Scholar]
- 4.Besier T. F., Draper C. E., Gold G. E., Beaupré G. S., and Delp S. L., “Patellofemoral joint contact area increases with knee flexion and weight-bearing,” J. Orthop. Res. 23, 345–350 (2005). 10.1016/j.orthres.2004.08.003 [DOI] [PubMed] [Google Scholar]
- 5.Patel V. V., Hall K., Ries M., Lindsey C., Ozhinsky E., Lu Y., and Majumdar S., “Magnetic resonance imaging of patellofemoral kinematics with weight-bearing,” J. Bone Jt. Surg. 85, 2419–2424 (2003). [DOI] [PubMed] [Google Scholar]
- 6.Zbijewski W.et al. , “A dedicated cone-beam CT system for musculoskeletal extremities imaging: Design, optimization, and initial performance characterization,” Med. Phys. 38, 4700–4713 (2011). 10.1118/1.3611039 [DOI] [PMC free article] [PubMed] [Google Scholar]
- 7.Tuominen E. K. J., Kankare J., Koskinen S. K., and Mattila K. T., “Weight-bearing CT imaging of the lower extremity,” Am. J. Roentgenol. 200, 146–148 (2013). 10.2214/AJR.12.8481 [DOI] [PubMed] [Google Scholar]
- 8.Carrino J. A.et al. , “Dedicated cone-beam CT system for extremity imaging,” Radiology 270, 816–824 (2013). 10.1148/radiol.13130225 [DOI] [PMC free article] [PubMed] [Google Scholar]
- 9.Fave X.et al. , “Upright cone beam CT imaging using the onboard imager,” Med. Phys. 41, 061906 (11pp.) (2014). 10.1118/1.4875682 [DOI] [PubMed] [Google Scholar]
- 10.Maier A., Choi J.-H., Keil A., Niebler C., Sarmiento M., Fieselmann A., Gold G., Delp S., and Fahrig R., “Analysis of vertical and horizontal circular C-arm trajectories,” Proc. SPIE 7961, 796123 (2011). 10.1117/12.878502 [DOI] [Google Scholar]
- 11.Parker D. L., “Optimal short scan convolution reconstruction for fan beam CT,” Med. Phys. 9, 254–257 (1982). 10.1118/1.595078 [DOI] [PubMed] [Google Scholar]
- 12.Schäfer D. and Grass M., “Cone-beam filtered back-projection for circular x-ray tomography with off-center detector,” in Proceeding of the 10th International Meeting on Fully Three-Dimensional Image Reconstruction in Radiology and Nuclear Medicine, Beijing, PR China (Beijing, 2009), pp. 86–89. [Google Scholar]
- 13.Kunze H. and Dennerlein F., “Cone beam reconstruction with displaced flat panel detector,” in Proceeding of the 10th International Meeting on Fully Three-Dimensional Image Reconstruction in Radiology and Nuclear Medicine, Beijing, PR China (Beijing, 2009), pp. 138–141. [Google Scholar]
- 14.Wang G., “X-ray micro-CT with a displaced detector array,” Med. Phys. 29, 1634–1636 (2002). 10.1118/1.1489043 [DOI] [PubMed] [Google Scholar]
- 15.Choi J.-H., Fahrig R., Keil A., Besier T. F., Pal S., McWalter E. J., Beaupré G. S., and Maier A., “Fiducial marker-based correction for involuntary motion in weight-bearing C-arm CT scanning of knees. Part I. Numerical model-based optimization,” Med. Phys. 40, 091905 (12pp.) (2013). 10.1118/1.4817476 [DOI] [PMC free article] [PubMed] [Google Scholar]
- 16.Herbst M., Schebesch F., Berger M., Fahrig R., Hornegger J., and Maier A., “Improved trajectories in C-Arm computed tomography for non-circular fields of view,” inProceedings of the Third International Conference on Image Formation in X-ray Computed Tomography, edited by Noo F. (Salt Lake City, UT, 2014), pp. 274–278. [Google Scholar]
- 17.Zeng G. L., Medical Image Reconstruction (Springer, Berlin, Germany, 2010). [Google Scholar]
- 18.Manhart M., Dennerlein F., and Kunze H., “Online cone beam reconstruction with displaced flat panel detector,” in Proceedings of the First International Conference on Image Formation in X-Ray Computed Tomography, edited by Noo F. (Salt Lake City, UT, 2010), pp. 53–55. [Google Scholar]
- 19.Maier A., Hofmann H., Berger M., Fischer P., Schwemmer C., Wu H., Müller K., Hornegger J., Choi J.-H., Riess C., Keil A., and Fahrig R., “ conrad—A software framework for cone-beam imaging in radiology,” Med. Phys. 40, 111914 (8pp.) (2013). 10.1118/1.4824926 [DOI] [PMC free article] [PubMed] [Google Scholar]
- 20.Liu B., Bennett J., Wang G., De Man B., Zeng K., Yin Z., Fitzgerald P., and Yu H., “Completeness map evaluation demonstrated with candidate next-generation cardiac CT architectures,” Med. Phys. 39, 2405–2416 (2012). 10.1118/1.3700172 [DOI] [PMC free article] [PubMed] [Google Scholar]
- 21.Maier A., Kugler P., Lauritsch G., and Hornegger J., “Discrete estimation of data completeness for 3D scan trajectories with detector offset,” Bildverarbeitung für die Medizin 2015 (Springer, Heidelberg, Germany: ), pp. 47–52. [Google Scholar]
- 22.Maier A., Wigström L., Hofmann H., Hornegger J., Zhu L., Strobel N., and Fahrig R., “Three-dimensional anisotropic adaptive filtering of projection data for noise reduction in cone beam CT,” Med. Phys. 38, 5896–5909 (2011). 10.1118/1.3633901 [DOI] [PMC free article] [PubMed] [Google Scholar]
- 23.Dennerlein F. and Maier A., “Region-of-interest reconstruction on medical C-arms with the ATRACT algorithm,” Proc. SPIE 8313, 83131B (2012). 10.1117/12.913274 [DOI] [Google Scholar]
- 24.Zou Y., Pan X., and Sidky E. Y., “Image reconstruction in regions-of-interest from truncated projections in a reduced fan-beam scan,” Phys. Med. Biol. 50, 13–27 (2005). 10.1088/0031-9155/50/1/002 [DOI] [PubMed] [Google Scholar]
- 25.Arai I., Kudo H., Noo F., Defrise M., and Pack J. D., “A new class of super-short-scan algorithms for fan-beam reconstruction,” in IEEE Nuclear Science Symposium Conference Record (IEEE, New York, NY, 2005), Vol. 4, pp. 2296–2300. [Google Scholar]
- 26.Kak A. C. and Slaney M., Principles of Computerized Tomographic Imaging (Society for Industrial and Applied Mathematics, Philadelphia, PA, 2001). [Google Scholar]
- 27.Bronstein I. N.et al. , in Taschenbuch der Mathematik (Springer, Berlin, Germany, 2012), Vol. 1. [Google Scholar]


