

Abstract
The mdx mouse model of Duchenne muscular dystrophy (DMD) is used to study disease mechanisms and potential treatments, but its pathology is less severe than DMD patients. Other mouse models were developed to more closely mimic the human disease based on knowledge that upregulation of utrophin has a protective effect in mdx muscle. An mdx:utrophin−/− (dko) mouse was created, which had a severe disease phenotype and a shortened life span. An mdx:utrophin+/− mouse was also created, which had an intermediate disease phenotype compared to the mdx and dko mice. To determine the usefulness of mdx:utrophin+/− mice for long-term DMD studies, limb muscle pathology and function were assessed across the life span of wild-type, mdx, mdx:utrophin+/−, and dko mice. Muscle function assessment, specifically grip duration and rotarod performance, demonstrated that mdx:utrophin+/− mice were weaker for a longer time than mdx mice. Mean myofiber area was smaller in mdx:utrophin+/− mice compared to mdx mice at 12 months. Mdx:utrophin+/− mice had a higher percentage of centrally nucleated myofibers compared to mdx mice at 6 and 12 months. Collagen I and IV density was significantly higher in mdx:utrophin+/− muscle compared to mdx at most ages examined. Generally, mdx:utrophin+/− mice showed an intermediate disease phenotype over a longer time course compared to the mdx and dko mice. While they do not genetically mirror human DMD, mdx:utrophin+/− mice may be a more useful animal model than mdx or dko mice for investigating long-term efficacy of potential treatments when fibrosis or muscle function is the focus.
Keywords: Collagen, dystrophin, fibrosis, mouse models, muscle disease, muscle function, muscular dystrophy, skeletal muscle, utrophin
Introduction
Duchenne muscular dystrophy (DMD), one of the most common inherited muscle degenerative disorders, is an X-linked recessive disease that affects 1 in every 3500 live male births (Emery 1991). Patients suffer progressive wasting of both skeletal and cardiac muscle, which results in an eventual loss of ambulation and death in the third decade due to cardiac and respiratory failure. DMD is caused by a mutation in the dystrophin gene, which encodes a 427 kDa protein that is found at the sarcolemma in both skeletal and cardiac muscle (Kunkel et al. 1986). Dystrophin is a vital component of the dystrophin-associated protein complex, which connects the cytoskeleton of individual myofibers to the basal lamina (Campbell and Kahl 1989). Absence of dystrophin results in a loss of this complex, and compromises the sarcolemma leading to cycles of muscle fiber degeneration and regeneration, chronic inflammation, and fibrosis (Matsumura and Campbell 1994; McNally and Pytel 2007). There is currently no cure for DMD, although various potential therapies are being tested (Fairclough et al. 2011; Pichavant et al. 2011). In order to assess the efficacy of these treatments, an animal model is required. Ideally, this model should be readily available, inexpensive, well characterized, and the disease process should be phenotypically similar to human DMD patients.
The most widely studied animal model of DMD is the mdx mouse, which arose from a spontaneous mutation in an inbred line of C57BL/10 mice (Bulfield et al. 1984). These mice harbor a nonsense mutation in exon 23 of the dystrophin gene, eliminating the expression of dystrophin in all tissues (Sicinski et al. 1989). Mdx mice appear to have normal skeletal muscle until approximately 3–4 weeks of age. At this time, myofibers undergo massive degeneration, with close to 100% of the fibers replaced or repaired (DiMario et al. 1991). This involves continuous cycles of degeneration and regeneration of new fibers over the next month. The mice develop significant inflammation within both the diaphragm and limb muscles; this spontaneously subsides in the limb muscles, but not the diaphragm (Carnwath and Shotton 1987; Stedman et al. 1991). By 10 weeks, excluding the diaphragm, there is minimal limb skeletal muscle fibrosis (Stedman et al. 1991). Along with this relatively benign adult muscular phenotype, mdx mice have a near normal lifespan and minimal skeletal muscle motor deficits until they become quite aged, over 18 to 20 months (Dangain and Vrbova 1984; Carnwath and Shotton 1987; Muntoni et al. 1993). Thus, while the mdx mice are genetically similar to the human disease, it is not a good phenocopy of the functional loss of limb muscle function (Lynch et al. 2001). The mdx mouse has been extremely useful in studying pathologic processes and potential therapies; however, a mouse model that more closely mimics the human disease course would be beneficial.
The pathology in human DMD patients is more severe than in the mdx mouse model and is muscle dependent (Muller et al. 2001). For example, to create significant muscle force deficits in the mdx mouse, injury using maximal activation had to be employed, and this injury was unrelated to animal age (Dellorusso et al. 2001). The myofibers in mdx mice also may be better able to compensate for the lack of dystrophin with its autosomal homolog utrophin. Utrophin is normally located at the neuromuscular and myotendinous junctions in adult skeletal muscle (Khurana et al. 1991), but has been found outside of these locations in both DMD and mdx myofibers (Helliwell et al. 1992). Exogenous expression of utrophin attenuated the dystrophic pathology in mdx mice, indicating that utrophin could compensate for dystrophin when expressed at high levels (Tinsley et al. 1996). In order to determine if endogenous utrophin expression was at least partially responsible for the mild disease seen in mdx mice, a mouse line that lacked both proteins was generated (Deconinck et al. 1997; Grady et al. 1997). These mice, called double knockouts (dko), display a much more severe phenotype than the mdx mice, exhibiting an earlier onset of the initial degeneration/regeneration events. However, while dystrophic pathology spontaneously subsides in mdx mice, it persists in the dko mice. Premature death of the dko mice between 6 and 20 weeks due to their severe muscle pathology makes it difficult for investigators to obtain or maintain colonies of the dko mice (Rafael et al. 1998), and impossible to study the long-term effects of potential treatments.
A mouse model intermediate in severity between mdx and dko mice would be advantageous for investigators. Several years ago, mice that lack dystrophin and are haploinsufficient for utrophin (mdx:utrophin+/−) were examined for their muscle pathology profile (Zhou et al. 2008). The mdx:utrophin+/− mice have a nearly normal lifespan, and develop more severe muscle pathology than the mdx mice (Zhou et al. 2008; Huang et al. 2011) but much less pathology when compared to the dko mice. In order to fully assess the usefulness of this mouse model in long-term DMD studies, limb muscle histopathology and functional capacity was assessed in the mdx:utrophin+/− mice in the first year of life and compared to WT and mdx mice at the same time points. These results were compared to the dko mice at the terminal stage of their disease, between 1 to 2 months. In addition, WT and mdx:utrophin+/− mice were examined at two time points during aging to determine if aging affects long-term pathology.
Methods
Animal care
All experiments were approved by the Institutional Animal Care and Usage Committee at the University of Minnesota and performed in accordance with NIH guidelines for use of animals in research. Animals used in experiments were maintained by Research Animal Resources at the University of Minnesota. Mice were raised in 12-h light/dark cycles and were allowed to feed and drink ad libitum. C57BL/10 mice (Harlan Laboratories, Madison, WI) were used as wild-type (WT) controls. Dystrophic mice (mdx, mdx:utrophin−/− [dko], and mdx:utrophin+/−) were maintained as a colony at the University of Minnesota through mdx:utrophin+/− breeding pairs that originated from Washington University (ECR 42). Mice were weighed using a digital scale (Detecto, Webb City, MO). Genotyping confirmation and utrophin levels in the four genotypes have been assessed. In the triceps muscles there was a decreased level of utrophin in the mdx:utrophin+/− muscles, and a confirmed absence in the mdx:utrophin−/− (dko) mice (A. A. McDonald, S. L. Hebert, and L. K. McLoon, unpubl. data). Triceps were selected in part due to the early and significant involvement in proximal arm muscles compared to distal arm muscles (Pane et al. 2014). All WT mice were males except at 12 months where four of the 11 were female; all mdx:utrophin+/− mice were males except four out of 6 at 16 months, and all mdx mice were males.
Grip test
A mesh grip test was used to assess the grip endurance of the mice (Gomez et al. 1997), performed as suggested by the TREAT-NMD network (http://www.treat-nmd.eu/research/preclinical/dmd-sops/). This apparatus tests the duration of grip by measuring the ability of the mouse to remain clinging to a wire mesh when turned upside down. A large piece of foam was located below the mice to cushion their fall. Mice were tested in a quiet room and acclimated to the room for 15 min prior to testing. The grip test apparatus was opened, and the mouse set on the mesh grid of the apparatus lid. As the lid was raised to a vertical position, and then subsequently lowered to the fully closed position, the mouse was gently supported. Once the apparatus was fully shut, a timer was started. If the mouse released its grip before 5 sec, it was immediately placed back on the mesh and retested. Mice were given one re-attempt if they fell. The time at which the mice released their grip was recorded. However, if the mouse maintained its hold on the lid for the maximal time of 5 min, they were gently removed from the apparatus. Many of the mdx:utrophin+/− mice could not maintain their grip on the apparatus lid for more than a few seconds. As such, we recorded their grip duration, despite the fact that they were shorter than 5 sec. Mice were tested twice, with a 20-min rest between trials. A minimum of 6 WT and mdx:utrophin+/− mice were weighed every month from 1 month to 12 months, and then again at 17 and 18 months. Six mdx mice were tested at 3, 6, and 12 months of age. The same mice were used for the lifespan measurements of grip duration and rotarod function, tracking changes in the same cohorts over time.
Rotarod
Seven to 12 mice per group (WT, mdx, mdx:utrophin+/−) were tested on a Rotarod apparatus (Stoelting, Wood Dale, IL) at the indicated ages from 1 to 12 months old (Kaspar et al. 2003). Three to four mice were also tested from the ages of 18 to 21 months. Mice were placed on a stationary rod, which was then rotated at a constant speed of 4 rpm for 10 sec. If any mice fell off the rod during this initial 10 sec, they were immediately placed back on the rod for a retry. Mice were given only two retries. If the mouse fell a third time, it was immediately placed back in its cage and scored a 0. Following the 10-sec acclimation time, the rod was accelerated on a 5-min slope, which brought the speed of the rotation from 4 rpm to a maximum of 40 rpm at a constant rate over 5 min. Once acceleration began, latency to fall was recorded with a maximum time of 5 min (300 sec) on the rod; the speed of the rotarod at the time of fall was also recorded. This was repeated three times, with a rest of 20 min between trials, and the results averaged. Animals were subjected to a 3-day training protocol before being tested on the fourth day, which acclimated the mice to the rotarod. The same mice were used for the lifespan measurements of rotarod, tracking changes in the same cohorts over time.
Histological methods
Six mice for each age examined were euthanized by carbon dioxide inhalation. Immediately following sacrifice the triceps muscles of the left and/or right forelimb were dissected, embedded in tragacanth gum, and frozen in 2-methylbutane chilled to a slurry on liquid nitrogen. Sections of frozen tissue were prepared at 12 μm using a cryostat and stored at −30°C until stained. One set of sections was stained with hematoxylin and eosin and used for the analysis of mean myofiber cross-sectional area and central nucleation, a hallmark of muscle degeneration/regeneration cycles. Fibrosis of the muscle was examined by collagen I and IV immunohistochemistry. Satellite cell density was assessed by the quantification of Pax-7-positive satellite cells. Immunohistochemical localization followed our standard laboratory methods. Muscle sections were incubated in 10% normal serum that matched the animal host of the secondary antibody in phosphate-buffered saline (PBS) containing triton X-100, followed by incubation for 1 h at room temperature in one of the following antibodies: Pax7 (1:3000; Aviva Systems Biology, San Diego, CA), collagen type I and IV (1:1000) (abcam, Cambridge, MA), or with antibodies to MyHCIIb (supernatant), MyHCIIa (supernatant), MyHC-all but 2X (1:100), MyHC-embryonic (1:40) (Hybridoma Bank, Iowa City, IA), MyHC type I (1:1000) (Chemicon, Temecula, CA) or MyHC-neonatal (1:20; Vector Laboratory, Burlingame, CA) for either 1 h at room temperature or overnight at 4°C. Revertant fibers were assessed for dystrophin expression by incubation for 1 h at room temperature in an antibody to dystrophin (1:500; abcam). Incubation in primary antibody was followed by a rinse in PBS, followed by sequential incubation in reagents from the peroxidase ABC VectaElite or ABC Vectastain kits (Vector Laboratories), and developed with diaminobenzidine containing heavy metals.
Additional sections were prepared for the visualization of utrophin (1:200; Santa Cruz, Santa Cruz, CA). The primary antibody to utrophin had an overnight incubation in humid chambers, the slides were rinsed in PBS, and incubated in goat anti-rabbit AF488 secondary antibody (1:2000; Jackson Immunoresearch, West Grove, PA) for 1 h. After a rinse in PBS, the slides were coverslipped with Vectashield mounting medium.
Morphometric analysis
Morphometric analysis of fiber sizes and myogenic precursor cell density were performed using Bioquant Life Science software using our published methods (Anderson et al. 2006) (Bioquant, Nashville, TN). A minimum of three slides were counted for each set of triceps muscles examined from each animal, with a minimum of 200 myofibers assayed per slide. Care was taken in all sections to measure in different regions. For the MyHC isoforms, due to fiber type grouping and heterogeneous localization in the dystrophic samples, 400 fibers were counted per slide to ensure that an adequate area was covered. For the dystrophic muscles, this is less of an issue, due to the changes in fascicular patterns in different regions of the muscle length. Values for each animal were averaged, and the averages for each genotype and age were averaged. For central nucleation, data are presented as percent of centrally nucleated myofibers per total fiber number. For Pax7-positive cell density, data are presented as percent of Pax7-postive cells per total fiber number. Fibrosis was quantified by setting a threshold for the collagen I or IV immunostained tissue, calculating the area of positive immunostaining and dividing this area by total area/sections counted. This gives data as percent fibrosis per total muscle cross-sectional area.
Statistics
All statistical analyses were performed using Prism statistical software (GraphPad Software Inc., San Diego, CA). Analysis of variance (ANOVA) and Tukey's multiple comparisons tests were used for multiple group comparisons. Data were considered statistically significantly different if P < 0.05. Statistical significance is indicated in each figure.
Results
Utrophin immunostaining
To confirm the significant differences in utrophin expression in the four genotypes, immunostaining with utrophin was performed (Fig.1). In the WT muscle utrophin was found at the sites of neuromuscular junctions (Fig.1A), with essentially no utrophin outside of the endplate zone (Fig.1B). In the mdx limb muscle, utrophin was found at the neuromuscular junctions in the endplate zone but also was found to be highly elevated around individual myofibers (Fig.1C, red arrow) both in the endplate zone and on myofibers outside of the endplate zone (Fig.1D) In the mdx:utrophin+/− (het) mice limb muscles, utrophin was expressed at the neuromuscular junctions in the endplate zone but was not upregulated in other regions (Fig.1E). While some slight staining for utrophin could be seen partially surrounding individual myofibers, the numbers of myofibers were always low and the staining was quite low. As expected, in the dko limb muscles, no utrophin immunostaining was seen (Fig. 1F).
Figure 1.
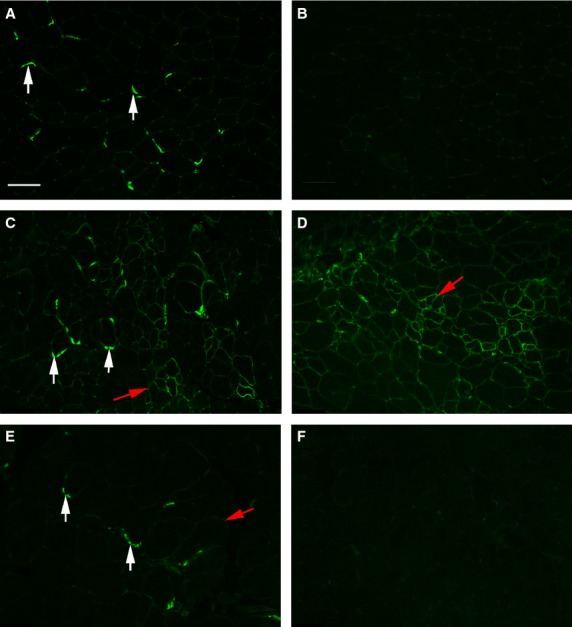
Immunostaining for Utrophin in WT, mdx, mdx:utrophin+/− (het), and mdx:utrophin−/− (dko) mice. (A, B) WT muscle. (A) As expected WT mice expressed utrophin at the sites of neuromuscular junctions (white arrows). (B) Essentially no utrophin was seen in the WT muscle outside of the endplate zone. (C, D) mdx muscle. (C) In the mdx limb muscle, utrophin was found at the neuromuscular junctions in the endplate zone but was also elevated around individual myofibers (red arrow). (D) Utrophin was also found around individual myofibers outside of the endplate zone in the mdx limb muscle. (E) In the mdx:utrophin+/− (het) mice limb muscles, utrophin was expressed at the neuromuscular junctions in the endplate zone but was not upregulated in other regions. Some slight utrophin could be seen partially surrounding individual myofibers, but the numbers of fibers were always low and the staining dim. (F) As expected, in the dko limb muscles, no utrophin immunostaining was seen.
Animal weights
Animal weights were recorded up through 18 months for the WT and mdx:utrophin+/− mice, and at 1, 3, 6, and 12 months for the mdx mice (Fig.2). There was a slow, steady increase in weight in the WT mice. The mdx mice were lighter at 6 months than WT mice. By 1 year, the mdx mice showed a great variability in weight, but the mean weight was not significantly different. As was true for all the genotypes, the weights of the mdx:utrophin+/− mice increased from 1 to 3 months. This is in contrast to the mdx mice. At 3 months the mdx:utrophin+/− mice were 20.8% heavier than the wild-type or mdx mice, which was significant. The mdx:utrophin+/− mice reached a peak weight between 6 and 7 months, where they were 33.8% heavier than the mdx mice and 23.7% heavier than the WT mice. The weights were then stable up until 12 months of age. These mice then showed a slow decrease in body weight over the next 6 months, with a 30% decrease in weight from 12 to 18 months. This continued up through 23 months (not shown).
Figure 2.
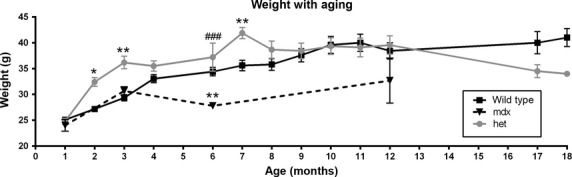
Change in weight over time in WT, mdx, and mdx:utrophin+/− (het) mice. Graph of weights (grams) of WT mice over an 18 month period, mdx mice for 12 months, and mdx:utrophin+/− (het) mice over an 18 month period. *Indicates significant difference from WT controls. #Indicates significant difference from mdx mice. One symbol is P < 0.05. Two symbols are P < 0.01. Three symbols are P < 0.001.
Grip duration
Muscle function was assessed using two methods. Using a test of grip duration, all mice showed a decline over time (Fig.3A). However, the initial grip duration at 1 month for the mdx:utrophin+/− mice was only 18% of that seen in wild-type mice and 23% of that seen in the mdx mice. At 3 months grip duration of the mdx:utrophin+/− was only 3.8% of that seen in WT mice and 4.7% of that seen in the mdx mice. By 6 months of age, the mdx and WT mice had similar grip durations, while the mdx:utrophin+/− mice had consistently and significantly shorter grip duration, approximately 23% of the duration time of the other two mice types. By 12 months the grip duration of the mdx:utrophin+/− was essentially zero, while grip duration for both the WT and mdx mice had not significantly changed from the 6 month level and with the mdx:utrophin+/− values 5.8% and 3.97% of the WT and mdx mice. When grip duration was normalized to weight (Fig.3B), the same differences were seen, with significant differences in the grip duration between the mdx:utrophin+/− mice and both the WT and mdx mice, while no significant difference was present between the WT and mdx mice. The dko mice were unable to maintain their grip even at 1 month of age (not shown).
Figure 3.
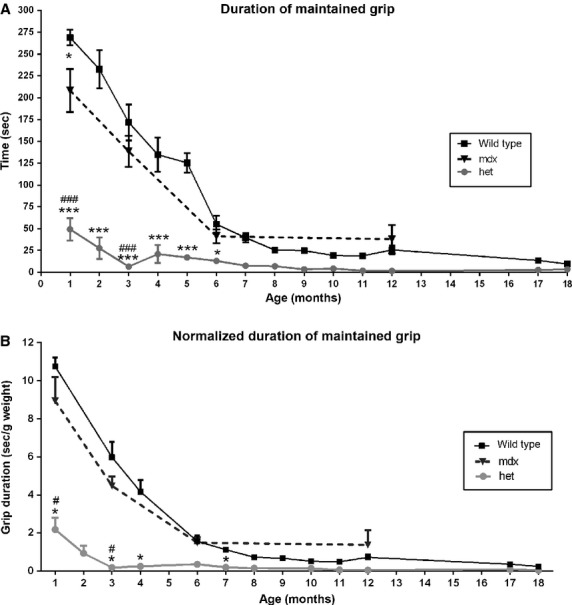
Test of Grip Duration. (A) WT, mdx, and mdx:utrophin+/− (het) mice grip duration from 1 to 18 months. (B) WT, mdx, and mdx:utrophin+/− (het) mice grip duration normalized to weight. *Indicates significant difference from WT. #Indicates significant difference from mdx mice. One symbol is P < 0.05. Two symbols are P < 0.01. Three symbols are P < 0.001.
Rotarod testing
Using a rotarod test, both latency to fall (Fig.4A and B) and maximum speed achieved on the rotarod (directly proportional to latency to fall data; not shown) were determined for the wild-type, mdx, and mdx:utrophin+/− mice. For the WT mice, their latency to fall was fairly steady over the first 5 months of life, averaging approximately 100 sec, after which the latency slowly declined. After the first 6 months, there was a reduction in both the latency to fall, which dropped to between 39% and 48% of the 3 month WT mice levels between 7 and 12 months (Fig.4A). As expected, in the old mice, their ability to remain on the rotarod was extremely impaired. The mdx mice had a latency to fall that was 51.3% of WT at 3 months, yet by 6 months the mdx mice had a latency to fall similar to the WT mice (Fig.4A). In contrast, the mdx:utrophin+/− mice had a latency to fall that was significantly shorter than the WT and mdx mice, with their latency to fall 40% less than the WT mice at 3 months but 45.3% less than both WT and mdx mice at 6 months. This was followed by a steady decline in their ability to stay on the rotarod. They reached a low point at 8 months when their latency was 92.2% less than age-matched WT mice. Their latency to fall did not recover and stayed at a level approximately 64.7 to 78.5% of the wild-type mice for up to 1 year. Thus, the mdx:utrophin+/− mice were more fatigable in these assays over a longer time period. It is interesting to note that at 18 months, the aging wild-type and mdx:utrophin+/− mice showed a similar performance on the rotarod tests. This is presumably due to changes associated with aging in the WT mice.
Figure 4.
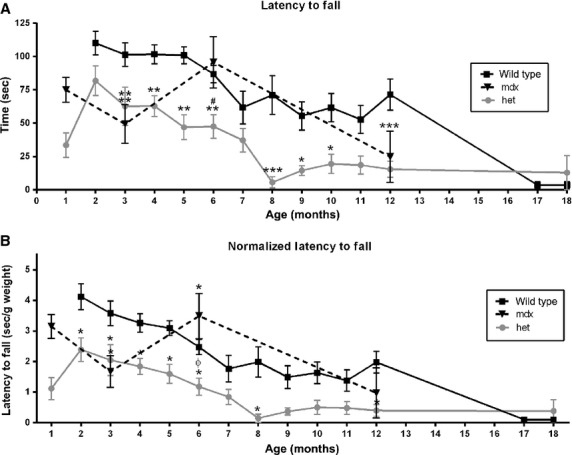
Rotarod Testing. (A) Latency to fall in WT, mdx, and mdx:utrophin+/− (het) mice. (B) Latency to fall normalized to weight in WT, mdx, and mdx:utrophin+/− (het) mice. *Indicates significant difference from WT controls. #Indicates significant difference from mdx mice. ϕ indicates significant difference between mdx and het mice. One symbol is P < 0.05. Two symbols are P < 0.01. Three symbols are P < 0.001.
Since the WT, mdx, and mdx:utrophin+/− mice gained weight differentially over the duration of their lives, as with grip duration, the rotarod measurements for latency to fall were normalized to weight (Fig.4B). The same relationships relative to differential latency to fall were seen when weight was taken into account. As expected, analysis of maximum rotarod speed achieved showed similar changes to those seen with latency to fall (data not shown), with the mdx:utrophin+/− mice consistently and significantly less able to perform this task than WT controls from 3 to 12 months. When normalized to weight, a similar picture was seen (data not shown). The dko mice were unable to stay on the rotarod, even at 1 month of age (not shown).
Myofiber cross-sectional changes
DMD results in repeated cycles of myofiber degeneration and regeneration. This is represented over time by the appearance of regenerated myofibers containing centrally located nuclei as well as increasing heterogeneity in myofiber cross-sectional area, with eventual myofiber atrophy (McNally and Pytel 2007). Mean myofiber cross-sectional areas were determined for the WT, mdx, mdx:utrophin+/−, and dko mice (Fig.5). Over the lifespan examined, no significant change in mean myofiber cross-sectional area was seen in the triceps muscles from the WT mice. The mean cross-sectional areas of the triceps muscles from the mdx, mdx:utrophin+/−, and dko mice were all significantly smaller than their age-matched WT control muscles except for the mdx mice at 12 months (Fig.5A). The myofibers from the dko mice at 2 months were significantly smaller in mean cross-sectional area when compared to the means of both mdx and mdx:utrophin+/− at 6 months and mdx at 12 months. There appeared to be a slow decrease in mean myofiber cross-sectional areas over time in the mdx:utrophin+/− triceps muscles, but this was only significantly different between the 6 and 20 month mdx:utrophin+/− muscles. There were no other significant differences in any of the other pairwise comparisons.
Figure 5.
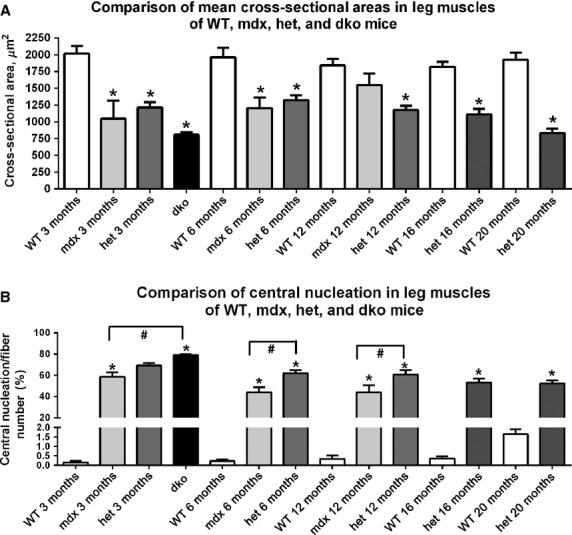
Morphometric analysis of triceps muscle sections from age-matched WT, mdx, mdx:utrophin+/− (het), and dko mice comparing (A) mean cross-sectional area from 3 months to 20 months. *Indicates significant difference from age-matched WT. #Indicates significant difference from dko triceps. Morphometric analysis of triceps muscle sections from age-matched WT, mdx, mdx:utrophin+/− (het), and dko mice comparing (B) central nucleation from 3 months to 20 months. *Indicates significant difference from age-matched WT. #Indicates significant difference between mdx and mdx:utrophin+/− (het) (shown with brackets). Brackets indicate significant differences between the two indicated genotypes.
Measurements of mean myofiber cross-sectional areas often hide important differences in the myofiber population. In order to assess this, histograms were prepared of individual myofiber areas separated into 200 μm2 size bins (Fig.6). At 3 months (2 months for the dko mice), the histograms of all the dystrophic mouse myofibers sizes were similar to each other, with larger numbers of fibers in the 200–1000 μm2 range. In both the mdx and mdx:utrophin+/− dystrophic genotypes, physical performance of grip duration and rotarod latency to fall was extremely poor, at 3 months, suggesting that the presence of smaller fibers potentially has significant functional sequelae (Fig.6A). By 6 months of age, the distribution of the mdx myofiber areas began to resemble the WT distribution while in the mdx:utrophin+/− mice the myofibers were still clustered in the 200–1200 μm2 range (Fig.6B). This is very interesting in light of the relatively normal grip duration and rotarod performance of the mdx mice at this time point. By 12 months of age, the distribution of the mdx myofibers overlapped that of the WT completely, while the distribution of myofiber areas of the mdx:utrophin+/− were still clustered in the 200–1200 μm2 range (Fig.6C). This was reflected in the inability of the mdx:utrophin+/− mice to maintain grip, while the WT and mdx mice had a similar performance.
Figure 6.

Histogram of all cross-sectional areas of triceps muscles separated by fiber size in 200 μm2 bins. (A) Representative individual WT, mdx, mdx:utrophin+/− (het), and mdx:utrophin−/− dko limb muscles at 3 months. The dko muscles were examined from a 2-month-old mouse. Note that the myofibers from the dystrophic mouse muscles tended to cluster at the smaller mean cross-sectional areas, although certainly very large myofibers were also present. (B) Representative individual WT, mdx, and mdx:utrophin+/− (het) limb muscles at 6 months. Note that by 6 months the mdx profile had begun to resemble that of the WT mice, while the mdx:utrophin+/− (het) limb muscles still retained more fibers with smaller cross-sectional areas. (C) Representative individual WT, mdx, and mdx:utrophin+/− (het) limb muscles at 12 months. Note that even at 12 months, while the mdx myofiber areas completely overlapped those of the WT mouse, the mdx:utrophin+/− (het) limb muscle fibers still remained clustered at the smaller cross-sectional areas.
Central nucleation
Assessment of density of centrally nucleated myofibers was performed (Fig.5B). As expected, very few myofibers in normal WT triceps muscles contained centrally located nuclei at any of the ages examined, with 0.16 ± 0.07%, 0.22 ± 0.1%, 0.35 ± 0.2%, and 0.36 ± 0.12% at 3, 6, 12, and 16 months respectively. At 20 months, the presence of centrally nucleated myofibers was 1.65 ± 0.27%, which was not significantly different. For all the age-matched comparisons of the data from the dystrophic genotypes to the WT muscles, there was a significantly increased density of centrally nucleated myofibers compared to the WT controls. In addition there were significantly more centrally nucleated myofibers in the mdx:utrophin+/− muscles compared to the mdx levels at both 6 and 12 months, rising to 61.87 ± 2.9 and 60.57 ± 4.2% respectively. The density of centrally nucleated myofibers in the dko triceps muscles was significantly elevated over all other genotypes at all time points examined, with a density of 78.9 ± 1.1%.
Fiber typing
Shifts in fiber type distribution, as characterized by myosin heavy chain isoform (MyHC) expression, are often seen in muscle disease (Reiser et al. 1985; Sweeney et al. 1986). Triceps muscles from the WT, mdx, mdx:utrophin+/−, and dko mice were examined for changes in type I, IIa, IIb, IIx, embryonic, and neonatal MyHC-positive myofiber density (Figures7–10). Figure7 shows the distribution of type IIa-positive myofibers in WT (A), dko (B), mdx (Fig.7C, E) and mdx:utrophin+/− (Fig.7D, F) triceps muscles at 3 months (Fig.7C, D) and 12 months (Fig.7E, F). In WT mice, IIa fibers were found in a sparse mosaic pattern throughout the muscle, and this pattern was the same at 3, 6, and 12 months of age (Fig.7A, G). Although density went from 8.8 ± 2% at 3 months to 3.9 ± 1.4% at 12 months, there was no significant difference in overall type IIa myofiber density in WT mice as a result of aging. In the dko mice at 2 months, large clusters of type IIa myofibers were seen, with an overall fiber density of 10.0 ± 2%, but it did not significantly differ from the other genotypes at 3 months. Their organization suggested fiber type grouping associated with denervation/reinnervation (Fig.7B). In the mdx muscles, expression patterns of type IIa myofibers were not significantly different from age-matched controls, nor between the mdx muscles at any of the ages included. In the muscles from the mdx:utrophin+/− mice, at both 3 months and 6 months the type IIa fibers were in a mosaic pattern with the clustering associated with fiber type grouping (Fig.7D). However, in the 12 month mdx:utrophin+/− muscles, the IIa-expressing myofibers were preferentially lost, with a density of 0.9 ± 0.2% (Fig.7F, G), which was significantly different from the 12 month age-matched WT and mdx values.
Figure 7.
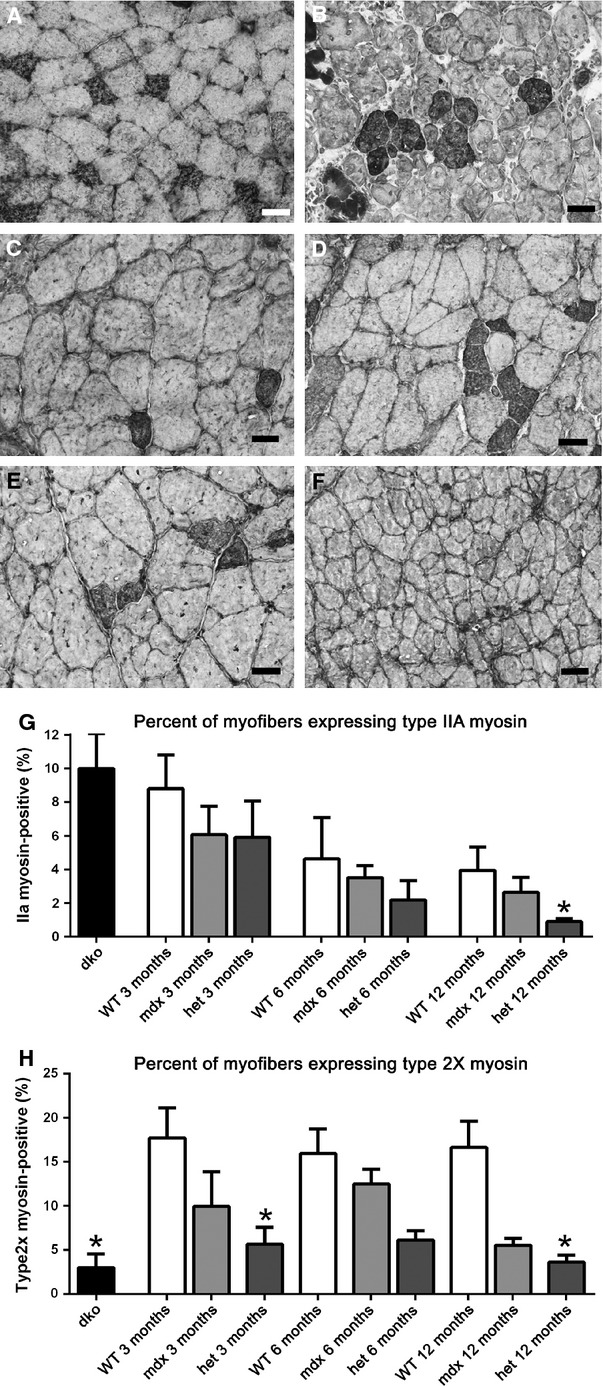
Type IIa fast, fatigue-resistant myofiber density and type IIx fast, fatigable myofiber density in triceps muscles of WT, mdx, mdx:utrophin+/− (het), and dko mice. (A) WT control at 3 months showed a mosaic pattern of expression, and was representative of the pattern of type IIa myofiber expression at all ages examined. (B) dko muscle at 2 months shows an increase in myofibers positive for type IIa with clear evidence of fiber type grouping. (C) mdx muscles at 3 months have a mosaic pattern of type IIa myofibers similar to WT triceps but slightly reduced in density. (D) mdx:utrophin+/− (het) triceps muscles at 3 months show evidence of fiber type grouping. (E) mdx muscles at 12 months have retained the mosaic pattern of IIa staining with some evidence of fiber type grouping. (F) mdx:utrophin+/− (het) muscles at 12 months have almost no IIa-positive myofibers. (G) Morphometric analysis of density of IIa myofibers in each of the four genotypes examined. Age-matched statistical comparisons indicate that a significant difference was seen only at 12 months, with the density significantly lower in the mdx:utrophin+/− muscles compared to the WT and mdx muscles. (H) Morphometric analysis of density of IIx myofibers in each of the four genotypes examined. Age-matched statistical comparisons indicate that a significant difference was seen at 3 and 12 months in the mdx:utrophin+/− (het) compared to age-matched WT controls as well as the density in the dko muscles compared to 3 month WT muscles. *Indicates significant difference from WT. Bar is 20 μm.
Figure 10.
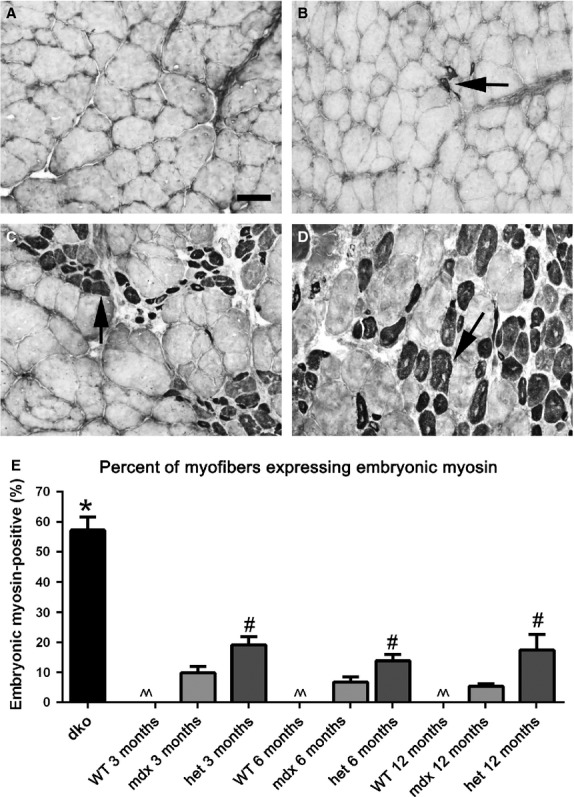
Morphometric analysis of embryonic MyHC-positive myofiber density in WT, mdx, mdx:utrophin+/− (het), and dko triceps muscles. Photomicrographs of (A) WT, (B) mdx, (C) mdx:utrophin+/− (het) all at 3 months of age, and (D) dko muscles at 2 months immunostained for embryonic MyHC expression. Arrows indicate positive myofibers. Bar is 50 μm. (E) Morphometric analysis of density of embryonic MyHC-positive myofibers. ^^Indicates that there were essentially no embryonic MyHC-positive myofibers in the WT muscles. *Indicates significant difference from 3 month WT. #Indicates significant difference between the age-matched mdx and mdx:utrophin+/− (het) muscle.
A relatively similar pattern was seen with the type IIx-expressing myofibers in the WT, mdx, and mdx:utrophin+/− muscles, with significant differences between WT and mdx:utrophin+/− densities at 3 and 12 months, going from 17.7 ± 3.4% to 5.63 ± 1.9% at 3 months and from 16.63 ± 2.98% to 3.6 ± 0.8% at 12 months, respectively (Fig.7H). Unlike the alterations in the density of type IIa myofibers in the dko triceps, the density of IIx-positive myofibers was significantly decreased in the dko triceps muscles at 2 months compared to WT at 3 months, with a density of 22.96 ± 1.58% in the dko muscles (Fig.7H). Decreases in type IIa and IIx fibers would be hypothesized to result in increased muscle fatigability; however, they represent a minority of the myofibers in the triceps muscle.
The triceps in WT were composed largely of type IIb myofibers (Fig.8). Type IIb fibers are fast twitch, fatigable myofibers. While over time in the dystrophic genotypes fiber grouping was increasingly present, there were no differences in the mean density of type IIb myofibers between any of the genotypes examined at any of the ages in this study.
Figure 8.
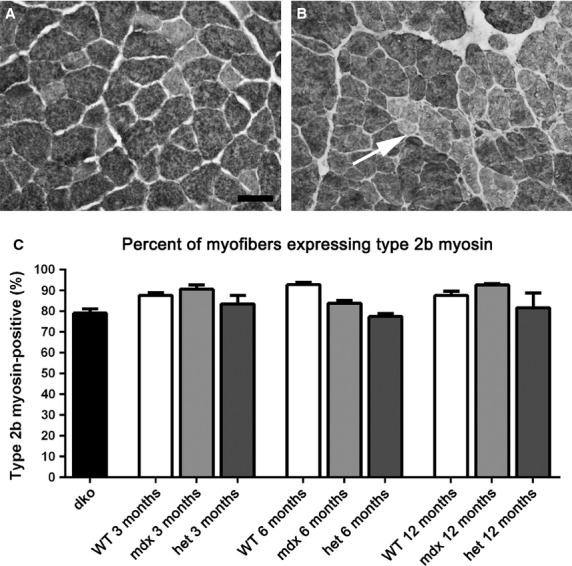
Morphometric analysis of type IIb myofiber density in WT, mdx, mdx:utrophin+/− (het), and dko triceps muscles. (A) The vast majority of the myofibers in the WT triceps muscles were IIb-positive. WT muscle at 6 months is shown. (B) At 6 months in the mdx:utrophin+/− (het) muscles, groups of type IIb negative myofibers were seen indicative of fiber type grouping. Bar is 50 μm. (C) Morphometric analysis of the density of IIb myofibers showed no significant differences between any of the age-matched genotypes.
The density of type I myofibers, which are slow twitch and fatigue resistant, was assessed (Fig.9). In 3-month-old WT mice, the type I myofibers only represented 5.57 ± 2.2% of the myofibers in the triceps muscles examined. In the mdx triceps at 3 months, scattered type I myofibers could be found, similar to that seen in WT triceps at 1.9 ± 0.6% (Fig.9A, E). Type I myofibers had largely disappeared in mdx mice at 6 and 12 months, at 0.9 ± 0.8% and 0.24 ± 0.08%, respectively (Fig.9B, E). In the mdx:utrophin+/− muscles the density of type I myofibers was significantly elevated over the level of age-matched control or mdx muscles (Fig.9C, E). At 3 months and 6 months, 10.0 ± 1.0% and 8.7 ± 2.3% of the myofibers were type I myosin positive; the density then decreased to 4.92 ± 0.3% of the total myofiber number by 12 months, respectively. The dko mouse muscles contained a significantly greater density of type I myofibers than all the other genotypes examined at all ages examined, with an average density of 22.32 ± 3.67% (Fig.9D, E), and evidence of fiber type grouping.
Figure 9.
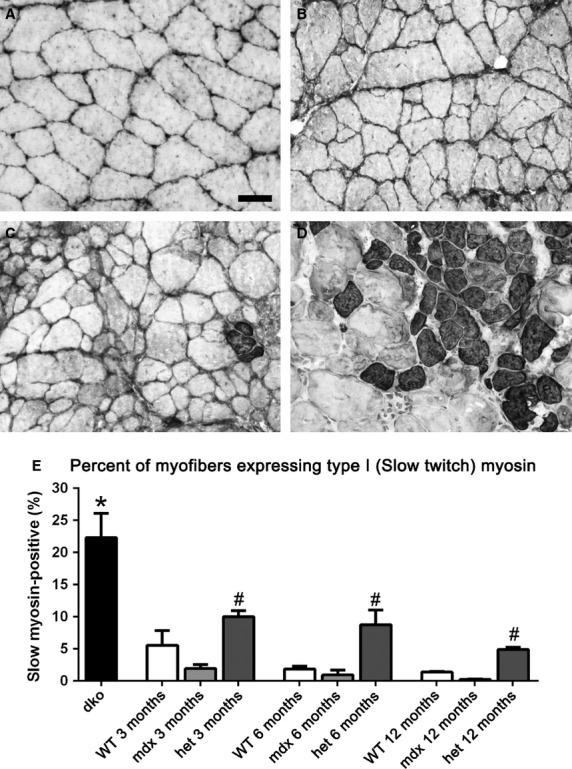
Morphometric analysis of type I slow twitch myofiber density in WT, mdx, mdx:utrophin+/− (het), and dko triceps muscles. Photomicrographs of (A) WT, (B) mdx, (C) mdx:utrophin+/− (het) all at 3 months of age, and (D) dko muscles at 2 months immunostained for type I MyHC expression. Bar is 50 μm. (E) Morphometric analysis of density of type I myofibers. *Indicates significant difference from 3 month WT. #Indicates significant difference between the age-matched mdx and mdx:utrophin+/− (het) muscle.
Normal mouse triceps muscle essentially did not contain myofibers positive for either embryonic or neonatal MyHC at 3, 6, or 12 months (Fig.10), although 1–4% of the myofibers expressed embryonic MyHC in the normal triceps at 16 and 20 months of age (not shown). The triceps muscles from the mdx mice had a small number of embryonic MyHC-positive myofibers averaging 9.9 ± 2.1%, 6.7 ± 1.8%, and 5.47 ± 0.7% at 3, 6, and 12 months, respectively. There was a significant difference in the density of embryonic MyHC-expressing myofibers in the mdx:utrophin+/− mice with 19.12 ± 2.65%, 13.86 ± 2.01%, and 17.42 ± 5.2% expressing embryonic MyHC at 3, 6, and 12 months respectively (Fig.10C, E), with significant fiber type grouping visible in the tissue sections. The density of embryonic MyHC-positive myofibers in dko mice was significantly elevated compared to all other genotypes, at 57.2 ± 4.34% (Fig.10D, E).
There were very few neonatal MyHC-positive myofibers in the triceps muscles in any of the genotypes examined at any of the ages examined (not shown).
Formation of revertant myofibers
One hypothesis for the return of muscle function to relatively normal levels in the mdx mice is the formation of revertant myofibers that once again express dystrophin (Wilton et al. 1997; Yokota et al. 2006; Arechavala-Gomeza et al. 2010). The numbers of revertant fibers were examined in age-matched sections of triceps muscles from WT, mdx, mdx:utrophin+/−, and dko mice (Fig.11A–G). As has been well described in the literature in both human DMD patients and the mdx mouse, the triceps muscles from the mdx mice at all ages examined had revertant myofibers that were scattered randomly throughout the muscle. In the mdx mice at 3 months, approximately 3 ± 1% of the myofibers expressed dystrophin, and this dropped to 1.8 ± 0.9% and 0.9 ± 0.6% at 6 and 12 months respectively (Fig.11B, G). At 3 months, the percentage of revertant myofibers in the mdx:utrophin+/− mice was 1.2 ± 0.08%, and this percentage did not change at any of the ages examined, nor was it significantly different from the mdx mouse level (Fig.11G). In addition, there were myofibers with only partial expression around the sarcolemmal circumference (Fig.11C). Myofibers with extensions of dystrophin into their cytoplasm were also seen (Fig.11C). Myofibers with these intracellular dystrophin extensions were always extremely hypertrophic, and were presumed to be caught in the act of fiber splitting. The dko mouse muscles had revertant fibers despite their being one to 2 months old at the time of sacrifice. However, the frequency was 0.7 ± 0.06%, which was not significantly different from the mdx and mdx:utrophin+/− muscles examined. No significant difference was seen in number of revertant fibers at any of the ages for the mdx, mdx:utrophin+/−, and dko triceps that were examined (Fig.11). Thus, while the mdx, mdx:utrophin+/−, and dko triceps muscles examined all developed revertant myofibers, their relative scarcity does not support their being involved in the return of muscle function in mdx mice.
Figure 11.
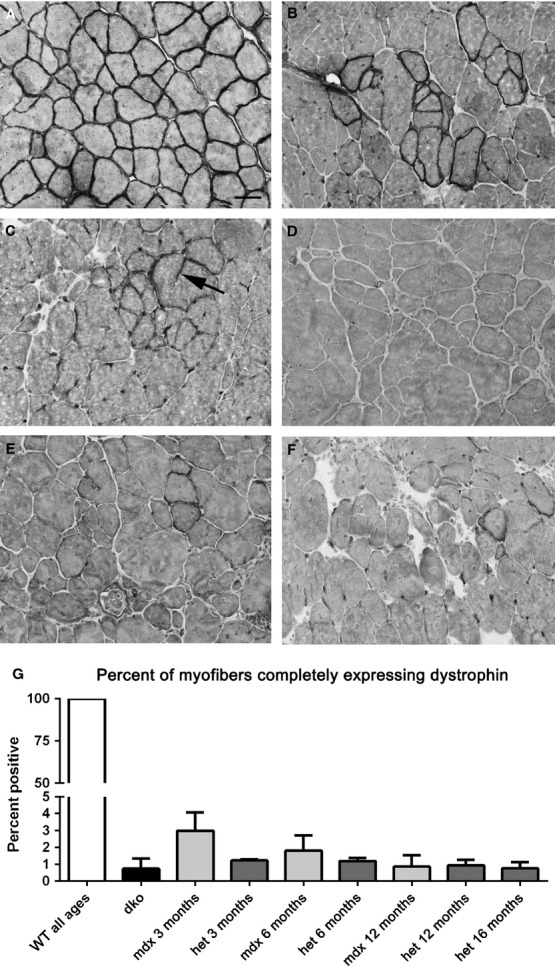
Dystrophin immunostaining in WT, mdx, mdx:utrophin+/− (het), and dko triceps muscles. (A) All the myofibers in WT muscles express dystrophin at their sarcolemmas. (B) mdx muscle at 6 months showing a large cluster of revertant fibers. (C) mdx:utrophin+/− (het) muscle at 6 months. Arrow points to a cytoplasmic extension of dystrophin. (D) mdx:utrophin+/− (het) at 12 months. (E) mdx:utrophin+/− (het) muscle at 16 months. (F) dko at 2 months. (G) Morphometric analysis of revertant fiber density as a percent of all myofibers. There were no significant differences between any of the dystrophic genotypes. Bar is 20 μm.
Pax7-positive satellite cells
The main regenerative stem cell population in limb skeletal muscle is the Pax7-positive satellite cell (Seale et al. 2000). The density of Pax7-positive satellite cells was determined in age-matched sections of triceps muscles from WT, mdx, mdx:utrophin+/−, and dko mice (Fig.12). The density of Pax7-positive cells in WT mice did not vary over the life span examined, ranging between 5.85 and 4.05% (Fig.12A, C). The density of this satellite cell population also stayed extremely stable throughout the lifespan of the 2 dystrophic genotypes examined. There were transient, significant elevations in Pax7-positive cell density only in the mdx:utrophin+/− mouse triceps and only at 3 and 16 months, where the density was 9.9 ± 2.8% (Fig.12B, C) and 8.8 ± 0.7%, respectively. There was an apparent drop in density of Pax7-positive cells in both the WT and mdx:utrophin+/− triceps muscles at 20 months of age, but these changes were not significantly different from any other genotype or age except at 3 months and 16 months in the mdx:utrophin+/− mice (Fig.12). The density of Pax7-positive cells was significantly decreased in dko triceps muscles compared to age-matched controls.
Figure 12.
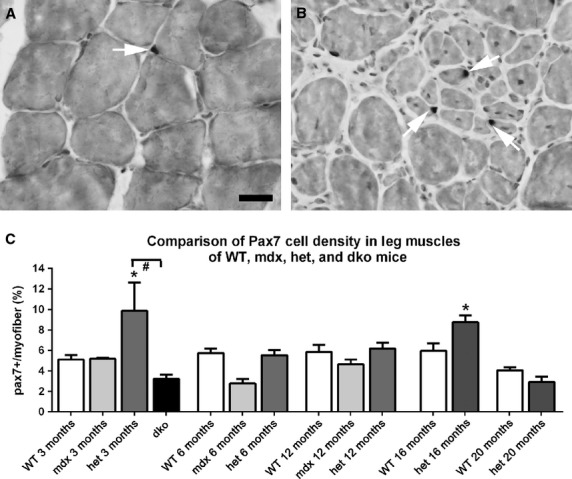
Morphometric analysis of Pax7-positive cell density in WT, mdx, mdx:utrophin+/− (het), and dko triceps muscle sections (A) WT and (B) mdx:utrophin+/− (het) muscles at 12 months of age immunostained for Pax7 (white arrows) Bar is 50 μm. (C) Morphometric analysis of Pax7-positive cell density as a percent of all myofibers. *Indicates significant difference from age-matched WT control. #Indicates significant difference between the dko and mdx:utrophin+/− Pax7-positive cell density.
Collagen density
Fibrosis has been shown to increase in dystrophic muscles, so density of two isoforms of collagen, I and IV, was assessed in the triceps muscles of WT, mdx, mdx:utrophin+/−, and dko mice (Fig.13A–E). Collagen IV is nonfibrillar, and is found in all basement membranes (Ricard-Blum and Ruggierio 2005). Collagen IV completely surrounds each myofiber, and its expression is critical for basement membrane stability. Collagen I forms fibrils within the interstitial spaces in skeletal muscle and is a major collagen isoform (Ricard-Blum and Ruggierio 2005). It plays an important role in determining muscle rigidity.
Figure 13.
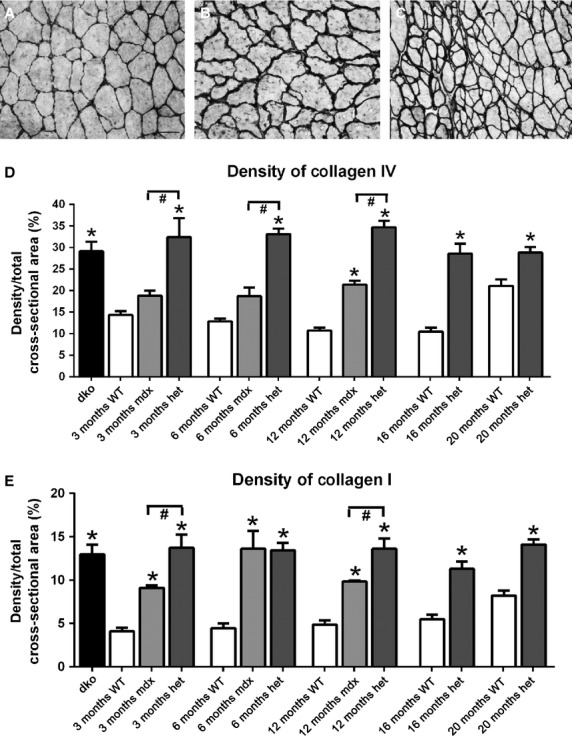
Representative photomicrographs of collagen IV immunostaining in WT (A), mdx (B) and mdx:utrophin+/− (C) triceps muscles at 12 months. Bar is 50 μm. Density of collagen IV (D) and I (E) in WT, mdx, mdx:utrophin+/− (het), and dko triceps muscles at indicated time-points. *Indicates significant difference from age-matched WT triceps muscles. #Indicates significant difference from mdx triceps muscles.
Collagen IV levels did not significantly change with aging in the WT mice over time (Fig.13D). In the mdx triceps muscles, the collagen IV density levels were not significantly different from the WT age-matched levels at 3 and 6 months, and only became significantly different from WT at 12 months (Fig.13A, B, D). However, compared to WT the mdx:utrophin+/− triceps muscles showed a significant increase in collagen IV density at all ages examined (Fig.13C, D), which was also significantly elevated over the levels of collagen IV in the mdx mice at the three time points examined in this study. The level of collagen IV in the dko mouse triceps muscles was also significantly elevated, with 29.1 ± 2.2% of the muscle cross-section containing collagen IV (Fig.13D). While significantly increased over the density of collagen IV in the WT and mdx triceps muscles at the ages examined, the density of collagen IV in the dko was not significantly different compared to the triceps muscles from the mdx:utrophin+/− mice at any of the five ages examined, which were 32.4 ± 4.4%, 33.1 ± 1.3%, 34.7 ± 1.5%, 28.56.45 ± 2.4%, and 28.85 ± 1.3%, respectively.
Collagen I was found in the interstitial space within the triceps muscles of WT mice, and did not significantly change in density over the lifespan examined in this study (Fig.13E). At all ages examined for the three dystrophic genotypes, collagen I levels were significantly elevated over the age-matched WT controls. At both 3 and 12 months the density of collagen I was significantly greater in the mdx:utrophin+/− mice than in the mdx mice, 13.7 ± 1.5% compared to 9.1 ± 0.27% at 3 months and 13.6 ± 1.2% compared to 9.8 ± 0.12% at 12 months. Increased density of collagen I would be hypothesized to play a role in increasing the rigidity of the dystrophic muscles.
Discussion
In this study, the disease course of the triceps muscles in mdx:utrophin+/− mice was studied in detail, and compared to age-matched WT and mdx triceps muscles over the first year of life to understand the role of each dystrophic genotype as a model system for understanding human pathology. The analysis was extended in WT and mdx:utrophin+/− mice up to 20 months of age. Two functional measurements, grip duration and rotarod function, were significantly decreased in the mdx:utrophin+/− mice compared to WT muscles as early as 1 month, and were significantly decreased compared to the mdx mouse at 6 months of age. It appears that the mdx:utrophin+/− mice were weaker and more fatigable than comparably aged mdx mice at 6 months. The dko mice showed severe functional deficits, and essentially were unable to do either functional test at 1 month of age. Our short-term functional results resemble the published literature for WT, mdx and the mdx:utrophin+/− mice in terms of similarity of function for the mdx and WT at the 2, 3, and 4 month time points (Spurney et al. 2009; van Putten et al. 2010, 2012; Klein et al. 2012). In one study where a long-term analysis of forelimb strength was assessed in WT and mdx mice, these two genotypes showed similar normalized strength (Connolly et al. 2001). This supports the view that over the lifespan, the mdx:utrophin+/− mice are functionally weaker than mdx mice, yet, unlike the dko mice in our hands, were still able to be tested.
The myofibers of all three dystrophic genotypes were consistently smaller than WT age-matched control triceps muscles at 3 and 6 months, with a high level of central nucleation – a measure of ongoing cycles of degeneration and regeneration. These levels were similar to what has been described in short-term studies of various limb muscles in mdx and mdx:utrophin+/− mice (Spurney et al. 2009; van Putten et al. 2010). At 12 months, the mean myofiber areas of the mdx muscles were no longer significantly smaller than WT, while the mdx:utrophin+/− triceps myofibers still maintained significantly reduced mean myofiber areas compared to WT. As expected from the published literature (Deconinck et al. 1997; Grady et al. 1997; van Putten et al. 2012), the dko triceps muscles had the greatest density of centrally nucleated myofibers and small mean myofiber cross-sectional areas. It should be noted that the dko mice only reached 2 months of age, and so these degenerative processes were quite severe considering their age. The functional and morphometric analyses of the dko muscles in our study correlate with and confirm the severity of their disease compared to other mdx:utrophin−/− mice reported in the literature with a less severe phenotype (van Putten et al. 2012). Our data also support the view that the dko mouse is a less than optimal phenocopy of DMD. Thus, there appeared to be a correlation between functional performance and maximal decreases in mean myofiber size.
The significant differences between rates of central nucleation between the mdx and mdx:utrophin+/− triceps muscles at 6 and 12 months were not mirrored in changes in Pax7 cell density. Interestingly, the density of Pax7-positive satellite cells was only significantly elevated in the mdx:utrophin+/− triceps at the 3 and 16 month time points. This short-term upregulation was insufficient to restore myofiber cross-sectional areas in the mdx:utrophin+/− triceps, however. The dko triceps muscles at 2 months already had significantly decreased Pax7 cell density compared to all three other genotypes, correlating with their significantly smaller myofibers and greater density of central nucleation. This correlation with decreased Pax7 cell density is supported by numerous studies showing significantly reduced proliferative potential of myogenic precursor cells isolated from mdx and dko mice (Renault et al. 2000; Lu et al. 2014).
The WT muscles did not show evidence of changes associated with aging up through the 20 months examined; this agrees with previous studies of aging-associated changes in skeletal muscles within this time period (Musaro et al. 2001; Snow et al. 2005). Based on our analysis, the normal triceps muscle in WT mice contains about 70–80% type IIb fibers, approximately 8–10% of both type IIa and IIx, and about 5% type I myofibers. There was a significant increase in type I myofiber density in the mdx:utrophin+/− muscles, mainly at the expense of IIa and IIx myofibers. In the dko mice there was a fourfold greater density of type I slow, fatigue-resistant fibers than in all the other genotypes. This was previously described in a gene array study, where they suggested that the type I myofibers might play a role in the increased severity of the dko phenotype (Baker et al. 2006). It seems more likely that upregulation of slow myosin expressing myofibers might be an attempted compensatory mechanism to increase muscle function, albeit insufficient for the task. Future studies are required to differentiate between these possibilities. Similarly, while myofibers expressing type IIa myosin, which are fast contracting and fatigue resistant, were reduced in the mdx:utrophin+/− muscles compared to the mdx muscles, their overall density was quite low in all genotypes at all ages. Myofiber switching in muscle disease and injury is extremely common and not well understood. A survey of the literature demonstrates that many skeletal muscles from dystrophic genotypes share a similar trend, with increased density of slow myofibers (hind limb: Baker et al. 2006; soleus: Carnwath and Shotton 1987; soleus, diaphragm: Deconinck et al. 1998; deltoid: Mariani et al. 1991; temporalis, soleus: Spassov et al. 2013), while other studies show a reverse trend (soleus: Earnshaw et al. 2002; vastus lateralis: Webster et al. 1988). Based on the functional assays performed in this study, differences in performance are unlikely to be related to altered myosin heavy chain isoform expression patterns. Numbers of revertant fibers also were not significantly different between the three dystrophic genotypes. Thus, except for grip duration and rotarod function, there were few differences between the mdx and mdx:utrophin+/− mouse triceps muscles through the first year of life – with the main difference being significant decreases in myofiber size and increased evidence of degeneration/regeneration in the form of centrally nucleated myofibers – suggesting a higher rate of muscle pathology in the mdx:utrophin+/− triceps muscles. The dko mice showed significant muscle pathology; almost 60% of the myofibers were small and positive for embryonic MyHC. In our hands these mice were extremely sick, and all were euthanized no later than 2 months of age.
These findings support the proposed compensatory role of utrophin in aiding the preservation of muscle function and reducing pathologic changes in limb muscles in the absence of dystrophin (Khurana et al. 1991; Tinsley et al. 1998). Previous work found that the onset of dystrophic disease in the mdx mouse corresponded to the time when utrophin was downregulated at the sarcolemma and localized only at the neuromuscular junctions and myotendinous junctions (Khurana et al. 1991). In addition, overexpression of utrophin was shown to rescue the muscular dystrophy phenotype in mouse models of DMD (Tinsley et al. 1996, 1998), including the dko mouse (Wakefield et al. 2000). This protective role for utrophin upregulation is also consistent with the more severe phenotype seen in the dko mice that lack both dystrophin and utrophin (Deconinck et al. 1998; Rafael et al. 1998; Janssen et al. 2005). In the current study muscle performance between the WT and mdx mice differed from the pattern seen in the mdx:utrophin+/− mice at 6 and 12 months of age. In both grip duration and rotarod function, mdx:utrophin+/− mice performed significantly more poorly than their counterparts at earlier ages. This agrees with previous studies showing that haploinsufficiency for utrophin results in a more severe functional deficit than seen in the mdx mouse (van Putten et al. 2012). By extending the functional studies to 6 and 12 months, it is evident that the mdx:utrophin+/− muscles maintain their weakness beyond that seen for the mdx mice. The sharp decline in performance on the grip duration and rotarod apparatuses among the mice was presumed to reflect the muscle pathology seen histologically. The grip duration test, in particular, is a multi-variable test that requires both strength and endurance from the animals. As the mouse weights increased as the animals aged, this could impact their ability to maintain grip and to run on the rotarod. However, weight as a confounding factor was ruled out by reexamination of the test data normalized to weight. In summary, the mdx:utrophin+/− mice show a significant loss of muscle performance as compared to the aged-matched WT controls and the mdx mice in these two performance tests over the course of the first year, and this difference correlated with the return of a more normal myofiber size in the mdx mice over this time period. One mechanism postulated in the literature was compensatory muscle hypertrophy that was shown to occur in the muscles of mdx mice as they aged (Coulton et al. 1988b; Dupont-Versteegden and McCarter 1992; Quinlan et al. 1992; Pastoret and Sebille 1995). Damaged or regenerating fibers have been shown to generate less force per unit mass (Brooks and Faulkner 1990). In the current study, as mean myofiber cross-sectional areas of the dystrophic muscles decreased and central nucleation increased in the mdx:utrophin+/− and dko mice, the aggregate effect was manifested by reduced functional capacity. A recent study has linked utrophin to the control of gating of mechanosensitive ion channels in dystrophic muscle (Tan and Lansman 2014). The absence or depletion of utrophin increased the conductance of these channels with the overall effect of increased calcium entry. This certainly would result in the increased pathology seen in the mdx:utrophin+/− and dko mice.
Dystrophic muscles also have increased fibrotic tissue (Carnwath and Shotton 1987; Coulton et al. 1988a,b; Lefaucheur et al. 1995; Pastoret and Sebille 1995). Fibrosis increases passive muscle stiffness, which would alter both range of motion and effective shortening velocity (Gillies and Lieber 2011). In our study there was a higher density of type I and IV collagen in mdx:utrophin+/− compared to WT muscles and a higher density of collagen I in mdx compared to WT triceps muscles, but no difference in collagen IV density in mdx compared to WT triceps until 12 months of age. Collagen I is normally found in the interstitial connective tissue, and plays an important role in muscle rigidity (Ricard-Blum and Ruggierio 2005). The increased density of collagen I in all three dystrophic genotypes would have significant impact on muscle function but could not account for the differences in the performance of these mice. Collagen IV is found in basement membranes and plays an important role in myofiber stability, allowing for transmission of force within muscle fascicles (Schleip et al. 2006). This basement membrane collagen was significantly increased around the myofibers of the mdx:utrophin+/− mice compared to age-matched WT and mdx triceps muscles. Certainly this increase in collagen IV would correlate with increased muscle fatigability. In fact, pharmacologic reduction in collagen levels in mdx muscles resulted in improved motor function, exercise capacity, and increased fatigue resistance of the treated muscles (Huebner et al. 2008; Turgeman et al. 2008; Swiderski et al. 2014). Using a different drug strategy in the mdx mice model, reduction in fibrosis alone, with no change in muscle structure or pathology, resulted in improved muscle force characteristics (Steinberger et al. 2014). In fact, a recent study focused on strategies to increase fibrosis in the mdx mouse in order to improve its use as a more relevant model for testing novel therapies to treat DMD (Pessina et al. 2014). Thus, relative to fibrotic changes, the mdx:utrophin+/− would appear to be a better model based on its natural disease course. The role of collagen in the dystrophic muscle phenotype is often overlooked; however, there is substantial evidence that the increased collagen IV density in the mdx:utrophin+/− compared to the mdx mice correlates well with the functional differences displayed by these two dystrophic phenotypes.
Overall, the functional tests and histopathology of the mdx:utrophin+/− mice suggest that at least in the first 12 months, it may represent a better mouse model for DMD than either the mdx or dko mouse models. The mdx:utrophin+/− mice maintained functional deficits and displayed an intermediate dystrophic pathology that persisted throughout their lifespan. The mdx:utrophin+/− mice also have a near normal lifespan, making them a better option for testing chronic DMD therapies than the dko mouse, with its significantly reduced lifespan. This is supported by a recent study demonstrating that testing antisense oligonucleotides showed a stronger therapeutic effect in the mdx:utrophin+/− compared to mdx mouse (Tanganyika-deWinter et al. 2012). It should be noted that the method of testing needs to be carefully considered. Certainly the increased weakness of the mdx:utrophin+/− mice in functional tests would extend the time line for the testing of potential treatment modalities. Other research has shown that mdx:utrophin+/− mice have respiratory function impairment that is worse than mdx mice (Huang et al. 2011), as well as increased inflammation and fibrosis (Zhou et al. 2008), in addition to the overall increase in collagen I and IV density over time shown in the present study. While they do not genetically mirror DMD in human patients, we propose that mdx:utrophin+/− mice might serve as a more useful animal model for DMD than either the mdx or dko mice for investigating long-term functional efficacy of potential treatments.
Acknowledgments
We thank Ted Graber for the loan of the grip strength apparatus, as well as his help with the grip strength and rotarod analysis. We also thank Walter Low for the loan of his rotarod apparatus. We have no conflict of interest associated with this submission. We acknowledge the University of Minnesota Muscular Dystrophy Core Laboratories for providing us with mice used in this study (P30-AR0507220). Portions of this publication were contained within the PhD thesis of A.A. McDonald.
Conflict of Interest
None declared.
References
- Anderson BC, Christiansen SP, Grandt S, Grange RW. McLoon LK. Increased extraocular muscle strength with direct injection of insulin-like growth factor-1. Invest. Ophthalmol. Vis. Sci. 2006;47:2461–2467. doi: 10.1167/iovs.05-1416. [DOI] [PMC free article] [PubMed] [Google Scholar]
- Arechavala-Gomeza V, Kinali M, Feng L, Guglieri M, Edge G, Main M, et al. Revertant fibres and dystrophin traces in Duchenne muscular dystrophy: implication for clinical trials. Neuromuscul. Disord. 2010;20:295–301. doi: 10.1016/j.nmd.2010.03.007. [DOI] [PubMed] [Google Scholar]
- Baker PE, Kearney JA, Gong B, Merriam AP, Kuhn DE, Porter JD, et al. Analysis of gene expression differences between utrophin/dystrophin-deficient vs mdx skeletal muscle reveals a specific upregulation of slow muscle genes in limb muscles. Neurogenetics. 2006;7:1–91. doi: 10.1007/s10048-006-0031-7. [DOI] [PubMed] [Google Scholar]
- Brooks SV. Faulkner JA. Contraction-induced injury: recovery of skeletal muscles in young and old mice. Am. J. Physiol. 1990;258:C436–C442. doi: 10.1152/ajpcell.1990.258.3.C436. [DOI] [PubMed] [Google Scholar]
- Bulfield G, Siller WG, Wight PAL. Moore KJ. X chromosome-linked muscular dystrophy (mdx) in the mouse. Proc. Natl Acad. Sci. USA. 1984;81:1189–1192. doi: 10.1073/pnas.81.4.1189. [DOI] [PMC free article] [PubMed] [Google Scholar]
- Campbell KP. Kahl SD. Association of dystrophin and an integral membrane glycoprotein. Nature. 1989;338:259–262. doi: 10.1038/338259a0. [DOI] [PubMed] [Google Scholar]
- Carnwath JW. Shotton DM. Muscular dystrophy in the mdx mouse: histopathology of the soleus and extensor digitorum longus muscles. J. Neurol. Sci. 1987;80:39–54. doi: 10.1016/0022-510x(87)90219-x. [DOI] [PubMed] [Google Scholar]
- Connolly AM, Keeling RM, Mehta S, Pestronk A. Sanes JR. Three mouse models of muscular dystrophy: the natural history of strength and fatigue in dystrophin-, dystrophin/utrophin-, and laminin a2-deficient mice. Neuromuscul. Disord. 2001;11:703–712. doi: 10.1016/s0960-8966(01)00232-2. [DOI] [PubMed] [Google Scholar]
- Coulton GR, Curtin NA, Morgan JE. Partridge TA. The mdx mouse skeletal muscle myopathy: II Contractile properties. Neuropathol. Appl. Neurobiol. 1988a;14:299–314. doi: 10.1111/j.1365-2990.1988.tb00890.x. [DOI] [PubMed] [Google Scholar]
- Coulton GR, Morgan JE, Partridge TA. Sloper JC. The mdx mouse skeletal muscle myopathy: I. A histological, morphometric and biochemical investigation. Neuropathol. Appl. Neurobiol. 1988b;14:53–70. doi: 10.1111/j.1365-2990.1988.tb00866.x. [DOI] [PubMed] [Google Scholar]
- Dangain J. Vrbova G. Muscle development in mdx mutant mice. Muscle Nerve. 1984;7:700–704. doi: 10.1002/mus.880070903. [DOI] [PubMed] [Google Scholar]
- Deconinck AE, Rafael JA, Skinner JA, Brown SC, Potter AC, Metzinger L, et al. Utrophin-dystrophin-deficient mice as a model for Duchenne muscular dystrophy. Cell. 1997;90:717–727. doi: 10.1016/s0092-8674(00)80532-2. [DOI] [PubMed] [Google Scholar]
- Deconinck N, Rafael JA, Beckers-Bleukx G, Kahn D, Deconinck AE, Davies KE, et al. Consequences of the combined deficiency in dystrophin and utrophin on the mechanical properties and myosin composition of some limb and respiratory muscles of the mouse. Neuromuscul. Disord. 1998;8:362–370. doi: 10.1016/s0960-8966(98)00048-0. [DOI] [PubMed] [Google Scholar]
- Dellorusso C, Crawford RW, Chamberlain JS. Brooks SV. Tibialis anterior muscles in mdx mice are highly susceptible to contraction-induced injury. J. Muscle Res. Cell Motil. 2001;22:467–475. doi: 10.1023/a:1014587918367. [DOI] [PubMed] [Google Scholar]
- DiMario JX, Uzman A. Strohman RC. Fiber regeneration is not persistent in dystrophic (mdx) mouse skeletal muscle. Dev. Biol. 1991;148:314–321. doi: 10.1016/0012-1606(91)90340-9. [DOI] [PubMed] [Google Scholar]
- Dupont-Versteegden EE. McCarter RJ. Differential expression of muscular dystrophy in diaphragm versus hindlimb muscles of mdx mice. Muscle Nerve. 1992;15:1105–1110. doi: 10.1002/mus.880151008. [DOI] [PubMed] [Google Scholar]
- Earnshaw JC, Kyprianou P, Krishan K. Dhoot GK. Differentiation of original and regenerated skeletal muscle fibres in mdx dystrophic muscles. Histochem. Cell Biol. 2002;118:19–27. doi: 10.1007/s00418-002-0428-9. [DOI] [PubMed] [Google Scholar]
- Emery AE. Population frequencies of inherited neuromuscular diseases – a world survey. Neuromuscul. Disord. 1991;1:19–29. doi: 10.1016/0960-8966(91)90039-u. [DOI] [PubMed] [Google Scholar]
- Fairclough RJ, Bareja A. Davies KE. Progress in therapy for Duchenne muscular dystrophy. Exp. Physiol. 2011;96:1101–1113. doi: 10.1113/expphysiol.2010.053025. [DOI] [PubMed] [Google Scholar]
- Gillies AR. Lieber RL. Structure and function of the skeletal muscle extracellular matrix. Muscle Nerve. 2011;44:318–331. doi: 10.1002/mus.22094. [DOI] [PMC free article] [PubMed] [Google Scholar]
- Gomez CM, Maselli R, Gundeck JE, Chao M, Day JW, Tamamizu S, et al. Slow-channel transgenic mice: a model of postsynaptic organellar degeneration at the neuromuscular junction. J. Neurosci. 1997;17:4170–4179. doi: 10.1523/JNEUROSCI.17-11-04170.1997. [DOI] [PMC free article] [PubMed] [Google Scholar]
- Grady RM, Teng H, Nichol MC, Cunningham JC, Wilkinson RS. Sanes JR. Skeletal and cardiac myopathies in mice lacking utrophin and dystrophin: a model for Duchenne muscular dystrophy. Cell. 1997;90:729–738. doi: 10.1016/s0092-8674(00)80533-4. [DOI] [PubMed] [Google Scholar]
- Helliwell TR, Man NT, Morris GE. Davies KE. The dystrophin-related protein, utrophin, is expressed on the sarcolemma of regenerating human skeletal muscle fibres in dystrophies and inflammatory myopathies. Neuromuscul. Disord. 1992;2:177–184. doi: 10.1016/0960-8966(92)90004-p. [DOI] [PubMed] [Google Scholar]
- Huang P, Cheng G, Lu H, Aronica M, Ransohoff RM. Zhou L. Impaired respiratory function in mdx and mdx/utrophin+/− mice. Muscle Nerve. 2011;43:263–267. doi: 10.1002/mus.21848. [DOI] [PMC free article] [PubMed] [Google Scholar]
- Huebner KD, Jassal DS, Halevy O, Pines M. Anderson JE. Functional resolution of fibrosis in mdx mouse dystrophic heart and skeletal muscle by halofuginone. Am. J. Physiol. Heart Circ. Physiol. 2008;294:H1550–H1561. doi: 10.1152/ajpheart.01253.2007. [DOI] [PubMed] [Google Scholar]
- Janssen PM, Hiranandani N, Mays TA. Rafael-Fortney JA. Utrophin deficiency worsens cardiac contractile dysfunction present in dystrophin-deficient mdx mice. Am. J. Physiol. Heart Circ. Physiol. 2005;289:H2373–H2378. doi: 10.1152/ajpheart.00448.2005. [DOI] [PubMed] [Google Scholar]
- Kaspar BK, Llado J, Sherkat N, Rothstein JD. Gage FH. Retrograde viral delivery of IGF-1 prolongs survival in a mouse ALS model. Science. 2003;301:839–842. doi: 10.1126/science.1086137. [DOI] [PubMed] [Google Scholar]
- Khurana TS, Watkins SC, Chafey P, Chelly J, Tomé F, Fardeau M, et al. Immunolocalization and developmental expression of dystrophin related protein in skeletal muscle. Neuromuscul. Disord. 1991;1:185–194. doi: 10.1016/0960-8966(91)90023-l. [DOI] [PubMed] [Google Scholar]
- Klein SM, Vykoukal J, Lechler P, Zeitler K, Gehmert S, Schreml S, et al. Noninvasive in vivo assessment of muscle impairment in the mdx mouse model – A comparison of two common wire hanging methods with two different results. J. Neurosci. Methods. 2012;203:292–297. doi: 10.1016/j.jneumeth.2011.10.001. [DOI] [PubMed] [Google Scholar]
- Kunkel LM, Hejtmanciks JF, Caskey CT, Speer A, Monaco AP, Middlesworth W, et al. Analysis of deletions in DNA from patients with Becker and Duchenne muscular dystrophy. Nature. 1986;322:73–77. doi: 10.1038/322073a0. [DOI] [PubMed] [Google Scholar]
- Lefaucheur JP, Pastoret C. Sebille A. Phenotype of dystrophinopathy in old mdx mice. Anat. Rec. 1995;242:70–76. doi: 10.1002/ar.1092420109. [DOI] [PubMed] [Google Scholar]
- Lu A, Poddar M, Tang Y, Proto JD, Sohn J, Mu X, et al. Rapid depletion of muscle progenitor cells in dystrophic mdx/utrophin−/− mice. Hum. Mol. Genet. 2014;23:4786–4800. doi: 10.1093/hmg/ddu194. [DOI] [PMC free article] [PubMed] [Google Scholar]
- Lynch GS, Hinkle RT, Chamberlain JS, Brooks SV. Faulkner JA. Force and power output of fast and slow skeletal muscles from mdx mice 6-28 months old. J. Physiol. 2001;535:591–600. doi: 10.1111/j.1469-7793.2001.00591.x. [DOI] [PMC free article] [PubMed] [Google Scholar]
- Mariani JF, Pons F, Leger J, Loffreda N, Anoal M, Chevallay M, et al. Expression of myosin heavy chain isoforms in Duchenne muscular dystrophy. Neuromuscul. Disord. 1991;1:397–409. doi: 10.1016/0960-8966(91)90003-b. [DOI] [PubMed] [Google Scholar]
- Matsumura K. Campbell KP. Dystrophin-glycoprotein complex: its role in the molecular pathogenesis of muscular dystrophies. Muscle Nerve. 1994;17:2–15. doi: 10.1002/mus.880170103. [DOI] [PubMed] [Google Scholar]
- McNally EM. Pytel P. Muscle diseases: the muscular dystrophies. Annu. Rev. Pathol. 2007;2:87–109. doi: 10.1146/annurev.pathol.2.010506.091936. [DOI] [PubMed] [Google Scholar]
- Muller J, Vayssiere N, Royuela M, Leger ME, Mutter A, Bacou F, et al. Comparative evolution of muscular dystrophy in diaphragm, gastrocnemius and masseter muscles from old male mdx mice. J. Muscle Res. Cell Motil. 2001;22:133–139. doi: 10.1023/a:1010305801236. [DOI] [PubMed] [Google Scholar]
- Muntoni F, Mateddu A, Marchei F, Clerk A. Serra G. Muscular weakness in the mdx mouse. J. Neurol. Sci. 1993;120:71–77. doi: 10.1016/0022-510x(93)90027-v. [DOI] [PubMed] [Google Scholar]
- Musaro A, McCullagh K, Paul A, Houghton L, Dobrowolny G, Molinaro M, et al. Localized IGF-1 transgene expression sustains hypertrophy and regeneration in senescent skeletal muscle. Nat. Genet. 2001;27:195–200. doi: 10.1038/84839. [DOI] [PubMed] [Google Scholar]
- Pane M, Mazzone ES, Fanelli L, De Sanctis R, Bianco F, Sivo S, et al. Reliability of the performance of upper limb assessment in Duchenne muscular dystrophy. Neuromuscul. Disord. 2014;24:201–206. doi: 10.1016/j.nmd.2013.11.014. [DOI] [PubMed] [Google Scholar]
- Pastoret C. Sebille A. mdx mice show progressive weakness and muscle deterioration with age. J. Neurol. Sci. 1995;129:97–105. doi: 10.1016/0022-510x(94)00276-t. [DOI] [PubMed] [Google Scholar]
- Pessina P, Cabrera D, Morales MG, Riquelme CA, Guitierrez J, Serrano AL, et al. Novel and optimized strategies for inducing fibrosis in vivo: focus on Duchenne Muscular Dystrophy. Skelet Muscle. 2014;4:7. doi: 10.1186/2044-5040-4-7. . doi: 10.1186/2044-5040-4-7. [DOI] [PMC free article] [PubMed] [Google Scholar]
- Pichavant C, Aartsma-Rus A, Clemens PR, Davies KE, Dickson G, Takeda S, et al. Current status of pharmaceutical and genetic therapeutic approaches to treat DMD. Mol. Ther. 2011;19:830–840. doi: 10.1038/mt.2011.59. [DOI] [PMC free article] [PubMed] [Google Scholar]
- Quinlan JG, Johnson SR, McKee MK. Lyden SP. Twitch and tetanus in mdx mouse muscle. Muscle Nerve. 1992;15:837–842. doi: 10.1002/mus.880150713. [DOI] [PubMed] [Google Scholar]
- Rafael JA, Tinsley JM, Potter AC, Deconinck AE. Davies KE. Skeletal muscle-specific expression of a utrophin transgene rescues utrophin-dystrophin deficient mice. Nature. 1998;19:79–82. doi: 10.1038/ng0598-79. [DOI] [PubMed] [Google Scholar]
- Reiser PJ, Moss RL, Giulian GG. Greaser ML. Shortening velocity in single fibers from adult rabbit soleus muscles is correlated with myosin heavy chain composition. J. Biol. Chem. 1985;260:9077–9080. [PubMed] [Google Scholar]
- Renault V, Prion-Hamelin G, Forestier C, DiDonna S, Decary S, Hentati F, et al. Skeletal muscle regeneration and the mitotic clock. Exp. Gerontol. 2000;35:711–719. doi: 10.1016/s0531-5565(00)00151-0. [DOI] [PubMed] [Google Scholar]
- Ricard-Blum S. Ruggierio F. The collagen superfamily: from extracellular matrix to the cell membrane. Pathol. Biol. 2005;53:430–442. doi: 10.1016/j.patbio.2004.12.024. [DOI] [PubMed] [Google Scholar]
- Schleip R, Naylor IL, Ursu D, Melzer W, Zorn A, Wilke HJ, et al. Passive muscle stiffness may be influenced by active contractility of intramuscular connective tissue. Med. Hypotheses. 2006;66:66–71. doi: 10.1016/j.mehy.2005.08.025. [DOI] [PubMed] [Google Scholar]
- Seale P, Sabourin LA, Girgis-Gabardo A, Mansouri A, Gruss P. Rudnicki MA. Pax7 is required for the specification of myogenic satellite cells. Cell. 2000;102:777–786. doi: 10.1016/s0092-8674(00)00066-0. [DOI] [PubMed] [Google Scholar]
- Sicinski P, Geng Y, Ryder-Cook AS, Barnard EA, Darlison M. Barnard PJ. The molecular basis of muscular dystrophy in the mdx mouse: a point mutation. Science. 1989;244:1578–1580. doi: 10.1126/science.2662404. [DOI] [PubMed] [Google Scholar]
- Snow LM, McLoon LK. Thompson LV. Adult and developmental myosin heavy chain isoforms in soleus muscle of aging Fischer Brown Norway rat. Anat. Rec. A Discov. Mol. Cell Evol. Biol. 2005;286:866–873. doi: 10.1002/ar.a.20218. [DOI] [PubMed] [Google Scholar]
- Spassov A, Gredes T, Gedrange T, Lucke S, Morgenstern S, Pavlovic D, et al. Differential expression of myosin heavy chain isoforms in the masticatory muscles of dystrophin-deficient mice. Eur. J. Orthod. 2013;33:613–619. doi: 10.1093/ejo/cjq113. [DOI] [PubMed] [Google Scholar]
- Spurney CF, Gordish-Dressman H, Guerron AD, Sali A, Pandey GS, Rawat R, et al. Preclinical drug trials in the mdx mouse: assessment of reliable and sensitive outcome measures. Muscle Nerve. 2009;39:591–602. doi: 10.1002/mus.21211. [DOI] [PMC free article] [PubMed] [Google Scholar]
- Stedman HH, Sweeney HL, Shrager JB, Maguire HC, Panettieri RA, Petrof B, et al. The mdx mouse diaphragm reproduces the degenerative changes of Duchenne muscular dystrophy. Nature. 1991;352:536–539. doi: 10.1038/352536a0. [DOI] [PubMed] [Google Scholar]
- Steinberger M, Föller M, Vogelgesang S, Krautwald M, Landsberger M, Winkler CK, et al. Lack of the serum-and glucocorticoid-inducible kinase SGK1 improves muscle force characteristics and attenuates fibrosis in dystrophic mdx mouse muscle. Pflugers Arch. 2014 doi: 10.1007/s00424-014-1645-5. doi: 10.1007/s00424-014-1645-5 [Epub ahead of print] [DOI] [PubMed] [Google Scholar]
- Sweeney HL, Kushmerick MJ, Mabuchi K, Gergely J. Sreter FA. Velocity of shortening and myosin isozymes in two types of rabbit fast-twitch muscle fibers. Am. J. Physiol. 1986;251:C431–C434. doi: 10.1152/ajpcell.1986.251.3.C431. [DOI] [PubMed] [Google Scholar]
- Swiderski K, Todorov M, Gehring SM, Naim T, Chee A, Stapleton DI, et al. Transilast administration reduces fibrosis and improves fatigue resistance in muscles of mdx dystrophic mice. Fibrogenesis Tissue Repair. 2014;7:1. doi: 10.1186/1755-1536-7-1. . doi: 10.1186/1755-1536-7-1. [DOI] [PMC free article] [PubMed] [Google Scholar]
- Tan N. Lansman JB. Utrophin regulates modal gating of mechanosensitive ion channels in dystrophic skeletal muscle. J. Physiol. 2014;15:3303–3323. doi: 10.1113/jphysiol.2014.274332. [DOI] [PMC free article] [PubMed] [Google Scholar]
- Tanganyika-deWinter CL, Heemskerk H, Karnaoukh TG, van Putten M, de Kimpe SJ, van Deutekom J, et al. Long-term exon skipping studies with 2′-P-methyl phosphorothioate antisense oligonucleotides in dystrophic mouse models. Mol. Ther. Nucleic. Acids. 2012;1:e66. doi: 10.1038/mtna.2012.38. [DOI] [PMC free article] [PubMed] [Google Scholar]
- Tinsley JM, Potter AC, Phelps SR, Fisher R, Trickett JI. Davies KE. Amelioration of the dystrophic phenotype of mdx mice using a truncated utrophin transgene. Nature. 1996;384:349–353. doi: 10.1038/384349a0. [DOI] [PubMed] [Google Scholar]
- Tinsley J, Deconinck N, Fisher R, Kahn D, Phelps S, Gillis JM, et al. Expression of full-length utrophin prevents muscular dystrophy in mdx mice. Nat. Med. 1998;4:1441–1444. doi: 10.1038/4033. [DOI] [PubMed] [Google Scholar]
- Turgeman T, Hagai Y, Huebner K, Jassal DS, Anderson JE, Genin O, et al. Prevention of muscle fibrosis and improvement in muscle performance in the mdx mouse by halofuginone. Neuromuscul. Disord. 2008;18:857–868. doi: 10.1016/j.nmd.2008.06.386. [DOI] [PubMed] [Google Scholar]
- van Putten M, de Winter C, van Roon-Mom W, van Ommen GJ, ‘t Hoen PAC. Aartsma-Rus A. A 3-months mild functional test regime does not affect disease parameters in young mdx mice. Neuromuscul. Disord. 2010;20:273–280. doi: 10.1016/j.nmd.2010.02.004. [DOI] [PubMed] [Google Scholar]
- van Putten M, Kumar D, Hulsker M, Hoogaars WMH, Plomp JJ, van Opstal A, et al. Comparison of skeletal muscle pathology and motor function of dystrophin and utrophin deficient mouse strains. Neuromuscul. Disord. 2012;22:406–417. doi: 10.1016/j.nmd.2011.10.011. [DOI] [PubMed] [Google Scholar]
- Wakefield PM, Tinsley JM, Wood MJ, Gilbert R, Karpati G. Davies KE. Prevention of the dystrophic phenotype in dystrophin/utrophin-deficient muscle following adenovirus-mediated transfer of an utrophin minigene. Gene Ther. 2000;7:201–204. doi: 10.1038/sj.gt.3301066. [DOI] [PubMed] [Google Scholar]
- Webster C, Silberstein L, Hays AP. Blau HM. Fast muscle fibers are preferentially affected in Duchenne muscular dystrophy. Cell. 1988;52:503–513. doi: 10.1016/0092-8674(88)90463-1. [DOI] [PubMed] [Google Scholar]
- Wilton SD, Dye DE, Blechynden LM. Laing NG. Revertant fibres: a possible genetic therapy for Duchenne muscular dystrophy? Neuromuscul. Disord. 1997;7:329–335. doi: 10.1016/s0960-8966(97)00058-8. [DOI] [PubMed] [Google Scholar]
- Yokota T, Lu QL, Morgan JE, Davies KE, Fisher R, Takeda S, et al. Expansion of revertant fibers in dystrophic mdx muscles reflects activity of muscle precursor cells and serves as an index of muscle regeneration. J. Cell Sci. 2006;119:2679–2687. doi: 10.1242/jcs.03000. [DOI] [PubMed] [Google Scholar]
- Zhou L, Rafael-Fortney JA, Huang P, Zhao XS, Cheng G, Zhou X, et al. Haploinsufficiency of utrophin gene worsens skeletal muscle inflammation and fibrosis in mdx mice. J. Neurol. Sci. 2008;264:106–111. doi: 10.1016/j.jns.2007.08.029. [DOI] [PMC free article] [PubMed] [Google Scholar]