Abstract
Activation of endothelial nitric oxide synthase (eNOS) by calmodulin (CaM) facilitates formation of a sequence of conformational states that is not well understood. Fluorescence decays of fluorescently labeled CaM bound to eNOS reveal four distinct conformational states and single-molecule fluorescence trajectories show multiple fluorescence states with transitions between states occurring on time scales of milliseconds to seconds. A model is proposed relating fluorescence quenching states to enzyme conformations. Specifically, we propose that the most highly quenched state corresponds to CaM docked to an oxygenase domain of the enzyme. In single-molecule trajectories, this state occurs with time lags consistent with the oxygenase activity of the enzyme.
The nitric oxide synthases are functional homodimers that, upon activation by CaM, catalyze the release of NO gas [1]. An N-terminal oxygenase domain comprises the enzyme reaction center with its associated heme and tetrahydrobiopterin cofactors. The C-terminal reductase domain contains NADPH/FAD and FMN binding modules. The oxygenase and reductase domains are separated by a CaM-binding sequence immediately adjacent to the FMN module. Transfer of electrons from NADPH through FAD and FMN to the oxygenase heme requires a series of conformations that sequentially position each electron donor and acceptor pair in close proximity. (See references [2,3] for reviews.)
An understanding of the mechanism of NO generation by CaM-NOS therefore requires knowledge of both CaM-eNOS conformations and their interchange dynamics. The position of the CaM binding domain adjacent to the FMN module suggests the possibility to detect changes in its position by monitoring changes in fluorescence of a bound, labeled CaM. Indeed, previous work showed quenching of fluorescence-labeled CaM bound to eNOS, due principally to Förster resonance energy transfer (FRET) from the excited dyes to the reaction-center hemes [4].
We have carried out fluorescence lifetime and single-molecule fluorescence measurements of eNOS complexed with fluorescently labeled CaM. The results demonstrate distinct fluorescence quenching states, which we hypothesize correspond to conformational states of the enzyme. Single-molecule trajectories reveal transitions on time scales from tens of milliseconds to several seconds, consistent with the solution kinetic data for the enzyme. A highly quenched state with long average time duration in single-molecule trajectories strongly supports the presence of a conformation with CaM docked to the oxygenase domain of eNOS, as suggested by recent EM and hydrogen-deuterium exchange investigations [5–7]. Single-molecule trajectories allow us to relate conformational states (in particular the docked, highly quenched state) with conformational interchange kinetics. The results suggest that the formation and dissociation rates of the docked state are rate limiting for the activity of the enzyme.
MATERIALS AND METHODS
A previously characterized 6-His tagged S1179D mutant of bovine eNOS was purified as described previously [8,9]. It was used because it was the subject of a cryo-electron microscopy (cryo-EM) reconstruction of CaM-eNOS complexes [5], and because the phosphomimetic substitution for S1179 enhances the probability of detecting active conformations of the enzyme [8]. T34C-CaM was generated and purified as previously reported [10,11] and labeled at Cys-34 with maleimide derivatives of Alexa Fluor 488 (AF488) or Alexa Fluor 594 (AF594) (Molecular Probes) as described previously [10] to generate labeled CaM (denoted CaM-AF488 and CaM-AF594).
Fluorescence lifetime experiments were performed by time-correlated-single-photon-counting (TCSPC) as described previously [12]. The output of a cavity-dumped Ti:Sapphire laser (Coherent Mira) emitting 150 fs pulses at 800 nm with a 2.28 MHz repetition rate was focused into a photonic crystal fiber (Thorlab NL-PM-750) to generate white light, which was directed through 10 nm band-pass filters for excitation of the AF488 or AF594 labels. Fluorescence emission was monitored at 517 nm for AF488 and 617 nm for AF594 with a bandwidth of 7.6 nm and polarization at the magic angle. Excitation levels were low enough that emission counts were detected for less than 1% of excitation pulses.
Fluorescence decays were recorded after adding varying amounts of high-Ca2+ buffer (50 mM TRIS at pH=7.4, 100 mM KCl, 2 mM EGTA, 10 mM CaCl2, and 0.1 mg/mL BSA) to a solution of 200 nM CaM and 800 nM eNOS in nominally Ca2+-free buffer (50 mM TRIS at pH=7.4, 100 mM KCl, 2mM EGTA, and 0.1 mg/mL BSA). The concentrations of free Ca2+ in the reaction mixtures were determined by comparison with identically prepared Ca2+ buffer solutions containing the Ca2+-sensitive dye quin-2 (Molecular Probes). The Ca2+ dependence of quin-2 fluorescence was calibrated against a Ca2+ calibration buffers (Molecular Probes).
Fluorescence decays were analyzed with in-house software by iterative nonlinear least-squares fitting to exponentials convoluted with the instrument function and by maximum-entropy analysis. The maximum entropy algorithm (Pulse5, Maximum Entropy Data Consultants, Ltd.) fits fluorescence decays by assigning amplitudes to 200 logarithmically spaced decay components while minimizing amplitude variations [13]. This method minimizes the number of features in the amplitude distribution and is thus appropriate for cases where the number of decay components is not known in advance.
Complexes between fluorescence labeled CaM and eNOS were prepared by incubating 800 nM S1179D-eNOS with 200 nM fluorescently labeled CaM in a buffer containing 50 mM TRIS at pH=7.4, 100 mM KCl, 1 mM CaCl2, and 0.1 mg/mL BSA. After incubation for 30 minutes this mixture was diluted to produce a final CaM concentration of <1 nM. CaM-eNOS complexes were immobilized on Cu2+ coated coverslips (MicroSurfaces, Inc.) via 6-His tags on eNOS. Trajectories were collected by positioning complexes over the focal region of an inverted fluorescence microscope (Nikon TE300). Fluorescence was excited with an Ar ion laser at 488 nm (JDS Uniphase) or a He-Ne laser at 594 nm (Melles Griot 25-LYP). Excitation powers were 500 nW or less. Trajectories were obtained with 20-ms time steps.
Trajectories were selected for analysis and truncated immediately preceding photo-bleaching events. Trajectories that appeared to originate from aggregates, displayed no transitions, or appeared to derive from mobile molecules were rejected for analysis. Time correlation functions, C(t), were calculated for each individual trajectory, I(t), according to the relation:
| (1) |
where ΔI = I − 〈I〉 and <•••> denotes the time average. The t=0 values of the correlation functions C(0) were excluded from fitting because they include a contribution arising from uncorrelated noise. The correlation functions were then rescaled so that the fitting functions decayed from a starting value of C(0) = 1.
RESULTS
Fluorescence lifetimes for labeled CaM-eNOS complexes
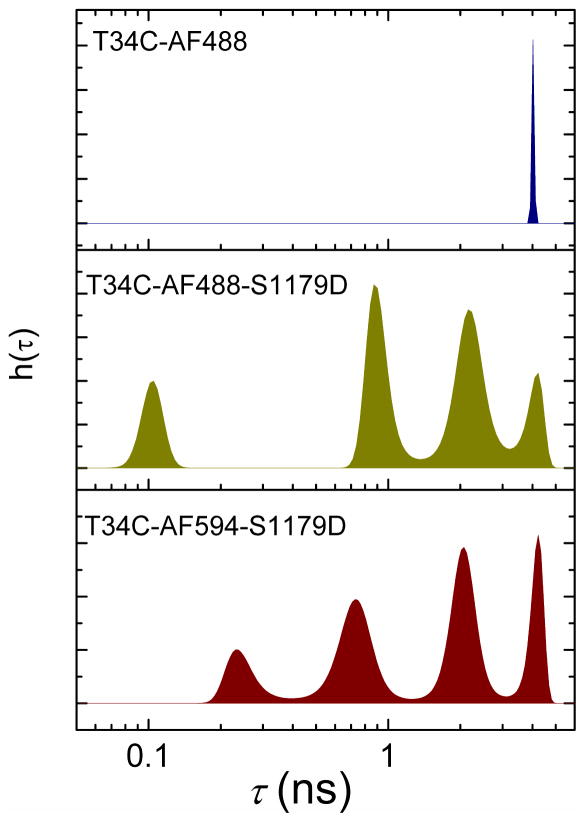
The maximum-entropy lifetime distributions derived for free CaM-AF488 and for labeled CaM-eNOS complexes in high-Ca2+ buffer are shown in Figure 1. CaM-AF488 by itself exhibits a single fluorescence lifetime of 4.0 to 4.1 ns. Regardless of fluorescence label, four lifetime peaks were derived from the data for CaM-eNOS complexes by maximum-entropy fitting, suggesting the presence of four different populations of CaM in the presence of eNOS. The slight differences between the lifetime distributions for CaM-AF488 and CaM-AF594 can be attributed to different Förster radii for energy transfer to heme or flavin (see Supporting Information), as well as inherent uncertainties in recovered distributions.
Figure 1.
Distributions of fluorescence lifetimes recovered by maximum entropy analysis. The plots show the normalized amplitudes h(τ) obtained from maximum-entropy fits as a function of fluorescence lifetime τ. Top: CaM-AF488. Center: CaM-AF488 bound to S1179D-eNOS. Bottom: CaM-AF594 bound to S1179D-eNOS. Distributions were generated by maximum-entropy fits to fluorescence decays recorded by TCSPC. Samples were in high Ca2+ buffer with [Ca2+] = 2 mM, [CaM] • 200 nM, and [eNOS] • • 800 nM. Maximum entropy analysis gave the following lifetimes (and amplitudes): for CaM-AF488: 4.1 ns (100%); for CaM-AF488 with S1179D-eNOS: 104 ps (15%), 917 ps (33%), 2.22 ns (39%), 4.05 ns (13%); for CaM-AF594: 154 ps (8%), 698 ps (21%), 2.37 ns (44%), 4.00 ns (27%). Lifetime values are the average over each peak in the maximum entropy distribution. Uncertainties in lifetime and amplitude are 3 to 10 %. AF488 was excited at 488 nm and AF594 at 594 nm. Emission was collected at 517 nm for AF488 and 617 nm for AF594.
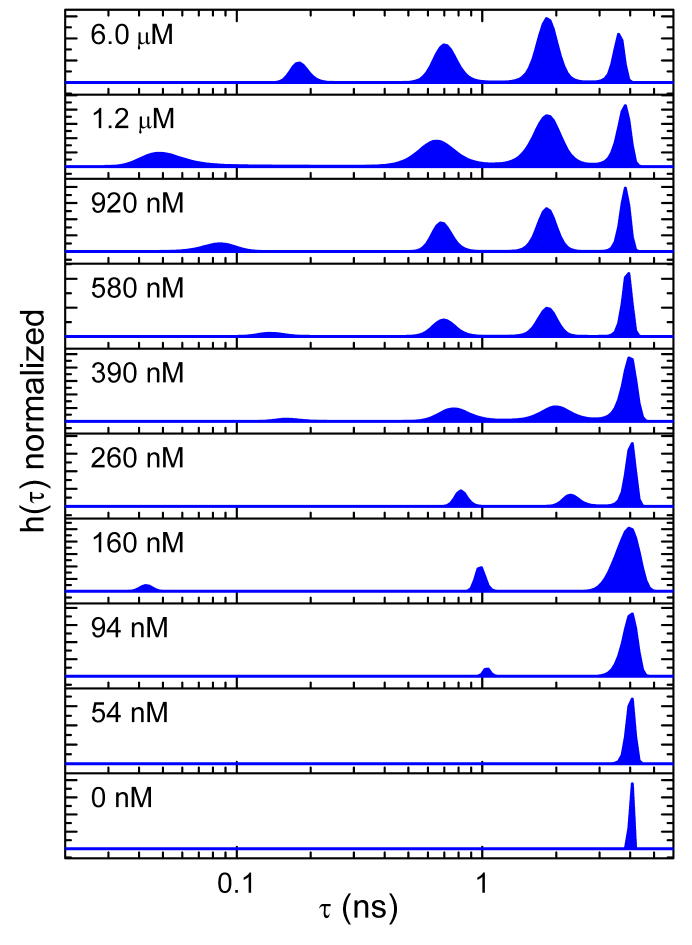
The maximum-entropy lifetime distributions for CaM-AF488 in the presence of S1179D-eNOS are presented in Figure 2 for free Ca2+ concentrations ranging from nominally zero to a value of 6 μM, which is known to be sufficient to saturate a CaM-eNOS complex [8,9]. Chelation of Ca2+ by addition of 2 mM EGTA resulted in a single lifetime of 4 ns, consistent with the value obtained for CaM-AF488 in the absence of the synthase. Increases in the free Ca2+ concentration caused the appearance of additional lifetime components with amplitudes that increased with increasing Ca2+ concentration.
Figure 2.
Dependence of fluorescence quenching on Ca2+ concentration for CaM-AF488 (200 nM) in the presence of S1179D-eNOS (800 nM) at Ca2+ concentrations from near zero to 6 μM. The Ca2+ concentration noted in each panel was generated by adding various amounts of a high-Ca2+ buffer containing 10 mM Ca2+ to a low-Ca2+ buffer containing 2 mM EGTA. Ca2+ concentrations were calibrated as described in Methods.
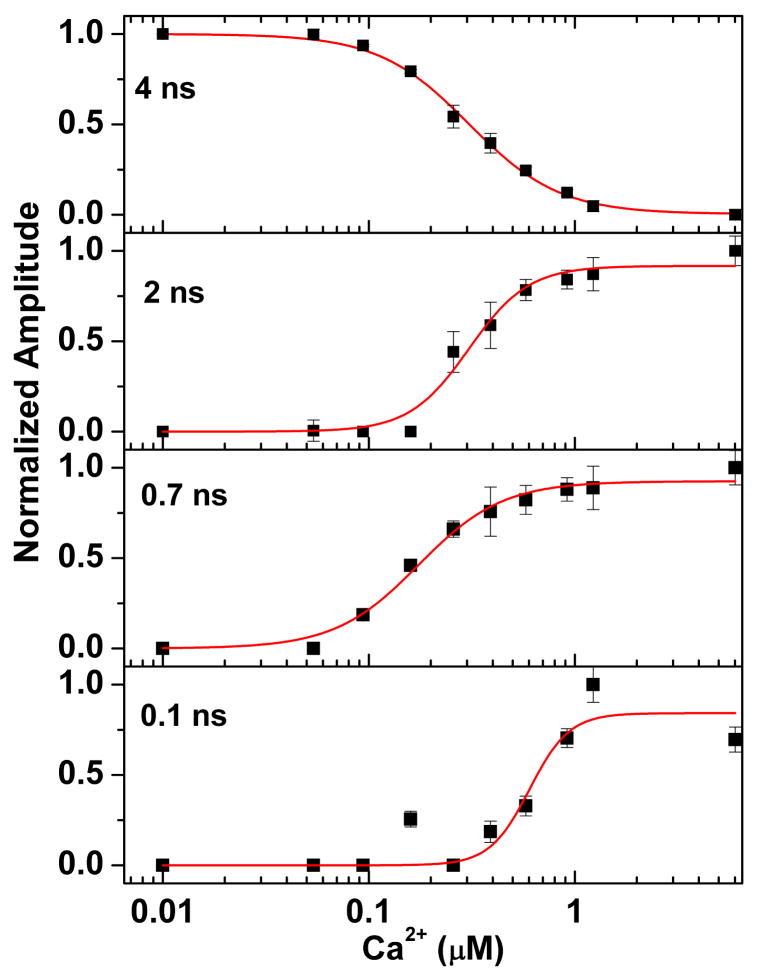
The normalized changes in amplitude of each lifetime component are plotted versus the free Ca2+ concentration in Figure 3. The fractional changes in amplitude F were fit to a Hill equation for Ca2+ binding [9]:
| (2) |
Figure 3.
The Ca2+ dependence of fluorescence quenching for CaM-AF488 binding to S1179D-eNOS complexes. The fractional amplitude for each peak in the lifetime distribution was obtained from the sum of the amplitudes for each peak. Lines show fits to a Hill equation. Amplitudes and errors were obtained from maximum entropy fits.
The values obtained for the dissociation constant K and the Hill coefficient n (Table 1) are similar to those derived by Tran et al. from data for CaM binding and enzyme activation at different free Ca2+ concentrations [8]. Similar values were obtained from fits to the amplitudes from nonlinear least-squares fits of the fluorescence decays to a sum of four exponential decays.
Table 1.
Parameters from fits of the amplitudes of lifetime components to a Hill modela
| Component | Binding parameters | |
|---|---|---|
| K (μM) | n | |
| ~4 ns | 0.31 ± 0.01 | 2.0 ± 0.1 |
| ~2 ns | 0.31 ± 0.03 | 3.0 ± 0.7 |
| ~.7 ns | 0.18 ± 0.01 | 2.1 ± 0.3 |
| ~.1 ns | 0.60 ± 0.10 | 4.5 ± 2.6 |
Single-molecule trajectories
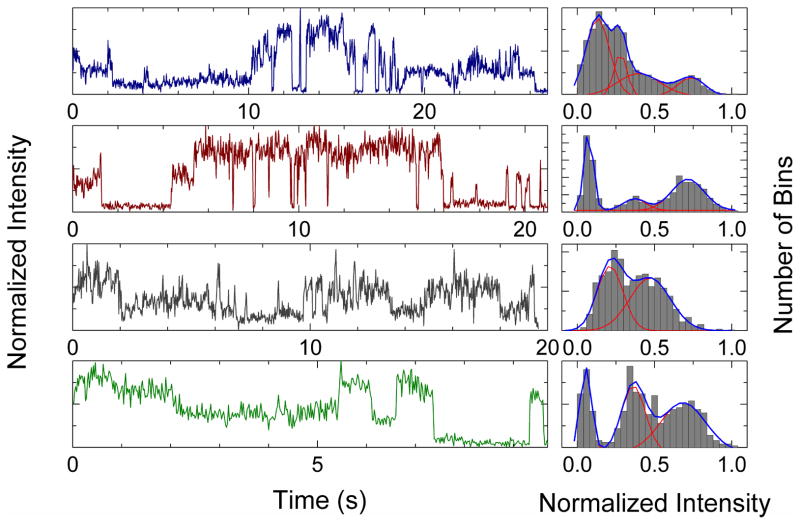
Figure 4 shows representative single-molecule fluorescence trajectories obtained for CaM-S1179D-eNOS complexes. Each trajectory shown represents a different set of 200 or more trajectories collected under the conditions indicated. The single-molecule trajectories reveal distinct levels of fluorescence that interconvert on multiple time-scales. The corresponding histograms of fluorescence counts in each trajectory, also shown in Figure 4, suggest two, three, or, occasionally, four distinct levels of fluorescence.
Figure 4.
Single-molecule fluorescence trajectories and histograms. Left panels: Examples of single-molecule trajectories and intensity histograms for S1179D-eNOS immobilized on a Cu2+ surface; top two panels, with CaM-AF594; bottom two panels, with CaM-AF488. Fluorescence intensities are normalized to the maximum signal level in each trajectory. Histograms of fluorescence counts per bin are shown in the right panels. The blue lines show a fit to a sum of two to four Gaussian distributions with the individual Gaussian functions shown in red.
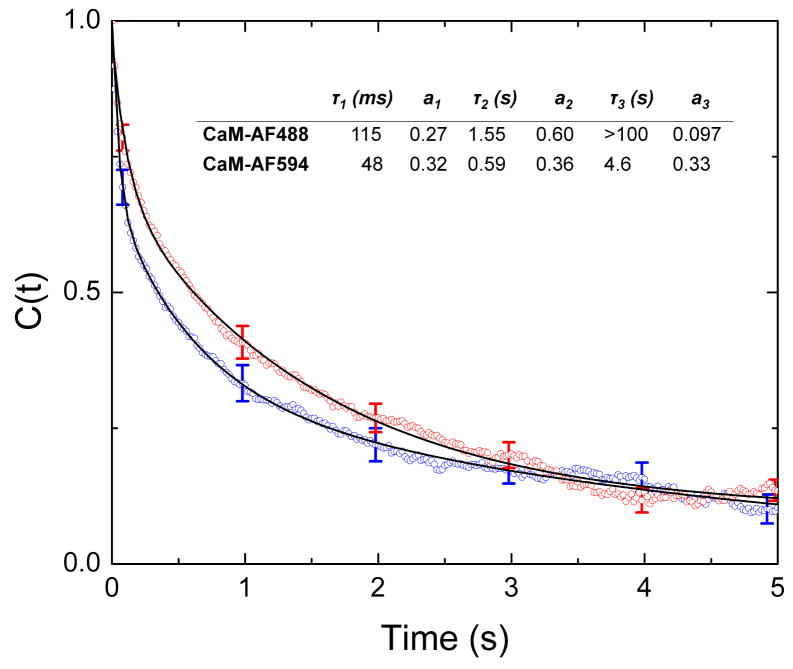
Analysis of single-molecule trajectories must take into account, first, the non-ratiometric nature of the measurements, which may make relating particular states observed in a given trajectory with the fluorescence levels in other trajectories ambigious. Second, trajectory lengths are intrinsically limited by photobleaching of the dye, and some trajectories may not be long enough to sample all states adequately. Third, two CaM molecules could bind to the same dimer; given a CaM:eNOS ratio of 1:4 the probability of two CaM molecules binding to the same eNOS dimer is expected to be ~6%. We computed the time correlation functions of the trajectories, an approach that does not require identification of corresponding fluorescence states in multiple trajectories. The resulting correlation functions are shown in Figure 5. In each case C(t) can be well characterized with a three-exponential fit. The longest time constant is not well determined because the average length of the single-molecule trajectories was too short to obtain an accurate value. The minor differences between the correlation functions obtained for CaM-AF488 and CaM-AF594 can be attributed to their different Förster radii, which slightly alter their response to distance changes and hence the intensity autocorrelations.
Figure 5.
Time correlation functions, C(t), for CaM-AF594 and CaM-AF488 complexes with S1179D-eNOS. Correlation functions are averages of over 200 or more correlation functions from single-molecule trajectories. The solid lines represent three-exponential fits to C(t). The obtained time constants and amplitudes are given in the table inset.
DISCUSSION
Our results reveal multiple conformational states of CaM-eNOS based in both time-resolved and single-molecule fluorescence experiments and show how their formation depends on the free Ca2+ concentration. Single-molecule measurements characterize the interchange dynamics of conformational states and, in particular, the formation and dissociation of a state with CaM docked to one of the oxygenase domains of eNOS.
We propose the model shown in Figure 6 based on the present data and previously published structural and kinetic data [5–7,9,14]. When eNOS is activated by CaM, the FMN binding module in one protomer shuttles electrons from the NADPH/FAD module in that protomer to the heme reaction center in the opposite one [2]. This process requires a minimum of three conformations illustrated in Figure 6, defined by the disposition of the FMN module: an “input” conformation in which it is bound to the NADPH/FAD module, an “output” conformation in which it docks near a heme reaction center and relinquishes its reducing equivalents, and a set of intermediate conformations (“inter” in Figure 6) in which the FMN module is undocked. CaM appears to activate synthase activity by controlling the equilibria among these conformations [2,15].
Figure 6.
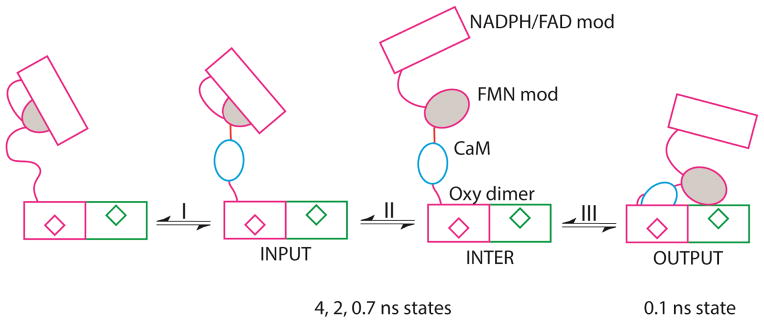
Model for the activation of eNOS by CaM. The module depicts the FAD module (rectangle) and FMN module (grey oval) of one protomer, and oxygenase domains of both protoomers, with hemes represented by diamonds. Process I represents binding of CaM (blue oval) to eNOS and is not observed in our studies. Process II represents exchange among input and intermediate conformations that we observed as states with lifetimes of approximately 0.7 ns, 2 ns, and 4 ns. The intermediate conformation may represent multiple conformations with the FMN module undocked. Process III is docking of CaM to the heme domain to generate the output state, which we assigned as the conformation with fluorescence lifetime of approximately 0.1 ns.
The low fluorescence yield of the highly quenched state suggests that it has CaM in close proximity to one or both of the oxygenase hemes, and we propose that it corresponds to CaM docked to the oxygenase domain. Such a conformation could in turn promote docking of the FMN module to the oxygenase domain of the neighboring member of the eNOS dimer, as required for formation of the output state as depicted in Figure 6. We further propose that the input and intermediate conformations correspond to states with fluorescence lifetimes of ~4 ns, ~2 ns, and ~0.7 ns.
Fluorescence from excited dyes in CaM-eNOS complexes could be quenched by resonance energy transfer to either eNOS heme or to flavin components [4,16], but energy transfer to one or both oxygenase hemes is considerably more efficient for the AF488 and AF594 dyes used in this study because heme has strong absorption over the wavelength range of AF488 and AF594 emission, while flavin absorbs little over this region. The contribution of quenching from each heme depends on the distance. However, other quenching mechanisms could also affect the fluorescence yield of eNOS states. (Calculation of Förster radii and the possibility of orientational effects in the FRET measurements are discussed further in the Supplementary Information.)
The highly quenched state has a Ca2+-dependence that is shifted to higher Ca2+ concentrations compared to the other fluorescence-lifetime states (Figure 3). Its Ca2+ dependence yields a Hill coefficient of 4.5 ± 2.6 (Table 1). Although the uncertainty in the coefficient is large due to scatter in the data points, its value suggests that its formation requires Ca2+ binding to all four binding sites in CaM. A four-site Ca2+ dependence was also found for activation of eNOS (including the S1179D mutant) [8,9], consistent with the hypothesis that formation of the docked, output state requires binding of both Ca2+-replete CaM lobes to eNOS.
The two intermediately-quenched states appear at lower free Ca2+ concentrations than those required to form the highly quenched state. The Ca2+ dependence for these states fit to Hill coefficients of less than four, suggesting that they may form upon binding of one lobe of CaM (presumably the C-terminal lobe [17]) to the enzyme. Both states persist at higher Ca2+ levels, where all four Ca2+-binding sites of CaM are occupied. The long-lifetime state at low Ca2+ concentration comes from CaM-AF488 (or CaM-AF594) free in solution. A long-lifetime state persists at high Ca2+ concentrations, where it represents CaM bound in a conformation where quenching is minimal. This state cannot be free CaM because the eNOS concentration is four times greater than the CaM concentration, so that virtually all CaM should be bound to eNOS, and the dissociation constant KD for CaM-eNOS at high Ca2+ is < 1 nM [18], two orders of magnitude below the free concentration of eNOS.
Like the fluorescence decay data, single-molecule trajectories show the presence of multiple fluorescence states. While the fluorescence decay analysis reveals four states, most trajectories suggest three states: a bright state, a highly quenched state, and an intermediate state. It may be that most individual trajectories are not long enough to visit all four states observed in fluorescence decay profiles or that two of the states are not well resolved in individual trajectories. A highly-quenched state (normalized intensity ~0.1) appears in each trajectory for time periods of up to several seconds. Visual inspection of the trajectories reveals that the highly quenched state has the longest average duration in single-molecule trajectories. Since the fractional populations of the highly quenched state in single-molecule trajectories are comparable to the relative amplitude of the most highly quenched state in fluorescence decays, we tentatively identify the long-lived, low-intensity state in single-molecule trajectories with the highly-quenched state in fluorescence decay measurements.
Our hypothesis identifying the highly-quenched state with CaM docking to the oxygenase domain is supported by several recent structural investigations [5–7,14,19]. A docked configuration of CaM was first proposed based on a cryo-EM reconstruction of dimers of the S1179D mutant of eNOS imaged in the presence of CaM, which show two regions that overlap basic patches on the oxygenase domains, leading the authors to suggest that they represent docking sites for FMN and CaM [5]. Close interaction between both the FMN subdomain and CaM with the heme domain was also detected in a mass spectrometric study of H/D exchange in inducible NOS (iNOS) [6]. A “closed” conformation representing ~15% of CaM complexes with neuronal NOS (nNOS) was also observed by analysis of negative-staining EM images of the synthase in the presence and absence of CaM [14]. A docked state with CaM close to the oxygenase domain with a population of 15% to 30% was also suggested for nNOS based on pulsed EPR measurements of the interaction between a spin label on CaM and the heme iron [19]. A recent EM analysis by negative staining of all three major NOS isoforms [7] also identified an output state, accounting for ~20% of the observed particles, where CaM and FMN module are docked on the surface of the oxygenase dimer [6]. The population of particles detected in the “docked” or “closed” state in each of the above studies is consistent with the populations we found in the highly quenched state: 8 to 15% from analysis of fluorescence decays and 11 to 20% in single-molecule trajectories, although the conformational populations we observed may be affected by the S1179D mutant used, and perhaps by the T34C mutation and fluorescence labeling of CaM.
A recent EM study identified, in addition to the output state mentioned above, a group of structures in which the FMN module is bound to the NADPH/FAD module, and a second group in which CaM is docked on the oxygenase domain but the FMN module is not [7]. Structural reconstructions from a recent study of CaM-eNOS by cryo-EM also showed, in addition to CaM docked to the oxygenase domain, significant diffuse density suggestive of a mobile population of reductase domains [5]. Multiple conformational states were also detected by pulsed electron-electron double resonance (PELDOR) spectroscopy, which revealed distributions of distances between FAD and FMN in nNOS that were modulated by the presence of the CaM and the oxygenase domain [20]. A relaxation-induced dipolar modulation enhancement measurement on nNOS also detected both docked and open conformations of the FMN domain relative to the heme [19]. These results suggest that, unless docked, bound CaM is likely to assume multiple conformational states relative to the hemes. Sampling of these conformational states may account for some or all of the ~0.7, ~2, and ~4-ns lifetimes seen in the fluorescence decay data and the more short-lived states in single-molecule trajectories.
A structural model of the docked output state for iNOS that was fit to the EM reconstruction [7] predicts nearly identical distances of 47 Å to 49 Å between the α-carbon of Thr-34 of CaM (the labeling site) and the heme irons in the two oxygenase domains. Given uncertainty in the distance of the fluorophore from the labeling site, this result is reasonably consistent with our measured lifetimes, which would predict a distance of 28 to 35 Å to two equally distant hemes. The 2-ns and 0.7 ns quenching states correspond to fluorophore to heme distances of 38 to 50 Å, consistent with distances in the input and intermediate states in the EM model. The 4-ns state may correspond to an extended conformation observed by other studies: a population with a long flavin fluorescence lifetime was detected in both nNOS and iNOS [21,22], and an extended population was postulated in modeling relaxation-induced dipolar modulation enhancement (RIDME) in nNOS [19].
The correlation functions obtained from single-molecule trajectories indicate that CaM-eNOS complexes interchange between different quenching states on timescales from tens of milliseconds to seconds. Although the time constants for the correlation function decay do not correspond directly to specific kinetic rate constants, they show that the time scales of the transitions observed in single-molecule trajectories are consistent with previous kinetic measurements. The time scale for transitions to and from the highly-quenched state, is consistent with a time constant of ~3 s for S1179D-eNOS synthase activity [8]. This suggests that formation or dissociation of the CaM-docked state is rate limiting. Cytochrome c reductase activity, which is a measure of the rate at which reducing equivalents can be produced by the reductase domain, has a time constant of 0.15 s [8], consistent with the time scales for the faster transitions, one of which may be rate limiting for reductase activity.
CONCLUSIONS
Fluorescence quenching of a dye attached to CaM resolves four distinct states of CaM-eNOS complexes identified by their fluorescence lifetime. At least three states are present in single-molecule trajectories with transitions between states on the time scales of seconds to milliseconds. We propose that the most highly quenched state corresponds to a conformation with CaM docked to one oxygenase domain, positioning the FMN module close to the other oxygenase domain. This conformation appears to have the longest average time duration in single-molecule trajectories, consistent with a strong interaction. The formation and/or dissociation of this conformation would likely be rate limiting and would therefore determine synthase activity. We further propose that one or more of the conformations exhibiting less quenching correspond to diffuse conformations observed in cryo-EM, suggesting that these are states with the FMN module and CaM domains undocked from the oxygenase domains. High homology with other NOS isozymes, nNOS and iNOS, implies that similar mechanisms are operative for them as well.
Supplementary Material
HIGHLIGHTS.
Fluorescence decays of labeled CaM bound to eNOS show four quenching states.
A highly quenched state can be assigned to CaM docked to the oxygenase domain of eNOS.
Single-molecule fluorescence trajectories show transitions between states.
The kinetics of the presumptive docked state suggest that its formation or dissociation is rate limiting.
Acknowledgments
D.C.A. acknowledges faculty development support from Northwestern College during a sabbatical leave. We thank Michael Marletta and Brian Smith for kindly providing the coordinates for their model of iNOS. This work was supported in part by NSF grant CHE-1124946 to C.K.J. and NIH grant GM074887 to A.P.
ABBREVIATIONS
- AF488
Alexa fluor 488
- AF594
Alexa fluor 594
- BSA
bovine serum albumin
- CaM
calmodulin
- eNOS
endothelial nitric oxide synthase
- EGTA
ethylene glycol tetraacetic acid
- EM
electron microscopy
- FAD
flavin adenine dinucleotide
- FMN
flavin mononucleotide
- FRET
Förster resonance energy transfer
- iNOS
inducible nitric oxide synthase
- NADPH
nicotinamide adenine dinucleotide phosphate
- nNOS
neuronal nitric oxide synthase
- TCSPC
time-correlated single photon counting
- TRIS
tris(hydroxymethyl)aminomethane
Footnotes
Discussion of limitations of FRET measurements in this system.
Publisher's Disclaimer: This is a PDF file of an unedited manuscript that has been accepted for publication. As a service to our customers we are providing this early version of the manuscript. The manuscript will undergo copyediting, typesetting, and review of the resulting proof before it is published in its final citable form. Please note that during the production process errors may be discovered which could affect the content, and all legal disclaimers that apply to the journal pertain.
References
- 1.Masters BS, McMillan K, Sheta EA, Nishimura JS, Roman LJ, Martasek P. Neuronal nitric oxide synthase, a modular enzyme formed by convergent evolution: structure studies of a cysteine thiolate-liganded heme protein that hydroxylates L-arginine to produce NO. as a cellular signal. FASEB J. 1996;10:552–558. doi: 10.1096/fasebj.10.5.8621055. [DOI] [PubMed] [Google Scholar]
- 2.Stuehr DJ, Tejero J, Haque MM. Structural and mechanistic aspects of flavoproteins: electron transfer through the nitric oxide synthase flavoprotein domain. FEBS J. 2009;276:3959–3974. doi: 10.1111/j.1742-4658.2009.07120.x. [DOI] [PMC free article] [PubMed] [Google Scholar]
- 3.Leferink NG, Hay S, Rigby SE, Scrutton NS. Towards the free energy landscape for catalysis in mammalian nitric oxide synthases. FEBS J. 2014 doi: 10.1111/febs.13171. [DOI] [PubMed] [Google Scholar]
- 4.Spratt DE, Taiakina V, Palmer M, Guillemette JG. Differential binding of calmodulin domains to constitutive and inducible nitric oxide synthase enzymes. Biochemistry. 2007;46:8288–8300. doi: 10.1021/bi062130b. [DOI] [PubMed] [Google Scholar]
- 5.Persechini A, Tran QK, Black DJ, Gogol EP. Calmodulin-induced structural changes in endothelial nitric oxide synthase. FEBS Lett. 2013;587:297–301. doi: 10.1016/j.febslet.2012.12.012. [DOI] [PMC free article] [PubMed] [Google Scholar]
- 6.Smith BC, Underbakke ES, Kulp DW, Schief WR, Marletta MA. Nitric oxide synthase domain interfaces regulate electron transfer and calmodulin activation. Proc Natl Acad Sci USA. 2013;110:E3577–3586. doi: 10.1073/pnas.1313331110. [DOI] [PMC free article] [PubMed] [Google Scholar]
- 7.Campbell MG, Smith BC, Potter CS, Carragher B, Marletta MA. Molecular architecture of mammalian nitric oxide synthases. Proc Natl Acad Sci USA. 2014;111:E3614–3623. doi: 10.1073/pnas.1413763111. [DOI] [PMC free article] [PubMed] [Google Scholar]
- 8.Tran QK, Leonard J, Black DJ, Nadeau OW, Boulatnikov IG, Persechini A. Effects of combined phosphorylation at Ser-617 and Ser-1179 in endothelial nitric-oxide synthase on EC50(Ca2+) values for calmodulin binding and enzyme activation. J Biol Chem. 2009;284:11892–11899. doi: 10.1074/jbc.M806205200. [DOI] [PMC free article] [PubMed] [Google Scholar]
- 9.Tran QK, Leonard J, Black DJ, Persechini A. Phosphorylation within an autoinhibitory domain in endothelial nitric oxide synthase reduces the Ca2+ concentrations required for calmodulin to bind and activate the enzyme. Biochemistry. 2008;47:7557–7566. doi: 10.1021/bi8003186. [DOI] [PMC free article] [PubMed] [Google Scholar]
- 10.Allen MW, Urbauer RJ, Zaidi A, Williams TD, Urbauer JL, Johnson CK. Fluorescence labeling, purification, and immobilization of a double cysteine mutant calmodulin fusion protein for single-molecule experiments. Anal Biochem. 2004;325:273–284. doi: 10.1016/j.ab.2003.10.045. [DOI] [PubMed] [Google Scholar]
- 11.Slaughter BD, Allen MW, Unruh JR, Urbauer RJB, Johnson CK. Single-molecule resonance energy transfer and fluorescence correlation spectroscopy of calmodulin in solution. J Phys Chem B. 2004;108:10388–10397. [Google Scholar]
- 12.Unruh JR. Development of fluorescence spectroscopy tools for the measurement of biomolecular dynamics and heterogeneity. University of Kansas; 2006. p. 237. [Google Scholar]
- 13.Brochon J-C. Maximum entropy method of data analysis in time-resolved spectroscopy. Methods Enzymol. 1994;240:262–311. doi: 10.1016/s0076-6879(94)40052-0. [DOI] [PubMed] [Google Scholar]
- 14.Yokom AL, Morishima Y, Lau M, Su M, Glukhova A, Osawa Y, Southworth DR. Architecture of the nitric-oxide synthase holoenzyme reveals large conformational changes and a calmodulin-driven release of the FMN domain. J Biol Chem. 2014;289:16855–16865. doi: 10.1074/jbc.M114.564005. [DOI] [PMC free article] [PubMed] [Google Scholar]
- 15.Daff S. NO synthase: Structures and mechanisms. Nitric Oxide. 2010;23:1–11. doi: 10.1016/j.niox.2010.03.001. [DOI] [PubMed] [Google Scholar]
- 16.Brunner K, Tortschanoff A, Hemmens B, Andrew PJ, Mayer B, Kungl AJ. Sensitivity of flavin fluorescence dynamics in neuronal nitric oxide synthase to cofactor-induced conformational changes and dimerization. Biochemistry. 1998;37:17545–17553. doi: 10.1021/bi981138l. [DOI] [PubMed] [Google Scholar]
- 17.Persechini A, McMillan K, Leakey P. Activation of myosin light chain kinase and nitric oxide synthase activities by calmodulin fragments. J Biol Chem. 1994;269:16148–16154. [PubMed] [Google Scholar]
- 18.Tran QK, Black DJ, Persechini A. Dominant affectors in the calmodulin network shape the time courses of target responses in the cell. Cell Calcium. 2005;37:541–553. doi: 10.1016/j.ceca.2005.02.001. [DOI] [PubMed] [Google Scholar]
- 19.Astashkin AV, Chen L, Zhou X, Li H, Poulos TL, Liu KJ, Guillemette JG, Feng C. Pulsed electron paramagnetic resonance study of domain docking in neuronal nitric oxide synthase: the calmodulin and output state perspective. J Phys Chem A. 2014;118:6864–6872. doi: 10.1021/jp503547w. [DOI] [PMC free article] [PubMed] [Google Scholar]
- 20.Sobolewska-Stawiarz A, Leferink NG, Fisher K, Heyes DJ, Hay S, Rigby SE, Scrutton NS. Energy landscapes and catalysis in nitric-oxide synthase. J Biol Chem. 2014;289:11725–11738. doi: 10.1074/jbc.M114.548834. [DOI] [PMC free article] [PubMed] [Google Scholar]
- 21.Ghosh DK, Ray K, Rogers AJ, Nahm NJ, Salerno JC. FMN fluorescence in inducible NOS constructs reveals a series of conformational states involved in the reductase catalytic cycle. FEBS J. 2012;279:1306–1317. doi: 10.1111/j.1742-4658.2012.08525.x. [DOI] [PubMed] [Google Scholar]
- 22.Salerno JC, Ray K, Poulos T, Li H, Ghosh DK. Calmodulin activates neuronal nitric oxide synthase by enabling transitions between conformational states. FEBS Lett. 2013;587:44–47. doi: 10.1016/j.febslet.2012.10.039. [DOI] [PubMed] [Google Scholar]
Associated Data
This section collects any data citations, data availability statements, or supplementary materials included in this article.


