

Abstract
Histotripsy is an ultrasound ablation method that depends on the initiation of a cavitation bubble cloud to fractionate soft tissue. Previous work has demonstrated a cavitation cloud can be formed by a single pulse with one high amplitude negative cycle, when the negative pressure amplitude directly exceeds a pressure threshold intrinsic to the medium. We hypothesize that the intrinsic threshold in water-based tissues is determined by the properties of the water inside the tissue and changes in tissue stiffness or ultrasound frequency will have a minimal impact on the histotripsy intrinsic threshold. To test this hypothesis, the histotripsy intrinsic threshold was investigated both experimentally and theoretically. The probability of cavitation was measured by subjecting tissue phantoms with adjustable mechanical properties and ex vivo tissues to a histotripsy pulse of 1–2 cycles produced by 345 kHz, 500 kHz, 1.5 MHz, and 3 MHz histotripsy transducers. Cavitation was detected and characterized by passive cavitation detection and high-speed photography, from which the probability of cavitation was measured vs. pressure amplitude. The results demonstrated that the intrinsic threshold (the negative pressure at which probability=0.5) is independent of stiffness for Young’s moduli (E) < 1 MPa with only a small increase (~2–3 MPa) in the intrinsic threshold for tendon (E=380 MPa). Additionally, results for all samples showed only a small increase of ~2–3 MPa when the frequency was increased from 345 kHz to 3 MHz. The intrinsic threshold was measured to be between 24.7–30.6 MPa for all samples and frequencies tested in this study. Overall, the results of this study indicate that the intrinsic threshold to initiate a histotripsy bubble cloud is not significantly impacted by tissue stiffness or ultrasound frequency in hundreds of kHz to MHz range.
Keywords: Histotripsy, Cavitation, Intrinsic Threshold, Frequency, Tissue Mechanical Properties
Introduction
Histotripsy is a noninvasive tissue ablation method that controllably fractionates soft tissue through cavitation generated by high pressure (>10 MPa), short duration (<20μs) ultrasound pulses at low duty cycles (<1 %) (Xu et al. 2005; Parsons et al. 2006a; Roberts et al. 2006). Histotripsy depends on the initiation and maintenance of a dense cavitation bubble cloud to produce mechanical tissue fractionation (Xu et al. 2005; Parsons et al. 2007). With sufficiently high pressure and dose, histotripsy can completely fractionate soft tissue into an acellular liquid homogenate, resulting in effective tissue disintegration (Xu et al. 2005; Hall et al. 2007).
Previous work has demonstrated two mechanisms in which a histotripsy cavitation cloud can be generated. In the first, termed the “shock scattering mechanism,” a dense bubble cloud is formed from a single multi-cycle histotripsy pulse (e.g., 3–20 cycles) using shock scattering from sparse initial bubbles formed and expanded during the initial cycles of the pulse (Maxwell et al. 2011b). In this process, single or sparse initial bubbles, which for the purpose of this study will be termed “incidental bubbles,” are formed from large heterogeneous nuclei in the focus or due to the growing of cavitation nuclei over multiple cycles (Maxwell et al. 2010; Maxwell et al. 2011a). These incidental bubbles are formed significantly below the intrinsic threshold, which is termed as the threshold to generate cavitation directly from the incident negative pressure phase of a single cycle pulse. These incidental bubbles act as pressure release surfaces wherein the following positive pressure shock fronts are inverted and superimposed on the incident negative pressure phase to form negative pressures that produce a dense cavitation cloud growing back toward the transducer (Maxwell et al. 2011b). Using the shock scattering mechanism, bubble clouds are initiated at negative pressures ranging from 10–28 MPa. Because of the complexity of the shock scattering process, multiple factors determine whether a cloud initiated, including the distribution of heterogeneous nuclei in the focal region, the size and shape of initial single bubbles, the number of cycles, the shock rise time, and the positive pressure amplitudes (Xu et al. 2007; Maxwell et al. 2010; Maxwell et al. 2011b; Vlaisavljevich et al. 2014b). Additionally, our previous study demonstrated that increases in tissue stiffness result in higher cloud initiation thresholds when using the shock scattering mechanism of bubble cloud formation (Vlaisavljevich et al. 2014b). The mechanism responsible for this increase was hypothesized to be decreased bubble expansion in tissues with higher Young’s modulus, which leads to reduced shock scattering (Vlaisavljevich et al. 2014b). Results of that study suggested that bubble cloud formation in tissues with Young’s moduli >100 kPa was primarily driven by the negative pressure of the incident wave while the contributions of shock scattering were significantly decreased due to suppressed bubble expansion (Vlaisavljevich et al. 2014b).
In addition to the shock scattering mechanism that uses a multi-cycle ultrasound pulse, there is another mechanism for histotripsy cloud formation termed the “intrinsic threshold mechanism,” in which a 1–2 cycle pulse with a single dominant negative pressure phase is used to generate a bubble cloud directly from the negative pressure of the incident wave (Maxwell et al. 2013; Lin et al. 2014c). With these short pulses, cavitation initiation depends solely on the negative pressure when it exceeds a distinct threshold intrinsic to the medium, without the contributions from shock scattering, resulting in a bubble cloud matching the portion of the focal region above the intrinsic threshold (Maxwell et al. 2013; Lin et al. 2014c). In contrast to shock scattering, it is possible that the histotripsy intrinsic threshold will not be affected by changes in tissue stiffness, since the intrinsic threshold mechanism of cloud initiation does not rely on the expansion of initial incidental bubbles in order to initiate a dense bubble cloud. In the previous study by Maxwell et al, an intrinsic threshold of approximately 26–30 MPa was observed for water based soft tissues and tissue phantoms using a 1.1 MHz histotripsy transducer, while the threshold for tissue composed primarily of lipids was significantly lower (15.4 MPa for adipose tissue) (Maxwell et al. 2013). However, Maxwell et al was limited to the measurement of the cavitation probability at a single ultrasound frequency (1.1 MHz) and in tissue phantoms and soft tissues with a limited range of Young’s moduli (≤36 kPa) (Maxwell et al. 2013).
In this study, we investigate the effects of tissue stiffness and ultrasound frequency on the histotripsy intrinsic threshold in tissues with a wide range of Young’s moduli using multiple frequencies. To accomplish this goal, the probability of inertial cavitation was measured by subjecting water, mechanically tunable agarose tissue phantoms, and various ex vivo tissues covering a wide range of stiffness (Young’s moduli=1.13 kPa–380 MPa) to histotripsy pulses produced by 345 kHz, 500 kHz, 1.5 MHz, and 3 MHz histotripsy transducers. The intrinsic threshold was defined as the peak negative pressure at which the probability of generating cavitation, pcav, from a single histotripsy pulse was pcav=0.5. As previous studies show that there is a significant difference in the intrinsic threshold between water-based tissues and lipid-based tissues, and, since the former type covers most soft tissues, we focused on water-based tissues in this study. The results of this study will help explain the role of ultrasound frequency and tissue stiffness in generating a histotripsy bubble cloud using the intrinsic threshold method.
In the final part of this study, two numerical models are used to investigate the potential characteristics of the “intrinsic nuclei” in tissue. Previous work by Maxwell et al. suggested that the histotripsy intrinsic threshold relies upon cavitation nuclei that are intrinsic to the tissue (Maxwell et al. 2013). By intrinsic, we mean that the nuclei appear to be associated with the properties of the medium itself rather than impurities. Although it is possible that these nuclei too are related to impurities, it seems unlikely, as several groups using different sample processing methods have measured approximately the same threshold for inertial cavitation associated with these nuclei in the range of 24 to 33 MPa in distilled water (Briggs 1950; Greenspan and Tschiegg 1982; Sankin and Teslenko 2003; Caupin and Herbert 2006; Herbert et al. 2006; Maxwell et al. 2013). Various theoretical studies suggest that the intrinsic nuclei can be modelled as semi-permanent stabilized gas nuclei caused by impurities in the liquid (Harvey et al. 1944; Yount 1979; Sankin and Teslenko 2003; Bunkin et al. 2009) or spontaneous nuclei that form bubbles in a medium by energy-density fluctuations described by classical nucleation theory (Fisher 1948; Pettersen et al. 1994; Arvengas et al. 2011a; Arvengas et al. 2011b). In the previous study by Maxwell et al., a theoretical simulation using a 2.5 nm stabilized nuclei resulted in a cavitation threshold closely matching experiments (Maxwell et al. 2013). However, it remains unclear if the intrinsic nuclei are small, stabilized gas nuclei or spontaneous nuclei. Therefore, in this study, two separate simulations were performed to investigate the pressure thresholds predicted by spontaneous and nanometer-sized stable nuclei, with the intention to provide a theoretical explanation for the intrinsic thresholds measured experimentally.
Methods
Sample Preparation
The intrinsic cavitation threshold was tested for distilled water, mechanically tunable agarose tissue phantoms, and ex vivo bovine tissues (liver, tongue, and tendon). The agarose tissue phantoms and ex vivo tissues selected are all water-based, as this paper focuses on water-based tissue. Cavitation probability versus pressure was measured in three samples of each type.
First, the effect of ultrasound frequency on the cavitation threshold was tested in distilled, degassed water (15% O2). Water was degassed prior to experiments in order to minimize any stable gas bubbles in the sample. Water samples were degassed by repeated boiling and then placing the sample to cool under a partial vacuum (~20 kPa, absolute) for 30 minutes. For comparison, the threshold in minimally degassed water (90% O2), was also investigated. Gas saturation was measured using an O2 meter (DO200; YSI, Yellow Springs, OH, USA).
To compare the effects of tissue stiffness on the cavitation threshold, mechanically tunable agarose tissue phantoms were used to provide a well-controlled elastic medium for this study. Agarose phantoms were selected to cover the mechanical stiffness of tissues found in the body from non-load bearing tissues such as lung, liver, and kidney (Young’s moduli ranging from 1–10 kPa) to strong load bearing tissues such as cartilage (Young’s moduli of ~1 MPa). Agarose phantoms of 0.3%, 1%, 2.5%, and 5% w/v were prepared by slowly mixing agarose powder (Agarose Type VII; Sigma-Aldrich, St. Louis, MO, USA) into saline solution (0.9% sodium chloride; Hospira, Lake Forest, Illinois, USA) heated to boiling temperature. The solution was stirred on a hot plate until the gel turned completely transparent and then allowed to boil for ten minutes. After boiling, solutions were allowed to cool and were degassed under a partial vacuum (~20 kPa, absolute) for 30 minutes. After degassing, the solution was poured into tissue phantom holders and placed in a refrigerator at 4°C to allow the agarose solution to solidify prior to use. The mechanical properties of the agarose phantoms were measured using a parallel-pate AR-G2 rheometer (TA Instruments, New Castle, DE, USA) on a Peltier stage, similar to previous studies (Balgude et al. 2001; Ulrich et al. 2010). The stage was initially heated to 90°C, and samples were allowed to melt for 1 minute before the top plate was lowered to create a gap of 1000 μm. The stage was cooled to 60°C and excess solution was wiped off and the gap was sealed with mineral oil (Sigma, St. Louis, MO, USA) to prevent evaporation. Samples were held at 60°C for two minutes to ensure a uniform starting temperature, and then cured at 4°C for 20 minutes. The samples were then heated to 20°C for 10 minutes and the mechanical properties were measured. The shear modulus (G) was measured at a frequency of 0.1 radian per second with 0.05% strain for 5% and 2.5% tissue phantoms and 0.1% strain for 1% and 0.3% tissue phantoms. Three independent samples were measured for each weight percent, with the results reported as the mean ± a 95% confidence interval. The Young’s modulus (E) was estimated from the shear modulus as E=3G (Table 1).
Table 1. Sample mechanical properties.
Table shows the Young’s modulus, density, and water content values for all samples tested in this study. The Young’s modulus of agarose tissue phantoms was measured using shear rheology (E=3G). Ex vivo bovine liver, tongue, and tendon were used to cover a large range of tissue Young’s modulus as measured in the literature (Diem K. 1970; Yamada 1973; ICRP 1975; Woodard and White 1986; ICRU 1989; Duck 1990; Staubli et al. 1999).
| Young’s Modulus (kPa) | Density (kg/m3) | Water Content (%) | |
|---|---|---|---|
| Water | - | 998 | 100 |
| 0.3% Agarose | 1.13±.047 | 1003.0 | 98.8 |
| 1% Agarose | 21.7±1.0 | 1010.0 | 98.1 |
| 2.5% Agarose | 242±27 | 1025.0 | 96.7 |
| 5% Agarose | 570±46 | 1050.0 | 94.3 |
| Liver | 8.7 | 1060 | 74.2 |
| Tongue | 25 | - | 66 |
| Tendon | 380,000 | 1165 | 63 |
For ex vivo tissue experiments, fresh bovine liver, tongue, and tendon were excised at a local slaughter house and immediately placed into degassed 0.9% saline solution and stored at 4°C until experiments. Tissue samples were sectioned and warmed to room temperature in degassed saline under a partial vacuum (~20 kPa, absolute) for 4 hours prior to experiments. Each sample was embedded in a 1% agarose tissue phantom, which was prepared as described above. The samples were embedded in agarose to fix the position of the tissue and displace any remaining air. All tissue samples were several cm in the dimension transverse to the acoustic axis and at least 1 cm in dimension along the acoustic axis as positioned during testing. All tissues were used within 48 hours of harvesting. In order to compare the cavitation threshold results with tissue stiffness, Young’s modulus values from literature were chosen as a tissue mechanical property metric for this study and are provided in Table 1 (Diem K. 1970; Yamada 1973; ICRP 1975; Woodard and White 1986; ICRU 1989; Duck 1990; Staubli et al. 1999).
Histotripsy Pulse Generation
Histotripsy pulses were generated at four ultrasound frequencies (345 kHz, 500 kHz, 1.5 MHz, and 3 MHz) using three custom-built histotripsy transducers. The 345 kHz pulses were generated by a twenty element array transducer with a geometric focus of 150 mm, an aperture size of 272 mm, and an f-number of 0.55. The 1.5 MHz pulses were generated by a six element array transducer with a geometric focus of 55mm, an aperture of 79 mm in the elevational direction and 69 mm in the lateral direction, and effective f-numbers of 0.7 and 0.8 in the elevational and lateral directions, respectively. The 500 kHz and 3 MHz pulses were generated by a dual frequency array transducer that consisted of twelve 500-kHz elements and seven 3-MHz elements. For the 500 kHz elements, the geometric focus was 40 mm, the aperture size was 71 mm, and the f-number was 0.56. For the 3 MHz elements, the geometric focus was 40 mm, the aperture size was 80 mm, and the f-number was 0.5. The design of this dual frequency transducer has been described in detail in a previous study (Lin et al. 2014a).
To measure the intrinsic threshold in each sample, short pulses with a single dominant negative pressure phase were applied to the sample (Fig. 1). We expect that the differences in the f-numbers of the transducers do not impact the intrinsic threshold measurements, as the intrinsic threshold depends primarily on the negative pressure phase of the pulse and is not affected by the positive pressure phase or nonlinear propagation, although it may be affected by differences in the beam dimensions (Maxwell et al. 2013; Lin et al. 2014b; Lin et al. 2014c). To generate a short therapy pulse, a custom high-voltage pulser developed in-house was used to drive the transducers. The pulser was connected to a field-programmable gate array (FPGA) development board (Altera DE1 Terasic Technology, Dover, DE, USA) specifically programmed for histotripsy therapy pulsing. This setup allowed the transducers to output short pulses consisting of less than two cycles. A fiber-optic probe hydrophone (FOPH) built in-house (Parsons et al. 2006b) was used to measure the acoustic output pressure of the transducers. At higher pressure levels, the acoustic output could not be directly measured due to cavitation at the fiber tip. These pressures were estimated by a summation of the output focal p-values from individual transducer elements. This approximation assumes minimal nonlinear distortion of the waveform occurs within the focal region. In a previous study (Maxwell et al. 2013), this estimated p- was found to be accurate within 15% compared to direct focal pressure measurements in water and in a medium with a higher cavitation threshold, 1,3 butanediol.
Figure 1. Histotripsy waveforms.

Plots showing example histotripsy waveforms produced by 345 kHz, 500 kHz, 1.5 MHz, and 3 MHz histotripsy transducers.
For threshold experiments, histotripsy pulses were applied inside different samples at a pulse repetition frequency (PRF) of 0.5 Hz. The PRF was kept very low to minimize the possibility that cavitation from one pulse would change the probability of cavitation on a subsequent pulse. In a previous study (Maxwell et al. 2013), it was demonstrated that for PRFs > 1 Hz, cavitation during a pulse increased the likelihood of cavitation on a following pulse, but this effect was not observed for PRFs below 1 Hz, since the residual nuclei from a histotripsy pulse dissolve within ~1 second after the histotripsy pulse. In solid samples, the focus was translated for each pulse by 1 mm transverse to the acoustic propagation direction in a 10 × 10 grid for each pressure level in order to minimize the effects of cavitation damage to the solid sample altering the probability of cavitation. Although each focal volume only received a single pulse for solid samples, the PRF was kept at a low rate of 0.5 Hz for consistency. Translating the volume and using a low PRF were both done to prevent the effects of the previous pulse from affecting the results on a subsequent pulse. At each pressure level tested, 100 pulses were applied to the sample.
Cavitation Detection using Optical Imaging
High speed optical imaging was used as a method to detect cavitation for water and agarose tissue phantoms using two high speed cameras (Fig. 2). The cameras were triggered to record one image for each applied pulse at a time point approximately corresponding to the maximum bubble expansion for each sample and frequency combination. These time points were determined prior to experiments in a separate study by changing the delay time on the camera to reconstruct representative radius vs. time curves of the bubbles and identify the time corresponding to maximum bubble expansion (Vlaisavljevich et al. 2014c). For experiments with the 345 kHz and 1.5 MHz transducers, a high-speed, 1 megapixel CCD camera (Phantom V210, Vision Research, Wayne, NJ, USA) was aligned with the transducer and backlit by a continuous white-light source. The camera was focused using a macro-bellows lens (Tominon 1:4.5, F=105 mm; Kyocera, Kyoto, Japan), giving the captured images a resolution of approximately 5.9 μm per pixel and 3.4 μm per pixel for 345 kHz and 1.5 MHz, respectively. For experiments with the 500 kHz and 3 MHz dual frequency transducer, a digital, 1.3-megapixel CCD camera (PN: FL3-U3-13Y3M-C, Flea® 3; PointGrey, Richmond, BC, Canada) was positioned perpendicularly to the dual-frequency array transducer facing one of its optical windows. A Nikon 4× objective (MRP70040; Nikon, Chiyoda, Tokyo, Japan) was attached to the camera with extension tubes to magnify the image plane, giving the captured images a resolution of approximately 2.5 μm per pixel. A pulsed white-light LED was placed on the diametrically-opposed optical window of the dual-frequency array transducer, which provided back-lit illumination. The camera exposure time was 2 μs for all images. After acquisition, shadowgraph images were converted from grayscale to binary by an intensity threshold determined by the background intensity using image processing software (MATLAB; The Mathworks, Natick, MA, USA). Bubbles were indicated as any black regions >5 pixels in diameter. By this criterion, the minimum resolvable bubble radius was 14.75 μm, 6.25 μm, 8.5 μm, and 6.25 μm for the 345 kHz, 500 kHz, 1.5 MHz, and 3 MHz transducers, respectively. The number of frames that contained cavitation bubbles was recorded, and the fraction of total frames (out of 100) for which any cavitation was detected was determined as the cavitation probability.
Figure 2. Experimental setup.

Histotripsy pulses were applied to the inside of water, mechanically tunable tissue phantoms, and various ex vivo bovine tissues. Cavitation was monitored using high speed optical imaging for transparent samples. Additionally, cavitation was monitored using one of the therapy transducer elements as passive cavitation detection for all samples.
Passive Cavitation Detection (PCD)
High speed imaging simplifies the detection of cavitation in transparent media but could not be used with tissue samples. As a result, an acoustic method was also used to identify cavitation in the focal zone in all media. Additionally, since relying upon an image of the bubbles taken at a single time point is a potential limitation, the PCD method allowed cavitation to be monitored over a much longer time period following the passage of the pulse. For each experiment, one of the transducer’s therapy elements was also used for PCD to detect the presence of cavitation in the focal region (Fig. 2). The PCD signal was connected to an oscilloscope (LT372; Lecroy, Chestnut Ridge, NY, USA) with the time window selected to record the backscattering of the therapy pulse from cavitation bubbles (Roy et al. 1990; Herbert et al. 2006; Maxwell et al. 2013). To determine whether cavitation occurred during a pulse, the signal generated by backscattering of the incident pulse from the focus was analyzed following the method used in the previous study by Maxwell et al (Maxwell et al. 2013). In this process, a bubble is generated by the negative pressure phase of the pulse, and the following positive pressure is then scattered off the bubble and detected by the PCD. It should be noted, however, that subsequent bubbles aren’t formed from shock scattering in this case since the pulse contains a single dominant negative phase. Previous work has demonstrated that generating a bubble cloud from shock scattering requires both the scattering of the positive pressure and the constructive interference with the subsequent negative cycles to generate bubbles (Maxwell et al. 2010; Maxwell et al. 2011b; Vlaisavljevich et al. 2014b). Although some positive pressure is scattered here, there are no (or very small) following negative pressure cycles to constructively interfere with the scattered shockwave. The exception to this would be if the reflected shock directly exceeds the intrinsic threshold which would not be expected (and wasn’t observed) under the conditions used in this study. The backscattered pressure amplitude was received by the PCD at the time point corresponding to two times the time of flight for the focal length of the respective transducers. The integrated frequency power spectrum (SPCD) of the backscatter signal was used as a measure of whether cavitation occurred according to the method previously described by Maxwell et al (Maxwell et al. 2013).
Intrinsic Threshold Measurement and Comparison
The probability of observing cavitation followed a sigmoid function, given by
| (E1) |
where erf is the error function, pint is the negative pressure at which the probability pcav=0.5, σ is a variable related to the width of the transition between pcav=0 and pcav=1, with ± σ giving the difference in pressure from about pcav=0.15 to pcav=0.85 for the fit (Maxwell et al. 2013). The intrinsic threshold for each sample, pint, is defined as the p-corresponding to pcav=0.5 as calculated by the curve fit. Curve fitting for all data sets was performed using an OriginLab curve fitting program (OriginPro 9.1; OriginLab Corporation, Northampton, MA, USA). The fit curves for all samples were analyzed statistically to determine whether the differences in the values of pint were significantly different from each other. The standard errors for pint were estimated by a covariance matrix using the delta method (Hosmer and Lemeshow 1992). The curves were compared using a two-sample t-test with statistic at a 95% confidence interval. Results were considered statistically significant for p<0.05. Note that the standard error does not include the uncertainty in absolute pressure from the hydrophone measurement, only the uncertainty in the fit, because the values pint are relative.
Threshold Simulation: Stabilized nuclei
To provide a theoretical explanation to the experimental results, a numerical model based on a linear Kelvin-Voigt model was used to investigate the effects of tissue stiffness and ultrasound frequency on the pressure threshold, assuming that the intrinsic threshold is due to nanometer-sized stabilized cavitation nuclei in the tissue. In a previous study, a similar model showed a pressure threshold matching the histotripsy intrinsic threshold at 1.1 MHz when an initial bubble radius of 2.5 nm was used, corresponding with a threshold for inertial cavitation of 28.1 MPa (Maxwell et al. 2013). For nuclei of this size, surface tension dominates the cavitation threshold, similar to the Blake threshold (Blake 1949; Leighton 1994; Maxwell et al. 2013). To test the effects of tissue stiffness and ultrasound frequency on the threshold for generating inertial cavitation, simulations exposed a 2.5 nm initial bubble to a single peak negative pressure
| (E2) |
where pA is the peak negative pressure, ω is the angular frequency of the experimental ultrasound wave, δ is a time delay, and n is a curve-fitting parameter which was set to 3.7 so that the shape of the simulated waveform p-closely matched the shape and duration of the p- from the histotripsy waveforms used experimentally. It should be noted that these theoretical waveforms were used for simulations instead of the experimentally measured waveforms (Fig. 1). The positive pressure of the experimentally measured waveforms caused rapid collapse of the bubbles that did not match experiments. One explanation for the mismatch is that the bubble scattered the positive portion of the waveform without shrinking. While this is a limitation of the current model, it is likely an appropriate assumption considering previous work showing that the bubbles formed using the intrinsic threshold method are generated directly from the negative pressure of the incident wave and do not depend on the positive pressure (Maxwell et al. 2013; Lin et al. 2014b; Lin et al. 2014c).
For this study, we assume the surrounding medium to have homogeneous properties, and that the bubble contains air and remains spherical. These assumptions allow us to use a numerical model developed in-house for simulating spherical bubble dynamics in a viscoelastic medium with viscous, elastic, relaxation and retardation effects, including liquid compressibility and heat transfer. Since the present focus is on the initial threshold behavior and the resulting growth, we neglect heat transfer and consider a simple viscoelastic model (linear Kelvin-Voigt) that includes viscosity and elasticity (Yang and Church 2005). In the Kelvin-Voigt model, the stress tensor τ is related to the deformation tensor γ and the rate of deformation tensor γ̇ through
| (E3) |
where G is the shear modulus (elasticity) and μ is the viscosity. The stress tensor is related to the bubble radius R through the Keller-Miksis equation (Keller and Miksis 1980)
| (E4) |
which depends on the medium’s sound speed c, density ρ, and surface tension against air S. Here p∞(t) is the absolute forcing pressure, r is the radial coordinate, and overdots (·) denote derivatives with respect to time, t. The air within the bubble is assumed to have spatially uniform pressure given by the polytropic relationship
| (E5) |
where κ =1.4 is the ratio of specific heats for air, R0 is the initial bubble radius, and p0 = p∞(0) + 2S/R0 is the initial bubble pressure. Using the Yang and Church model,
| (E6) |
the Keller-Miksis equation can be solved for the bubble wall acceleration R̈ and integrated in time (Yang and Church 2005). The properties ρ =1000 kg/m3, c=1497 m/s2, μ=1.00 mPa-s (viscosity of water), and S=72 mN-m (water-air surface tension) were used to approximate the surrounding medium. The Young’s modulus (approximated for soft tissue as E = 3G) was varied in decades from 1 kPa to 10 MPa to compare the effects of Young’s modulus on the cavitation threshold. Ultrasound frequencies were 345 kHz, 500 kHz, 1.5 MHz, and 3 MHz for comparison with experimental results. The maximum bubble radius was plotted as a function of the peak negative pressure using different ultrasound frequencies and tissue Young’s moduli for initial bubble nuclei of 2.5 nm. A further simulation was conducted to investigate the threshold as a function of initial nuclei size in order to determine the range of nuclei corresponding the experimentally measured thresholds. The pressure threshold for this simulation was defined as the pressure required to expand an initial bubble to >15 μm in radius, to be consistent with the minimum resolution for optical images recorded experimentally. This criteria is more reasonable for histotripsy therapy than the commonly used criteria for inertial cavitation of Rmax>2 R0, since previous work has shown that histotripsy bubbles must be sufficiently expanded to sizes much greater than 2R0, often >50 μm, in order to fractionate tissue (Parsons et al. 2006a; Xu et al. 2007; Vlaisavljevich et al. 2013a; Vlaisavljevich et al. 2014c).
Threshold Simulation: Spontaneous Nucleation
To investigate the effects of ultrasound frequency on the cavitation threshold predicted for spontaneous nucleation, a theoretical analysis was performed based on classical nucleation theory (CNT) (Pettersen et al. 1994; Caupin and Herbert 2006; Herbert et al. 2006; Arvengas et al. 2011a). Previous studies using CNT suggest that the cavitation threshold decreases at lower frequency due to the larger focal volume and increased duration of the applied p-(Pettersen et al. 1994; Arvengas et al. 2011a). The threshold predicted by CNT, pt_CNT, was calculated as
| (E7) |
where α is the surface energy, kb is the Boltzmann’s constant, T is temperature in Kelvin, Γ0 is a prefactor, Vf is the focal volume for a given frequency, and τf is the time the focal volume is above a given pressure (Fisher 1948; Pettersen et al. 1994; Herbert et al. 2006; Arvengas et al. 2011a; Arvengas et al. 2011b). Γ0 was set to Γ0=1033 similar to previous work (Pettersen et al. 1994) and T was set to 293K to match experiments. Vf and τf were modified for each frequency with τf set to one fourth of the acoustic period and Vf representing the focal volume of each transducer. The values of Vf were calculated from the −6 dB FWHM beam profiles of the transducers used in this study assuming an ellipsoidal focus, and were 47.07 mm3, 7.89 mm3, 2.30 mm3, and 0.072 mm3, for 345 kHz, 500 kHz, 1.5 MHz, and 3 MHz, respectively. The surface energy, α, was set to 18.8 mN/m, ~25% of the macroscopic surface tension of water. This value for surface energy was chosen such that results matched the experimental threshold at 500 kHz. Previous work has suggested that, since the cavitation nucleus has a nanoscopic size, it is not accurate to use the bulk, macroscopic surface tension value for surface energy (Herbert et al. 2006; Arvengas et al. 2011b). The surface energy value used in this study closely matches the value calculated in a previous study by Herbert et al., and resulted in more reasonable results for pt_CNT than those calculated using the macroscopic values of surface tension (Herbert et al. 2006).
Results
Intrinsic Threshold in Water
To investigate the effects of ultrasound frequency on the intrinsic threshold, histotripsy pulses were first applied to distilled, degassed water using the 345 kHz, 500 kHz, 1.5 MHz, and 3 MHz histotripsy transducers. Optical imaging results show that the intrinsic threshold, pint, in water was found to be between pint = 24.9–27.7 MPa, with σmean = 1.6 MPa for 345 kHz; pint = 25.8–26.7 MPa, with σmean = 2 MPa for 500 kHz; pint = 26.2–27.8 MPa, with σmean = 1.2 MPa for 1.5 MHz; and pint = 26.1–27.9 MPa, with σmean = 1.1 MPa for 3 MHz. Figure 3 shows example images taken using the 1.5 MHz transducer at peak negative pressure levels from below to above the intrinsic threshold. In the experimental data for all frequencies, cavitation was observed with pcav = 1 for p– higher than 30 MPa. As pressure was increased above the intrinsic threshold, the bubbles were visualized in an increasingly larger area with a greater number of bubbles present in this focal region as has been previously observed (Maxwell et al. 2013; Lin et al. 2014c). Although the bubbles covered a larger area at higher pressure, the diameter of bubbles that could be individually identified appeared to be consistent between pressure levels for the same frequency at the time point captured by the camera, potentially due to bubble-bubble interactions suppressing the growth of adjacent bubbles or bubble-induced pressure saturation caused by energy loss into each bubble as it forms, which has previously been observed in shock wave lithotripsy (Freund 2008; Pishchalnikov et al. 2008). When varying frequency, differences in bubble size were noticed with lower frequency producing larger bubbles.
Figure 3. Cavitation Detection.

Sample PCD temporal (left) and frequency (center) signals were used for cavitation detection. Results showed agreement with high speed optical images of cavitation (right). Representative images shown are from 1.5 MHz histotripsy pulses applied to degassed water (ultrasound propagating top to bottom).
In addition to high speed imaging, cavitation was monitored using one of the therapy transducer elements for PCD following a previously established method (Maxwell et al. 2013). The cavitation detection results from PCD and optical imaging methods matched well in water (Fig. 3). When cavitation occurred on high-speed images, the PCD signal was a multi-cycle burst of significantly increased amplitude with a center frequency near the therapy transducer frequency. When no cavitation was observed on the camera, the PCD signal amplitude was small. Figure 4 shows an example of the relative values of SPCD versus pulse number for 100 pulses near the intrinsic threshold in degassed water using the 1.5 MHz transducer.
Figure 4. Example of Integrated Power Spectrum (SPCD) Bimodal distribution.

Results show the SPCD for 100 histotripsy pulses applied by the 1.5 MHz transducer at a peak negative pressure of 25.3 MPa. A bimodal distribution is evident, with the lower, more consistent values indicating the absence of cavitation, and the larger, more variable values indicating the presence of one or more bubbles.
The gas concentration of the water sample had a small effect on the cavitation probability curve at 1.5 MHz and 3 MHz, but showed a large difference at 345 kHz and 500 kHz (Fig. 5). For example, the cavitation threshold in both degassed (15% O2) and gassy water (90% O2) was between 26.3–27.4 MPa for all samples at 1.5 MHz and 3 MHz. In contrast, the cavitation threshold in gassy water (90% O2) was observed to decrease by 6.5 MPa at 500 kHz and 13.6 MPa at 345 kHz compared to the intrinsic threshold in degassed water (15% O2) (Fig. 5).
Figure 5. Cavitation threshold in water.

Example probability curves for water samples. Results showed a significant decrease the cavitation threshold for 90% O2 water at 345 kHz and 500 kHz compared to degassed 15% O2 water. No significant difference was observed between 90% O2 and 15% O2 water at 1.5 MHz or 3 MHz.
Intrinsic Threshold in Tissue Phantoms
To investigate the effects of tissue stiffness on the intrinsic threshold, experiments were repeated inside mechanically tunable tissue phantoms. Four types of tissue phantoms were tested at each frequency, with the Young’s moduli ranging from 1.13–570 kPa. Results demonstrated a similar function of cavitation probability versus pressure in all tissue phantoms (Fig. 6). Furthermore, the intrinsic threshold was observed to be similar in tissue phantoms of all Young’s moduli. For example, at 1.5 MHz, the intrinsic threshold for the four types of tissue phantoms ranged from 24.8–26.7 MPa (Table 2). The region over which cavitation occurred in each sample was similar at similar pressure levels. One difference between tissue phantoms was the bubbles observed in stiffer tissue phantoms were smaller in size at the time point captured by the camera (Fig. 7). The PCD was shown to remain sensitive to the cavitation bubbles formed in all tissue phantoms despite the differences in bubble size (Fig. 7). Comparing the effect of frequency on the threshold in tissue phantoms showed a small difference of ~2–3 MPa in the intrinsic threshold when the frequency was increased from 345 kHz to 3 MHz. The average intrinsic threshold for all phantom and frequency combinations ranged from 24.7–27.8 MPa (Table 2).
Figure 6. Cavitation threshold in tissue phantoms.

Example probability curves for mechanically tunable agarose tissue phantoms. Results showed no significant difference in the intrinsic threshold with increasing stiffness. A small increase of ~2–3 MPa was observed in the threshold as the frequency was increased from 345 kHz to 3 MHz.
Table 2. Threshold results: All samples.
Table shows the values for the intrinsic threshold, pint, calculated by the fitted curves for each sample, the mean values for pint, and σ. All values are pressure in MPa. Statistical analysis demonstrated that, for all sample types, a pair of samples existed within one sample type with a statistically significant difference (p<0.05). Additionally, there existed at least one pair in any two sample types with a significant difference.
| Frequency | Material | Pint (1) | Pint (2) | Pint (3) | Pint (Mean) | σ (mean) |
|---|---|---|---|---|---|---|
| 345 kHz | ||||||
| Water (15% O2) | 27.7 | 24.9 | 25.0 | 25.9 | 1.6 | |
| Water (90% O2) | 10.7 | 13.3 | 12.8 | 12.3 | 3.8 | |
| Agar E = 1.13 kPa | 25.8 | 23.7 | 24.6 | 24.7 | 2.0 | |
| Agar E = 21.7 kPa | 25.9 | 23.7 | 24.7 | 24.8 | 2.0 | |
| Agar E = 242 kPa | 26.8 | 24.8 | 25.0 | 25.5 | 1.9 | |
| Agar E = 570 kPa | 25.9 | 24.9 | 23.6 | 24.8 | 2.2 | |
| Liver | 24.9 | 25.5 | 24.0 | 24.8 | 1.9 | |
| Tongue | 25.0 | 25.6 | 26.5 | 25.7 | 1.4 | |
| Tendon | 27.8 | 27.7 | 27.4 | 27.6 | 1.4 | |
| 500 kHz | ||||||
| Water (15% O2) | 25.9 | 25.8 | 26.7 | 26.1 | 2.0 | |
| Water (90% O2) | 20.3 | 19.0 | 19.6 | 19.6 | 3.6 | |
| Agar E = 1.13 kPa | 24.6 | 23.5 | 27.6 | 25.2 | 1.8 | |
| Agar E = 21.7 kPa | 23.5 | 26.3 | 26.7 | 25.5 | 1.8 | |
| Agar E = 242 kPa | 24.6 | 26.9 | 24.9 | 25.5 | 2.0 | |
| Agar E = 570 kPa | 24.7 | 26.3 | 23.9 | 25.0 | 1.8 | |
| Liver | 25.1 | 26.5 | 24.3 | 25.3 | 2.0 | |
| Tongue | 25.0 | 25.6 | 25.0 | 25.2 | 2.2 | |
| Tendon | 28.1 | 28.9 | 27.7 | 28.2 | 2.8 | |
| 1.5 MHz | ||||||
| Water (15% O2) | 27.6 | 27.8 | 26.2 | 27.2 | 1.2 | |
| Water (90% O2) | 26.2 | 26.9 | 25.7 | 26.3 | 1.6 | |
| Agar E = 1.13 kPa | 25.9 | 25.5 | 27.9 | 26.4 | 0.7 | |
| Agar E = 21.7 kPa | 26.8 | 27.0 | 26.3 | 26.7 | 1.0 | |
| Agar E = 242 kPa | 27.2 | 25.9 | 26.7 | 26.6 | 0.7 | |
| Agar E = 570 kPa | 25.7 | 23.8 | 24.9 | 24.8 | 0.7 | |
| Liver | 27.0 | 26.7 | 28.8 | 27.5 | 1.5 | |
| Tongue | 28.2 | 26.8 | 28.1 | 27.7 | 1.4 | |
| Tendon | 28.8 | 29.9 | 28.6 | 29.1 | 1.6 | |
| 3 MHz | ||||||
| Water (15% O2) | 27.8 | 27.9 | 26.1 | 27.3 | 1.1 | |
| Water (90% O2) | 27.1 | 27.2 | 27.9 | 27.4 | 1.1 | |
| Agar E = 1.13 kPa | 28.4 | 26.9 | 27.1 | 27.5 | 1.3 | |
| Agar E = 21.7 kPa | 26.9 | 27.2 | 26.3 | 26.8 | 0.9 | |
| Agar E = 242 kPa | 27.1 | 26.6 | 27.0 | 26.9 | 0.8 | |
| Agar E = 570 kPa | 27.4 | 28.8 | 27.2 | 27.8 | 0.7 | |
| Liver | 27.4 | 26.5 | 27.6 | 27.2 | 1.1 | |
| Tongue | 28.5 | 28.1 | 28.7 | 28.5 | 1.2 | |
| Tendon | 30.3 | 31.5 | 30.1 | 30.6 | 0.8 |
Figure 7. Cavitation detection in tissue phantoms.

Example PCD signals (left) and corresponding optical images (right) of cavitation in agarose tissue phantoms of increasing Young’s moduli. The PCD signal was observed to remain sensitive to cavitation in stiffer phantoms despite the observe decrease in bubble size.
Intrinsic Threshold in Bovine Tissue
To validate the results from water and tissue phantom experiments, the intrinsic threshold was investigated in select ex vivo bovine tissues. Bovine liver (E=8.7 kPa), tongue (E=25 kPa), and tendon (E=380 MPa) were chosen to cover a wide range of tissue strength. In these tissues, PCD detection demonstrated a similar function of cavitation probability versus pressure in tissues as those in tissue phantoms and degassed water (Fig. 8). The intrinsic threshold was observed to be similar in all tissues with only a small increase observed for tendon (Fig. 8). For example, at 1.5 MHz, the average intrinsic threshold for the three types of tissue ranged from 27.5 MPa (liver) to 29.1 MPa (tendon). Comparing the effect of frequency on the intrinsic threshold showed a small increase with increasing frequency. For example, in liver samples, the intrinsic threshold ranged from 24.8 MPa at 345kHz to 27.2 MPa at 3MHz. The intrinsic threshold for all tissues and frequency combinations ranged from 24.8–30.6 MPa.
Figure 8. Cavitation threshold in ex vivo bovine tissue.

Example probability curves for ex vivo bovine liver, tongue, and tendon. A small increase of ~2–3 MPa was observed in the threshold as the frequency was increased from 345 kHz to 3 MHz.
Intrinsic Threshold Comparison
The intrinsic threshold for all samples was compared using the curve fitting method and statistical analysis described above. In general, the standard errors in the estimate of the intrinsic threshold, pint, were small compared to the variance between samples of the same type. Excluding the gassy water (90% O2), pint for all samples and frequencies was observed to be between 24.8–30.6 MPa, and the σmean between 0.7–2.8 MPa. The full cavitation threshold results for all samples are listed in Table 2. Overall, results showed no noticeable trend in the intrinsic threshold between samples with Young’s moduli <1 MPa. However, a small increase of ~2–3 MPa was observed for tendon (E=380 MPa) compared to other samples (E=1.13–570 kPa). Additionally, results demonstrated a small but consistent increase in the intrinsic threshold of ~2–3 MPa when the frequency was increased from 345 kHz to 3 MHz (Fig. 9A). It should be noted that, in addition to the small changes in threshold observed with changes in frequency, larger σmean values were observed at 345 kHz and 500 kHz compared to 1.5 MHz and 3 MHz (Table 2).
Figure 9. Intrinsic threshold comparison.

(A) Bar plot shows the pint measured for all samples and frequencies studied in this work. The threshold for all samples remained between 24.7–30.6 MPa with the exception of 90% O2 water at 345 kHz and 500 kHz, which was signficantly lower. Results showed no trend in the intrinsic threshold with increasing stiffness for E<1 MPa, but a small increase of ~2–3 MPa was observed for tendon (E=380 MPa). (B) Linear regression analysis demonstrated that the change in pint with increasing Young’s modulus (tendon not included) was not significant via the Pearson correlation (r=–0.173, R2=0.030, p>0.05). (C) Linear regression analysis further showed that the ~2–3 MPa increase in pint with increasing frequency was significant via the Pearson correlation (r=0.57, R2=0.32, p<0.05).
A two-way ANOVA was also performed on the data shown in Figure 9A, demonstrating no significant difference in the threshold between samples at a given frequency, with the exception of the threshold in tendon which was observed to be significantly increased (p<0.05). The ANOVA also showed a significant increase in the threshold between 345 kHz and 3 MHz for all samples. However, only some of the differences between intermediate frequencies were significant. The effects of Young’s modulus and ultrasound frequency were also analyzed by plotting pint for all samples except 90% O2 water (Table 2) as a function of Young’s modulus and frequency (Fig. 9). Linear regression analysis demonstrated that the change in pint with increasing Young’s modulus (tendon not included) was not significant via the Pearson correlation (r=−0.173, R2=0.03, p>0.05) (Fig. 9B), but the change in pint with increasing frequency was significant via the Pearson correlation (r=0.57, R2=0.32, p<0.05) (Fig. 9C).
Threshold Simulation: Stabilized nuclei
To provide a theoretical explanation to the experimental results, the effects of tissue stiffness and ultrasound frequency on the cavitation threshold were investigated using a single bubble numerical simulation assuming a nanometer sized stable nucleus. When the peak negative pressure, pA, was less than some threshold value, pt_sim, bubble expansion was minimal (Rmax<2 R0). As pA was increased above pt_sim, great bubble growth and collapse were observed (Rmax>104 R0). The peak negative pressure corresponding to this transition was defined as the inertial cavitation threshold, pt_sim. Using a 2.5 nm initial bubble, pt_sim was observed to be ~28 MPa for all frequencies tested (Fig. 10A). Similarly, pt_sim was observed to be independent of tissue elastic modulus from 1 kPa to ~1 MPa, due to the threshold being dominated by surface tension rather than the macroscopic properties of the media such as the Young’s modulus (Fig. 10B). However, when the Young’s modulus was increased to 10 MPa, cavitation threshold was no longer determined solely by surface tension and pt_sim increased to ~32 MPa (Fig. 10B). It should be noted that the simulation could not accurately predict the intrinsic threshold in tendon (E=380 MPa). In contrast to the ~2–3 MPa increase in threshold observed experimentally, the model predicted a threshold of >315 MPa when the Young’s modulus was 380 MPa.
Figure 10. Stabilized Nuclei Simulation.

Simulated maximum bubble radius for a 2.5 nm initial bubble subjected to a single cycle histotripsy peak negative pressure waveform demonstrated a distinct threshold of ~28 MPa that was independent of (A) ultrasound frequency (E=1kPa) and (B) tissue stiffness for Young’s moduli <1 MPa (f=1.5MHz). (C) Simulations demonstrated that the cavitation threshold measured experimentally (24.7–30.6 MPa) corresponded to initial bubble sizes between 2.3–2.85 nm (E=1kPa, f=500kHz). (D) Increasing the initial bubble size from 1–100 nm resulted in a decrease in the cavitation threshold with a larger decrease observed at lower frequency (E=1kPa).
The effects of initial nuclei size on the inertial cavitation threshold were also investigated, demonstrating a significant drop in the inertial cavitation threshold with increasing initial bubble radius (Fig. 10). Simulations showed that the experimentally observed thresholds corresponded to an initial bubble size between 2.3 nm (pt_sim = 30.6 MPa) and 2.85 nm (pt_sim = 24.7 MPa) (Fig. 10C). Simulations comparing a larger range of initial nuclei size demonstrated a significant reduction in pt_sim as the nuclei size was increased from 2 nm to ~40–60 nm, at which point the threshold appeared to plateau (Fig. 10D). In the case of nuclei above ~40–60 nm, the final bubble size was dictated through several competing terms including the applied pressure and the tissue elasticity rather than being dominated by surface tension as is the case for smaller initial bubbles, which led to bubbles expanding to approximately the same size with the same pt_sim regardless of initial radius. This effect has similarly been observed in previous studies on shock wave lithotripsy (Zhong et al. 1998). The finding that the threshold decreased with increasing bubble radius, especially at lower frequency (Fig. 10D), helps to explain the significant decrease in the cavitation for 90% O2 water at 345 kHz and 500 kHz (Fig. 5). However, it should also be noted that the likelihood of getting a large bubble in the field is much greater at low frequency than high frequency due to the larger focal volume (>2 orders of magnitude difference between 345 kHz and 3 MHz), which wasn’t accounted for in the single bubble simulation and likely contributed to the experimental results.
Threshold Simulation: Spontaneous Nucleation
The effects of ultrasound frequency on the cavitation threshold predicted by classical nucleation theory (CNT) were also investigated with a simulation as described in the Methods (E7). CNT results predicted that the cavitation threshold would increase by ~2.3 MPa when the frequency was increased from 345 kHz to 3 MHz. These results closely matched experiments, with the value of pt_CNT increasing from 24.9 MPa to 27.2 MPa when the frequency was increased from 345 kHz to 3 MHz (Fig. 11). Figure 11 shows pt_CNT compared with the average pint measured for all agarose tissue phantoms at each frequency. These results suggest that the increase in threshold at higher frequency measured experimentally is due to the smaller focal zone and shorter duration of the applied p-. In fact, since bubbles are generated directly from the single p-phase of the incident wave, it may be more appropriate to use the duration of the applied p- as a metric instead of frequency which may incorrectly imply periodic forcing.
Figure 11. CNT Simulation.
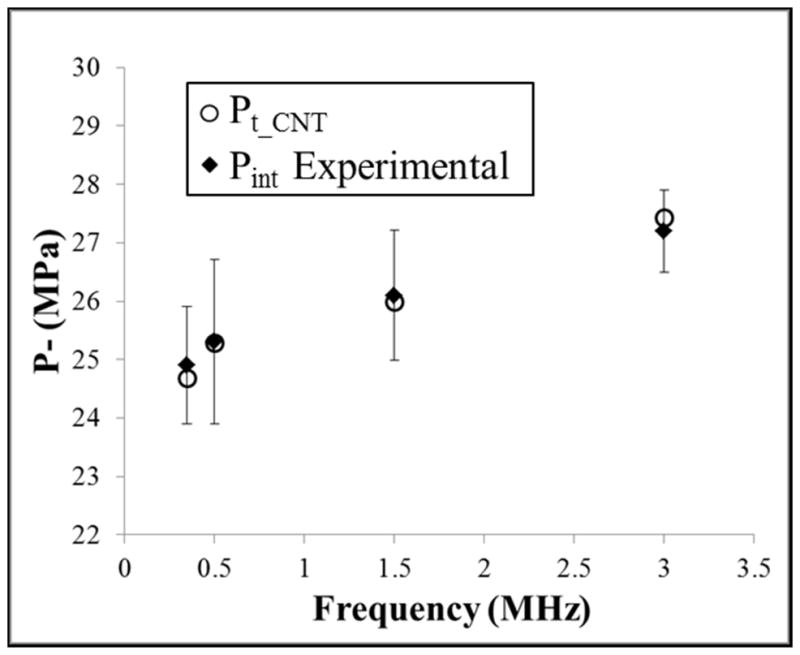
Classical nucleation theory was used to predict the effects of frequency on the cavitation threshold using equation E7. Results demonstrated an increase in pt_CNT of 2.7 MPa as the frequency was increased from 345 kHz to 3 MHz (o). Comparisons to the average experimental results for pint in agarose tissue phantoms (◆) demonstrate close agreement between theory and experiments.
Discussion
In previous studies, stiffer tissues had increased resistance to histotripsy fractionation and required a higher pressure threshold to generate a cavitation cloud via the shock scattering method (Vlaisavljevich et al. 2014a; Vlaisavljevich et al. 2014b). In this study, the effects of tissue stiffness on the histotripsy intrinsic threshold were investigated, with results supporting our hypothesis that the intrinsic threshold is independent of tissue stiffness. At all frequencies tested, no noticeable trend of increasing threshold was observed for phantoms and tissues with Young’s moduli <1 MPa, and only a small increase was observed for tendon (E=380 MPa). The observed increase for tendon was also small (~2–3 MPa) in comparison to previously measured differences between water-based and non-water based media such as 1,3 butanediol or adipose tissue, which resulted in a ~5–10 MPa change in the intrinsic threshold (Maxwell et al. 2013).
The finding that the intrinsic threshold is independent of tissue stiffness is of significant importance to the development of histotripsy therapy. As suggested by Maxwell et al, the intrinsic threshold approach has the potential to create a more predictive and reliable histotripsy therapy (Maxwell et al. 2013; Lin et al. 2014c). In this study, we show that, using the intrinsic threshold method, histotripsy bubbles can be reliably generated at the same pressure in many tissue types. As a result, initiating cavitation above the intrinsic threshold appears to be much more predictable than using shock scattering, which has been shown to require higher pressure to generate a bubble cloud in stiffer tissues (Vlaisavljevich et al. 2014b). For the same reasons, the intrinsic threshold approach is also more predictable and reproducible than cavitation initiation using longer pulses or adding contrast agents, even though these methods can lower cavitation threshold (Fowlkes and Crum 1988; Holland and Apfel 1990; Miller and Thomas 1995; Carstensen et al. 2000; Kyriakou et al. 2011). It should be noted, however, that stiffer tissues may remain resistant to histotripsy fractionation even in cases when a bubble cloud has been generated due to impeded bubble expansion as well as the higher ultimate stress and ultimate strain of these tissues (Vlaisavljevich et al. 2013b; Vlaisavljevich et al. 2014a; Vlaisavljevich et al. 2014c). It is likely that the decrease in bubble expansion in stiffer tissues, which were observed in this study, will result in a decrease in the rate and extent of tissue fractionation even in cases when a bubble cloud has been initiated. As a result, using lower frequency may be necessary to facilitate bubble expansion for the treatment of stiffer tissues.
In addition to tissue stiffness, this work investigated the effects of frequency on the intrinsic threshold, with the results showing a small increase of ~2–3 MPa when the frequency was increased from 345 kHz to 3 MHz, which covers the range frequently used for histotripsy therapy. Since the intrinsic threshold was observed to be nearly independent of frequency for the histotripsy therapy range, treatment optimization strategies can instead focus on other considerations such as the desired bubble expansion, the optimal focal zone, or the available acoustic window required for the treatment of specific tissues. For example, the larger focal zone at lower frequency may be utilized in instances when large volume ablation is desired, such as the removal of large tumors in the liver (Vlaisavljevich et al. 2013b). On the other hand, higher frequency may provide a smaller focal zone for treatments in which high precision is required such as the removal of blood clots in deep vein thrombosis or stroke (Maxwell et al. 2009).
Another observation that may help guide histotripsy parameter optimization is the finding that “incidental cavitation bubbles” formed below the intrinsic threshold are more likely to be generated at lower frequency, which was observed in 90% O2 water at 345 kHz and 500 kHz (Fig. 5). This finding suggests that using higher frequency will reduce the risk of collateral damage outside the treatment region by minimizing “incidental bubbles” formed in these external locations, which was previously observed in a study comparing histotripsy fractionation at 500 kHz and 3 MHz (Lin et al. 2014a). Additionally, this finding suggests that lower frequency may enhance the shock scattering process which relies on cavitation generation from incidental bubbles and the expansion of these initial bubbles, both of which were enhanced at lower frequency in this study.
In the final part of this study, two models were used to provide some insight into the “intrinsic nuclei” population. First, a stable bubble model was used, predicting a threshold that was independent of tissue stiffness for Young’s moduli <1 MPa. However, the model was inaccurate for Young’s moduli >1 MPa and couldn’t accurately predict the threshold in tendon. This result, along with the experimental observation that the intrinsic threshold in tissue is similar to the intrinsic threshold of water, suggests that nucleation actually occurs in the water inside tissue where the Young’s modulus is negligible. If this is true, the Young’s modulus would only affect macroscopic bubble motion but would not impact the initial bubble behavior. This would explain why the model is inaccurate for large Young’s moduli since it models homogeneous bulk tissue properties down to very small sizes that do not reflect actual tissue conditions at the nanoscopic scale (i.e. porosity, anisotropy). The stable bubble model further showed that the cavitation threshold was independent of frequency for the range tested for a 2.5 nm initial bubble and predicted that the thresholds measured in experiments (24.7–30.6 MPa) corresponded to initial bubble sizes between 2.3–2.85 nm. While this analysis may shed some light on the possible size range of stable nuclei in tissue, it is unlikely that the changes in threshold with frequency are due to changes in nuclei size since the same samples were exposed for all frequencies. It is more likely that the decrease in threshold at lower frequency is due to the larger focal volume and increased duration of the applied pressure, as predicted by the CNT model. The change in threshold predicted by CNT closely matched experimental results in the present study, as well as in Arvengas et al (Arvengas et al. 2011a), who measured the cavitation probability between 1–2 MHz. Comparing the effects of frequency predicted by CNT and the stable bubble model suggests that the intrinsic threshold generates bubbles from spontaneous nuclei within the water inside tissue. However, while these results provide some insight into the potential intrinsic nuclei population, future work is still needed to conclusively determine whether the intrinsic nuclei are actually spontaneous nuclei described by classical nucleation theory, nanometer sized stabilized gas nuclei, or if a more advanced microscopic model is needed in order to describe these nuclei.
Conclusion
In this study, the effects of tissue stiffness and ultrasound frequency on the histotripsy intrinsic threshold were investigated by applying 1–2 cycle histotripsy pulses to mechanically tunable tissue phantoms and ex vivo bovine tissues using 345 kHz, 500 kHz, 1.5 MHz, and 3 MHz histotripsy transducers. Results demonstrated that the histotripsy intrinsic threshold is independent of stiffness for tissue phantoms and soft tissues with Young’s moduli <1 MPa, with only a small increase in the intrinsic threshold observed for tendon (E=380 MPa). Results further showed only a small increase in the intrinsic threshold of ~2–3 MPa when the frequency was increased from 345 kHz to 3 MHz. Overall, the results of this study suggest that the intrinsic threshold approach is predictable and reproducible in initiating cavitation, regardless of the tissue types and frequency used.
Acknowledgments
This material is based upon work supported by a National Science Foundation Graduate Research Fellowship. This work was supported by grants from National Institute of Biomedical Imaging And Bioengineering (NIBIB) of the National Institutes of Health under Award Number R01EB008998, a Research Scholar Grant from the American Cancer Society (RSG-13-101-01-CCE), a National Science Foundation Grant (CBET 1253157), The Hartwell Foundation, and Focused Ultrasound Foundation. Disclosure notice: Drs. Charles Cain, J. Brian Fowlkes, and Zhen Xu have financial interests and/or other relationship with HistoSonics Inc.
Footnotes
Publisher's Disclaimer: This is a PDF file of an unedited manuscript that has been accepted for publication. As a service to our customers we are providing this early version of the manuscript. The manuscript will undergo copyediting, typesetting, and review of the resulting proof before it is published in its final citable form. Please note that during the production process errors may be discovered which could affect the content, and all legal disclaimers that apply to the journal pertain.
References
- Arvengas A, Davitt K, Caupin F. Fiber optic probe hydrophone for the study of acoustic cavitation in water. Rev Sci Instrum. 2011a;82:034904. doi: 10.1063/1.3557420. [DOI] [PubMed] [Google Scholar]
- Arvengas A, Herbert E, Cersoy S, Davitt K, Caupin F. Cavitation in heavy water and other liquids. J Phys Chem B. 2011b;115:14240–5. doi: 10.1021/jp2050977. [DOI] [PubMed] [Google Scholar]
- Balgude AP, Yu X, Szymanski A, Bellamkonda RV. Agarose gel stiffness determines rate of DRG neurite extension in 3D cultures. Biomaterials. 2001;22:1077–84. doi: 10.1016/s0142-9612(00)00350-1. [DOI] [PubMed] [Google Scholar]
- Blake FG. Gas Bubbles as Cavitation Nuclei. Physical Review. 1949;75:1313. [Google Scholar]
- Briggs LJ. The Limiting Negative Pressure of Water between 0-Degrees-C and 50-Degrees-C. Science. 1950;111:461. [Google Scholar]
- Bunkin NF, Suyazov NV, Shkirin AV, Ignat’ev PS, Indukaev KV. Cluster structure of stable dissolved gas nanobubbles in highly purified water. Journal of Experimental and Theoretical Physics. 2009;108:800–16. [Google Scholar]
- Carstensen EL, Gracewski S, Dalecki D. The search for cavitation in vivo. Ultrasound Med Biol. 2000;26:1377–85. doi: 10.1016/s0301-5629(00)00271-4. [DOI] [PubMed] [Google Scholar]
- Caupin F, Herbert E. Cavitation in water: a review. Cr Phys. 2006;7:1000–17. [Google Scholar]
- Diem KLC. Documenta Geigy scientific tables. 7. Macclesfield; 1970. [Google Scholar]
- Duck FA. Physical properties of tissue: a comprehensive reference book. Academic Press; 1990. [Google Scholar]
- Fisher JC. The Fracture of Liquids. Journal of Applied Physics. 1948;19:1062–7. [Google Scholar]
- Fowlkes JB, Crum LA. Cavitation threshold measurements for microsecond length pulses of ultrasound. J Acoust Soc Am. 1988;83:2190–201. doi: 10.1121/1.396347. [DOI] [PubMed] [Google Scholar]
- Freund JB. Suppression of shocked-bubble expansion due to tissue confinement with application to shock-wave lithotripsy. J Acoust Soc Am. 2008;123:2867–74. doi: 10.1121/1.2902171. [DOI] [PMC free article] [PubMed] [Google Scholar]
- Greenspan M, Tschiegg CE. Radiation-Induced Acoustic Cavitation - Threshold Versus Temperature for Some Liquids. Journal of the Acoustical Society of America. 1982;72:1327–31. [Google Scholar]
- Hall TL, Kieran K, Ives K, Fowlkes JB, Cain CA, Roberts WW. Histotripsy of rabbit renal tissue in vivo: temporal histologic trends. J Endourol. 2007;21:1159–66. doi: 10.1089/end.2007.9915. [DOI] [PubMed] [Google Scholar]
- Harvey EN, Barnes DK, McElroy WD, Whiteley AH, Pease DC, Cooper KW. Bubble formation in animals I. Physical factors Journal of Cellular and Comparative Physiology. 1944;24:1–22. [Google Scholar]
- Herbert E, Balibar S, Caupin F. Cavitation pressure in water. Physical Review E. 2006:74. doi: 10.1103/PhysRevE.74.041603. [DOI] [PubMed] [Google Scholar]
- Holland CK, Apfel RE. Thresholds for transient cavitation produced by pulsed ultrasound in a controlled nuclei environment. J Acoust Soc Am. 1990;88:2059–69. doi: 10.1121/1.400102. [DOI] [PubMed] [Google Scholar]
- Hosmer DW, Lemeshow S. Confidence interval estimation of interaction. Epidemiology. 1992;3:452–6. doi: 10.1097/00001648-199209000-00012. [DOI] [PubMed] [Google Scholar]
- ICRP. Report of the Task Group on Reference Man : a report. Oxford, New York: Pergamon Press; 1975. [Google Scholar]
- ICRU. Intl Commission on Radiation. 1989. Tissue Substitutes in Radiation Dosimetry and Measurement. [Google Scholar]
- Keller JB, Miksis M. Bubble Oscillations of Large-Amplitude. Journal of the Acoustical Society of America. 1980;68:628–33. [Google Scholar]
- Kyriakou Z, Corral-Baques MI, Amat A, Coussios CC. HIFU-induced cavitation and heating in ex vivo porcine subcutaneous fat. Ultrasound Med Biol. 2011;37:568–79. doi: 10.1016/j.ultrasmedbio.2011.01.001. [DOI] [PubMed] [Google Scholar]
- Leighton TG. The acoustic bubble. Academic Press; San Diego: 1994. [Google Scholar]
- Lin KW, Duryea AP, Kim Y, Hall TL, Xu Z, Cain CA. Dual-beam histotripsy: a low-frequency pump enabling a high-frequency probe for precise lesion formation. IEEE Trans Ultrason Ferroelectr Freq Control. 2014a;61:325–40. doi: 10.1109/TUFFC.2014.6722617. [DOI] [PMC free article] [PubMed] [Google Scholar]
- Lin KW, Hall TL, McGough RJ, Xu Z, Cain CA. Synthesis of Monopolar Ultrasound Pulses for Therapy: The Frequency-Compounding Transducer. Ieee Transactions on Ultrasonics Ferroelectrics and Frequency Control. 2014b;61:1123–36. doi: 10.1109/TUFFC.2014.3012. [DOI] [PubMed] [Google Scholar]
- Lin KW, Kim Y, Maxwell AD, Wang TY, Hall TL, Xu Z, Fowlkes JB, Cain CA. Histotripsy beyond the intrinsic cavitation threshold using very short ultrasound pulses: microtripsy. IEEE Trans Ultrason Ferroelectr Freq Control. 2014c;61:251–65. doi: 10.1109/TUFFC.2014.6722611. [DOI] [PMC free article] [PubMed] [Google Scholar]
- Maxwell AD, Cain CA, Duryea AP, Yuan L, Gurm HS, Xu Z. Noninvasive thrombolysis using pulsed ultrasound cavitation therapy - histotripsy. Ultrasound Med Biol. 2009;35:1982–94. doi: 10.1016/j.ultrasmedbio.2009.07.001. [DOI] [PMC free article] [PubMed] [Google Scholar]
- Maxwell AD, Cain CA, Fowlkes JB, Xu Z. Inception of Cavitation Clouds by Scattered Shockwaves. IEEE Ultrasonics Symposium; 2010. pp. 3B–2. [Google Scholar]
- Maxwell AD, Cain CA, Hall TL, Fowlkes JB, Xu Z. Probability of cavitation for single ultrasound pulses applied to tissues and tissue-mimicking materials. Ultrasound Med Biol. 2013;39:449–65. doi: 10.1016/j.ultrasmedbio.2012.09.004. [DOI] [PMC free article] [PubMed] [Google Scholar]
- Maxwell AD, Wang TY, Cain CA, Fowlkes JB, Sapozhnikov OA, Bailey MR, Xu Z. Cavitation clouds created by shock scattering from bubbles during histotripsy. Journal of the Acoustical Society of America. 2011a;130:1888–98. doi: 10.1121/1.3625239. [DOI] [PMC free article] [PubMed] [Google Scholar]
- Maxwell AD, Wang TY, Cain CA, Fowlkes JB, Sapozhnikov OA, Bailey MR, Xu Z. Cavitation clouds created by shock scattering from bubbles during histotripsy. J Acoust Soc Am. 2011b;130:1888–98. doi: 10.1121/1.3625239. [DOI] [PMC free article] [PubMed] [Google Scholar]
- Miller DL, Thomas RM. Ultrasound Contrast Agents Nucleate Inertial Cavitation in-Vitro. Ultrasound Med Biol. 1995;21:1059–65. doi: 10.1016/0301-5629(95)93252-u. [DOI] [PubMed] [Google Scholar]
- Parsons JE, Cain CA, Abrams GD, Fowlkes JB. Pulsed cavitational ultrasound therapy for controlled tissue homogenization. Ultrasound Med Biol. 2006a;32:115–29. doi: 10.1016/j.ultrasmedbio.2005.09.005. [DOI] [PubMed] [Google Scholar]
- Parsons JE, Cain CA, Fowlkes JB. Cost-effective assembly of a basic fiber-optic hydrophone for measurement of high-amplitude therapeutic ultrasound fields. J Acoust Soc Am. 2006b;119:1432–40. doi: 10.1121/1.2166708. [DOI] [PubMed] [Google Scholar]
- Parsons JE, Cain CA, Fowlkes JB. Spatial variability in acoustic backscatter as an indicator of tissue homogenate production in pulsed cavitational ultrasound therapy. IEEE Trans Ultrason Ferroelectr Freq Control. 2007;54:576–90. doi: 10.1109/tuffc.2007.280. [DOI] [PubMed] [Google Scholar]
- Pettersen MS, Balibar S, Maris HJ. Experimental investigation of cavitation in superfluid 4He. Phys Rev B Condens Matter. 1994;49:12062–70. doi: 10.1103/physrevb.49.12062. [DOI] [PubMed] [Google Scholar]
- Pishchalnikov YA, McAteer JA, Williams JC., Jr Effect of firing rate on the performance of shock wave lithotriptors. BJU Int. 2008;102:1681–6. doi: 10.1111/j.1464-410X.2008.07896.x. [DOI] [PMC free article] [PubMed] [Google Scholar]
- Roberts WW, Hall TL, Ives K, Wolf JS, Jr, Fowlkes JB, Cain CA. Pulsed cavitational ultrasound: a noninvasive technology for controlled tissue ablation (histotripsy) in the rabbit kidney. J Urol. 2006;175:734–8. doi: 10.1016/S0022-5347(05)00141-2. [DOI] [PubMed] [Google Scholar]
- Roy RA, Madanshetty SI, Apfel RE. An Acoustic Backscattering Technique for the Detection of Transient Cavitation Produced by Microsecond Pulses of Ultrasound. Journal of the Acoustical Society of America. 1990;87:2451–8. doi: 10.1121/1.399091. [DOI] [PubMed] [Google Scholar]
- Sankin GN, Teslenko VS. Two-threshold cavitation regime. Doklady Physics. 2003;48:665–8. [Google Scholar]
- Staubli HU, Schatzmann L, Brunner P, Rincon L, Nolte LP. Mechanical tensile properties of the quadriceps tendon and patellar ligament in young adults. Am J Sports Med. 1999;27:27–34. doi: 10.1177/03635465990270011301. [DOI] [PubMed] [Google Scholar]
- Ulrich TA, Jain A, Tanner K, MacKay JL, Kumar S. Probing cellular mechanobiology in three-dimensional culture with collagen-agarose matrices. Biomaterials. 2010;31:1875–84. doi: 10.1016/j.biomaterials.2009.10.047. [DOI] [PubMed] [Google Scholar]
- Vlaisavljevich E, Durmaz YY, Maxwell A, Elsayed M, Xu Z. Nanodroplet-mediated histotripsy for image-guided targeted ultrasound cell ablation. Theranostics. 2013a;3:851–64. doi: 10.7150/thno.6717. [DOI] [PMC free article] [PubMed] [Google Scholar]
- Vlaisavljevich E, Kim Y, Allen S, Owens G, Pelletier S, Cain C, Ives K, Xu Z. Image-guided non-invasive ultrasound liver ablation using histotripsy: feasibility study in an in vivo porcine model. Ultrasound Med Biol. 2013b;39:1398–409. doi: 10.1016/j.ultrasmedbio.2013.02.005. [DOI] [PMC free article] [PubMed] [Google Scholar]
- Vlaisavljevich E, Kim Y, Owens G, Roberts W, Cain C, Xu Z. Effects of tissue mechanical properties on susceptibility to histotripsy-induced tissue damage. Phys Med Biol. 2014a;59:253–70. doi: 10.1088/0031-9155/59/2/253. [DOI] [PMC free article] [PubMed] [Google Scholar]
- Vlaisavljevich E, Maxwell A, Warnez M, Johnsen E, Cain CA, Xu Z. Histotripsy-induced cavitation cloud initiation thresholds in tissues of different mechanical properties. IEEE Trans Ultrason Ferroelectr Freq Control. 2014b;61:341–52. doi: 10.1109/TUFFC.2014.6722618. [DOI] [PMC free article] [PubMed] [Google Scholar]
- Woodard HQ, White DR. The composition of body tissues. Br J Radiol. 1986;59:1209–18. doi: 10.1259/0007-1285-59-708-1209. [DOI] [PubMed] [Google Scholar]
- Xu Z, Fowlkes JB, Rothman ED, Levin AM, Cain CA. Controlled ultrasound tissue erosion: the role of dynamic interaction between insonation and microbubble activity. J Acoust Soc Am. 2005;117:424–35. doi: 10.1121/1.1828551. [DOI] [PMC free article] [PubMed] [Google Scholar]
- Xu Z, Raghavan M, Hall TL, Chang CW, Mycek MA, Fowlkes JB, Cain CA. High speed imaging of bubble clouds generated in pulsed ultrasound cavitational therapy--histotripsy. IEEE Trans Ultrason Ferroelectr Freq Control. 2007;54:2091–101. doi: 10.1109/TUFFC.2007.504. [DOI] [PMC free article] [PubMed] [Google Scholar]
- Yamada H. Strength of biologic materials. New York: Robert E. Kreiger; 1973. [Google Scholar]
- Yang X, Church CC. A model for the dynamics of gas bubbles in soft tissue. J Acoust Soc Am. 2005;118:3595–606. doi: 10.1121/1.2118307. [DOI] [PubMed] [Google Scholar]
- Yount DE. Skins of Varying Permeability - Stabilization Mechanism for Gas Cavitation Nuclei. Journal of the Acoustical Society of America. 1979;65:1429–39. [Google Scholar]
- Zhong P, Cioanta I, Zhu SL, Cocks FH, Preminger GM. Effects of tissue constraint on shock wave-induced bubble expansion in vivo. Journal of the Acoustical Society of America. 1998;104:3126–9. doi: 10.1121/1.423905. [DOI] [PubMed] [Google Scholar]