

Abstract
Osteoporosis is a skeletal disorder attributable to an imbalance in osteoblast and osteoclast activity. NELL-1, a secretory protein that promotes osteogenesis while suppressing osteoclastic activity, holds potential as an osteoporosis therapy. Recently, we demonstrated that PEGylation of NELL-1 significantly improves its thermostability while preserving its bioactivity in vitro. However, the effect of PEGylation on the pharmacokinetics and osteogenic potential of NELL-1 in vivo have yet to be investigated. The present study demonstrated that PEGylation of NELL-1 significantly increases the elimination half-life time of the protein from 5.5h to 15.5h while distributing more than 2–3 times the amount of protein to bone tissues (femur, tibia, vertebrae, calvaria) in vivo when compared to naked NELL-1. In addition, microCT and DXA analyses demonstrated that systemic NELL-PEG therapy administered every 4 or 7 days significantly increases not only femoral and lumbar BMD and percent bone volume, but also new bone formation throughout the overall skeleton after four weeks of treatment. Furthermore, immunohistochemistry revealed increased osteocalcin expression, while TRAP staining showed reduced osteoclast numbers in NELL-PEG groups. Our findings suggest that the PEGylation technique presents a viable and promising approach to further develop NELL-1 into an effective systemic therapeutic for the treatment of osteoporosis.
Keywords: NELL-1, PEGylation, Pharmacokinetics, Osteogenesis, Osteoporosis
1. INTRODUCTION
Osteoporosis, the most common metabolic bone disease, affects over 200 million people worldwide with 10 million people affected in the United States alone [1–6]. Therapeutic approaches to osteoporotic bone loss have focused thus far on either anabolic or antiresorptive agents [7, 8] with only one anabolic agent, parathyroid hormone (PTH), approved by the Food and Drug Administration (FDA) for the temporary treatment of osteoporosis. To address the pressing need for new therapies that are both anabolic and anti-osteoclastic [7, 9–11], promising new agents that increase Wnt/β-catenin activity are in development. Wnt/β-catenin signaling plays a key role in directing stem cell differentiation to osteoblasts and in inhibiting osteoclast activity [12, 13]. In addition, decreased Wnt/β-catenin signaling has been implicated in osteoporosis [14, 15]. However, because recombinant Wnts are difficult to produce and deliver, most approaches to increase Wnt/β-catenin signaling involve the blockade of naturally occurring Wnt antagonists via antibodies (e.g., anti-DKK1 or anti-Sclerostin antibodies) [12, 13] to functionally ‘de-repress’ Wnt signaling.
NEL-like molecule-1 (NELL-1), a unique secretory molecule, was first implicated in bone formation by its overexpression in human craniosynostosis [16]. Specifically, NELL-1 is a 700kDa protein recognized as a potent pro-osteogenic cytokine and was most often studied for its local bone-forming effects [17–24]. NELL-1 has been reported to induce robust osseous healing of critical-sized rat femoral segmental and calvarial defects [17, 25, 26], and also to promote lumbar spinal fusion in rats, sheep [21–23], and non-human primates. Additionally, NELL-1 has been identified not only to demonstrate anti-osteoclastic effects both in vitro and in vivo [19], but also to suppress adipogenesis [27]. Recently, a genome-wide linkage study identified NELL-1 polymorphisms in patients with reduced bone mineral density [28], thus describing an association between NELL-1 and osteoporosis. In accordance with this, our preliminary studies indicated that NELL-1, like Wnt/β-catenin, also acts as a combined anabolic and anti-osteoclastic agent to protect against osteoporotic bone loss. Not only are Nell-1 haploinsufficient mice more prone to osteoporosis, but also the local intramedullary delivery of NELL-1 reverses osteoporotic bone loss in both small (rat) and large (sheep) animal models [20, 29]. Excitingly, we have recently determined that NELL-1 effects occur in large part via activation of Wnt/β-catenin signaling [19] and that systemically delivered NELL-1 potently reverses ovariectomy (OVX)-induced bone loss in mice; however, a relatively frequent administration schedule was required (q2d; 3–4 doses/week) due to the rapid clearance of the native protein [29]. Resultantly, the short circulation time of NELL-1 in vivo was deemed as one of the main limitations for its practical application as a systemic therapy. Therefore, one of the main purposes of the present study was to improve the pharmacokinetics of NELL-1 by structural modification in order to extend its circulation time in vivo.
One of the most biocompatible technologies to prolong the half-life of a protein is to use water-soluble polyethylene glycol (PEG) polymers as macromolecular carriers. PEGylation, the chemical process of modifying a molecule’s physiologic and pharmacokinetic characteristics using PEGs, has demonstrated to be both effective and non-toxic [30–33]. Thus far, the FDA has approved 10 marketed PEGylated therapies [33]. PEGylation of a protein not only prolongs its half-life, but also reduces its injection frequency by consequence of extending circulation time in vivo. Seeking to reduce the injection frequency of NELL-1, we previously used PEGylation technology to enhance the systemic pharmacokinetics of NELL-1 [34]. Three different PEGylated types of NELL-1 (5K-linear, 20K-linear, and 40K-branched) were tested, each demonstrating an increased thermostability and a maintained bioactivity in vitro in mouse osteoblast cells and human adipose-derived perivascular stem cells (hPSCs) compared to naked NELL-1 [34]. Importantly, the levels of PEGylated NELL-1 were found to remain significantly higher compared to naked NELL-1 at 24 hours in vivo. As a result, these findings brought PEGylated NELL-1 to the forefront alongside other combined anabolic and antiresorptive agents currently in development such as anti-DKK1 or anti-Sclerostin, both of which are injected every 4 days [35].
In the current study, we investigated the pharmacokinetics of PEGylated NELL-1 in vivo and its resultant osteogenic effect in mice. Previously, we tested three different PEGylation types of NELL-1 (NELL-PEG-5k, NELL-PEG-20k and NELL-PEG-40k) and determined NELL-PEG-5k to be the most optimal type of PEGylation for this in vivo study [34]. Thus, in the present study, we examined the osteogenic potential of systemically administered PEGylated NELL-1 (NELL-PEG-5k) compared to naked NELL-1 and a carrier control. In the following text, NELL-PEG refers to NELL-PEG-5k if not mentioned otherwise. Given that the systemic anti-osteoporosis therapeutics currently in development (e.g., anti-DKK1, anti-Sclerostin antibodies) are administered q4d (2 doses/week) [35], we sought to examine the osteogenic potential of NELL-PEG administered at every 4 days and every 7 days (q4d and q7d). Specifically, we aimed to (1) evaluate the pharmacokinetics of NELL-PEG in comparison to naked NELL-1 and a control group in vivo, and then (2) investigate the systemic osteogenic capacity of NELL-PEG when administered at q4d or q7d in vivo. The significance and novelty of the present study is that, upon success, we could develop an efficacious approach to deliver NELL-1 as a growth factor-based systemic osteogenic therapy.
2. MATERIALS AND METHODS
Animals
All animals were handled in accordance with the institutional guidelines of the Chancellor’s Animal Research Committee (ARC) of the Office for Protection of Research Subjects at the University of California, Los Angeles. Animals were housed in a light- and temperature- controlled environment and given food and water ad libitum.
2.1. Pharmacokinetic (PK) study
2.1.1 Preparation of NELL-PEG
NELL-PEG was synthesized using linear PEG 5k (Sigma-Aldrich, USA) according to our previous paper [34]. Briefly, 10 μl of 62.5 mg/mL PEG 5k was added into 250 μl of NELL-1 solution (2.0 mg/mL, pH6.5), and the mixture was stirred for 12 h at 4 °C under 300 rpm. The obtained NELL-PEG was purified by loading the mixture onto a Sephadex G-25M column (Sigma-Aldrich, USA), then eluting the column with 3.0 mL of PBS solution (1×, pH 7.4), and collecting the fractions (0.25 mL/fraction) that mainly consisted of NELL-PEG determined by GPC method. A 24 h dialysis against distilled water was performed using dialysis cassettes (MWCO 100 KDa, Fisher, USA) to remove any unreacted PEG molecules.
2.1.2 Preparation of FITC- labeled protein
NELL-1 and PEGylated NELL-1 were labeled with fluorescein isothiocyanate (FITC) according to our previous paper [34]. FITC (Sigma Aldrich, MO) and either NELL-PEG or NELL-1 (4 mg/mL) were reacted at a 50:1 molar ratio in a 0.1 M sodium carbonate-bicarbonate buffer (pH 9.0) for 3 h at room temperature under magnetic stirring at 250 rpm. The FITC-tagged protein was then separated and purified.
2.1.3 Pharmacokinetic study
3-month-old female CD-1 mice (Charles River Laboratories, MA) were used for the PK study. The mice were randomly divided into 2 groups (n=6/group): a FITC-NELL-1 group and a FITC-NELL-PEG group. The mice in each group were intravenously administered 100 μl of sterile solution via the lateral tail vein at a dose of 1.25 mg protein/kg mouse weight (based on protein content). Blood samples were drawn retro-orbitally and collected in a serum separator tube at a series of time-points post-injection (0.5, 1, 4, 8, 12, 24, 36 h). The serum was then separated and the concentrations of FITC-NELL-1 and FITC-NELL-PEG measured by a plate reader (Infinite F200, Tecan Group Ltd., Switzerland). To be protected from light during the sampling process, the tubes of blood and serum were wrapped with aluminum foil. PK parameters were calculated based on individual animal concentrations using the kinetica program. The data were fitted to a two-compartment model and the pharmacokinetic parameters were calculated from the proposed model.
2.1.4 Preparation of VivoTag- labeled protein
NELL-1 and NELL-PEG were labeled with VivoTag 680XL (PerkinElmer, MA) for a biodistribution study. 30 μl of VivoTag 680XL (10 mg/mL in DMSO) and either 0.5 mL of NELL-1 or NELL-PEG (2 mg/mL based on protein content) were reacted in a 50 mM sodium carbonate-bicarbonate buffer (pH 8.5) at room temperature for 3 h under magnetic stirring at 250 rpm. The VivoTag 680XL-tagged NELL-1 was then separated from unreacted VivoTag 680XL by filtration chromatography through a Sephadex G-25 column. Next, the fractions containing VivoTag-NELL-1 or VivoTag-NELL-PEG were collected and pooled. The vial of labeled protein was wrapped with aluminum foil to be protected from light and stored at -80 °C before use.
2.1.5 Biodistribution study
For the protein biodistribution study, 3-month-old female CD-1 mice (Charles River Laboratories, MA) were randomly divided into 3 groups (n=3/group): a NELL-PEG group, a NELL-1 group, and a control group (PEG). The mice in each group were administered with a single, 100 μl IV bolus dose via the lateral tail vein at a dose of 1.25 mg/kg (based on protein content) for NELL-PEG and NELL-1 groups and at a dose of 1.52 mg/kg for the PEG group (equal to the PEG amount in the NELL-PEG dose). At 48 h post-treatment, the mice were sacrificed and the organs (liver, kidney, spleen, heart, lungs, brain, muscle, fat, ovary, calvaria, vertebrae, tibia, and femurs) were harvested and imaged using the IVIS Lumina II optical imaging system (Caliper Life Sciences, MA). Special care was taken during dissection to avoid cross-contamination. The organs were weighed and the data were plotted as fluorescence efficiency per gram of tissue weight.
2.2. Systemic osteogenicity study (q4d vs. q7d)
2.2.1 NELL-PEG intravenous injection in mice
To investigate the osteogenic capacity of systemically administered NELL-PEG, 3-month-old female C57BL/6 mice (n=19, mean body weight 20g, Jackson Laboratory, ME) were used. The mice were randomly divided into 3 groups: a PBS/PEG control (q4d, n=3) group, a NELL-PEG (q4d, n=8) group, and a NELL-PEG (q7d, n=8) group. Then, the mice were intravenously injected with 100 μl of PBS/PEG or NELL-PEG via the lateral tail veins at a q4d or q7d dosing interval over a 4-week experimental period. The type of PEG (linear 5 KDa) for NELL-PEG and the optimal doses for PBS/PEG (1.52 mg/kg) and NELL-PEG (1.25 mg/kg) were determined according to our previous studies [29, 34].
2.2.2 In vivo bone densitometry by DXA
To monitor bone mineral density (BMD), dual-energy X-ray absorptiometry (DXA) scans were performed weekly using a Lunar PIXImus II densitometer (GE Lunar, WI). Under isoflurane anesthesia, all animals were positioned prone on the imaging pad with the femurs parallel to the direction of the scan and the knee joints flexed at a right angle. Areal BMD was determined with rectangular regions-of-interest (ROIs) placed on distal femurs and lumbar vertebrae (L6) using image analysis software (version 2.10) provided by the manufacturer.
2.2.3 In vivo microPET/CT bone scan using [18F] fluoride ion
To monitor the overall bone metabolic activity, [18F] fluoride ion bone scanning was performed weekly using micro positron emission tomography (microPET) and correlated with anatomical imaging using micro-computed tomography (microCT) at the UCLA Crump Institute for Molecular Imaging. [18F] localization in the skeleton is dependent on regional blood flow, as well as on new bone formation. [18F] is substituted for hydroxyl groups in hydroxyapatite and covalently bonds to the surface of new bone; thus, uptake is higher in new bone (osteoid) because of the greater availability of binding sites. In brief, [18F] fluoride ion was produced at specific activities of approximately 1,000 Ci/mmol using 18O-labeled water and proton bombardment with a RDS cyclotron (Siemens Medical Solutions USA, Inc., TN). Mice were injected with [18F] fluoride ion (less than 200 μCi) via the lateral tail vein and kept anesthetized with isoflurane during radioactive probe uptake and clearance for 1 hour, followed by microPET (FOCUS 220 system; Siemens Medical Solutions USA, Inc., TN) and microCT (microCAT II; Siemens Medical Solutions USA, Inc., TN) combination scans lasting 20 minutes. All animals were imaged within ARC-approved rodent imaging chambers to minimize positioning errors during co-registration between microPET and microCT images. MicroPET images were reconstructed using a filtered back projection (FBP) and an iterative three-dimensional maximum a posteriori (MAP) reconstruction algorithm. To ensure the proper anatomical location of ROIs, microPET images were co-registered with the microCT images. Next, images were analyzed and quantified using AMIDE software (version 1.0.4). The mean tissue activity concentration (μCi/mL) of [18F] fluoride ions was determined by standardized cylindrical ROIs drawn on distal femurs and lumbar vertebrae, and normalized to the injected dose (μCi). Statistical analysis was performed in the distal femurs and terminal lumbar vertebral body, the most commonly examined bone sites.
2.2.4 Post-mortem high-resolution microCT evaluation
Animals were sacrificed at 4 weeks post-treatment and harvested for left and right femurs, tibias, humeri, and thoracic and lumbar vertebrae. Samples were fixed in 4% paraformaldehyde (PFA) for 48 hours and stored in 70% ethanol for microCT, histological, and immunohistochemical analyses. Femurs were scanned using a high-resolution microCT (SkyScan 1172, Bruker MicroCT N.V., Kontich, Belgium) at an image resolution of 27.4 μm (55 kV and 181 mA radiation source; 0.5-mm aluminum filter). Then, 3D images were reconstructed from the 2D X-ray projections by implementing the Feldkamp algorithm, and appropriate image corrections including ring artifact correction, beam hardening correction, and fine-tuning were processed using NRecon software (SkyScan 1172, Belgium). The dynamic image range (contrast limits) was determined at 0–0.1 in units of attenuation coefficient and applied to all datasets for optimum image contrast.
After acquisition and reconstruction of datasets, images were first reoriented on each 3D plane using DataViewer software (SkyScan 1172, Belgium) to align the long axis of the femur parallel to coronal and sagittal planes. Next, 3D morphometric analyses of the distal femur and the body of lumbar vertebrae were performed using CT-Analyzer software (SkyScan 1172, Belgium). For femurs, the length was divided into ten equal segments between the most proximal point of the growth plate and the proximal end of the third trochanter (1 mm length per segment). The trabecular region was defined as the first three distal segments to include secondary spongiosa in the distal metaphysis. Regions-of-interest (ROIs) were delineated using a freehand drawing tool while maintaining 3.5-pixel clearance from the endosteal surface. A clearance of 0.1 mm was maintained from the growth plate.
A global threshold of 60 (1.01573 g/cm3) was applied to all scans to extract a physiologically accurate representation of the trabecular bone phase. Morphometric parameters were then computed from the binarized images using direct 3D techniques (marching cubes and sphere-fitting methods), and included bone mineral density (BMD, g/cm3), percent bone volume (BV/TV, %), trabecular number (Tb.N, mm−1), trabecular thickness (Tb.Th, mm) and trabecular separation (Tb.Sp, mm). All quantitative and structural parameters followed the nomenclature and units recommended by the American Society for Bone and Mineral Research (ASBMR) Histomorphometry Nomenclature Committee [36]. After data quantification, 3D rendered images were generated to visualize the analyzed regions using the marching cubes method.
2.2.5 CFU-F assay, histology and immunohistochemical analyses
For the colony-forming unit-fibroblast (CFU-F) assay, freshly harvested left and right humeri were flushed to isolate bone marrow stem cells (BMSCs). Isolated marrow cells were seeded on 6-well plates (1×10⁶ cells/well), and cultured for 10 days in Complete MesenCult Medium (STEMCELL Technologies, Inc., Canada) at 37°C in 5% CO2. CFU-F-derived colonies were stained using Giemsa Staining Solution (EMD Chemicals, Inc., NJ) for 5 minutes and were counted under a microscope.
After microCT scans, the samples were decalcified using 19% EDTA solution for 14 days, dehydrated, and processed for paraffin embedding. Longitudinal sections of 5 μm thickness were cut on a microtome, and the slides were stained with hematoxylin and eosin (H&E), Trichrome, or with markers of osteoblast (osteocalcin: OCN) and osteoclast (tartrate-resistant acid phosphatase: TRAP) differentiation as previously described [37].
Histological and immunohistochemical specimens were analyzed using an Olympus BX51 microscope (Olympus Corporation, Japan) and photomicrographs were acquired using a MicroFire digital camera with PictureFrame software (Optronics, CA). OCN and TRAP staining were analyzed by three blinded observers and were quantified by the number of osteoblasts per trabecular bone perimeter (N.Ob/B.Pm, mm−1) and the number of osteoclasts per trabecular bone perimeter (N.Oc/B.Pm, mm−1), respectively. The reported results were the average of data obtained from six random fields per sample.
2.3. Statistical analysis
Means and standard deviations were calculated from numerical data. Statistical analyses were performed using one-way analysis of variance (ANOVA) test for multiple comparisons and Student’s t-test for two-group comparisons at 95% confidence levels. Data are presented as mean ± SD, with *P<0.05 and **P<0.01.
3. RESULTS
3.1 Pharmacokinetics study
3.1.1 Serum pharmacokinetics of NELL-1 and NELL-PEG in mice
The pharmacokinetic profile of NELL-1 and NELL-PEG were examined in 3-month-old CD-1 mice following an intravenous injection at a dose of 1.25 mg/kg (based on protein content). The protein in serum was quantified using a fluorescence-based protein assay. Fig.1 shows the concentration change of NELL-PEG and NELL-1 in serum over time after a single intravenous injection in mice. The serum concentration of NELL-1 was significantly increased at various time-points after PEGylation. The pharmacokinetic parameters derived from the serum profiles are shown in Table 1. Compared to naked NELL-1, the PEGylated NELL-1 had a significantly higher calculated peak blood concentration (Cmax). Specifically, the Cmax of NELL-PEG relative to the naked NELL-1 was about 158%. The protein serum concentration over time can be expressed as:
Figure 1. Mean serum concentration-time curves of naked NELL-1 and NELL-PEG-5k following an intravenous injection in mice.

A dose of 1.25mg/kg NELL-PEG tagged with FITC was injected into 6 mice by the tail vein, and blood samples were collected at a series of time points (0.5, 1, 4, 8, 12, 24, and 36h). The concentration of PEGylated NELL-1 was then analyzed by monitoring the fluorescence intensity of FITC using a plate reader. The study suggests that the PEGylated NELL-1 has a longer circulation time in mice compared to naked NELL-1.
Table 1. Pharmacokinetic parameters of NELL-1 and NELL-PEG-5k in mice.
The parameters were calculated based on the protein serum concentration at different time-points after injection. NELL-PEG-5k exhibited significant improvements in the elimination half-life time and maximum concentration in blood.
| Parameters | Dose (mg/kg) | K12 (h−1) | K21 (h−1) | K12/K21 | AUC(0–∞) (μg·h/mL) | Cmax (μg/mL) | Tl/2 α (h) | T1/2 β (h) | MRT (h) |
|---|---|---|---|---|---|---|---|---|---|
| NELL-1 | 1.25 | 0.73 | 0.28 | 2.61 | 13.35 | 9.62 | 0.43 | 5.52 | 5.00 |
| NELL-PEG-5k | 1.25 | 0.37 | 0.21 | 1.81 | 94.91 | 15.20 | 1.00 | 14.51 | 17.54 |
(AUC: area under the curve; Cmax: the calculated maximum concentration of protein; T1/2,α: distribution half-life time; T1/2β: elimination half-life time; K12, transfer coefficient from central compartment to peripheral compartment; K21, transfer coefficient of NELL-PEG from peripheral compartment to central compartment).
Where t is the time since the injection and CNELL-1 and CNELL-PEG-5k are the protein concentrations following a bolus dose. Accordingly, the total drug exposure (AUC), mean retention time (MRT), distribution half-life time (t1/2 α), and elimination half-life time (t1/2 β) of the NELL-PEG appeared longer as well. Compared to naked NELL-1, the relative AUC, MRT, t1/2 α, and t1/2 β of NELL-PEG were 710%, 263%, 233%, and 351%, respectively. In addition, the two transfer coefficients, K12 and K21, became smaller, indicating a slower transfer rate between central and peripheral compartments after PEGylation. The transfer coefficient of NELL-PEG from the central compartment to the peripheral compartment (K12) was only 51.4% of that for naked NELL-1, and the reverse transfer coefficient (K21) was 74.1% compared to that of naked NELL-1. Therefore, NELL-PEG presents a more potent NELL-1 type for in vivo pharmacological studies.
3.1.2 Biodistribution of NELL-1 and NELL-PEG in mice
Ex vivo biodistribution of NELL-1 and NELL-PEG were examined in CD-1 mice at 48 h. The protein was labeled with VivoTag 680XL first, and then administered to the mice at a dose of 1.25 mg/kg (based on protein content). The organs were collected at 48 h and imaged by the IVIS imaging system. The results are shown in Fig.2. The NELL-PEG group had significantly higher uptakes in some but not all of the tissues examined. The protein uptake in the heart, muscle, brain, spleen, fat, and ovary were similar for NELL-PEG and NELL-1, and the accumulation in these organs except the spleen was negligible compared to the other organs. At 48 h after IV injection, the spleen had the greatest uptake of NELL-1 whereas the liver had the greatest uptake of NELL-PEG. The uptake amount in the liver varied from 6.7±0.33 to 16.3±1.98 %ID/g before and after PEGylation, showing a significant difference. For the spleen tissue, the corresponding uptake values were 13.6±0.47 and 15.9±3.04 %ID/g, displaying no statistical difference. However, protein uptakes in the bones (calvaria, femur, tibia, vertebrae) were significantly increased after PEGylation. The amount of NELL-PEG in calvaria, femur, tibia, and vertebrae relative to NELL-1 were 294%, 181%, 229%, and 215%, respectively, showing greater NELL-PEG protein distribution to the bone target tissues.
Figure 2. Biodistribution of NELL-PEG-5k and NELL-1 labeled with VivoTag 680XL measured by IVIS Lumina II.
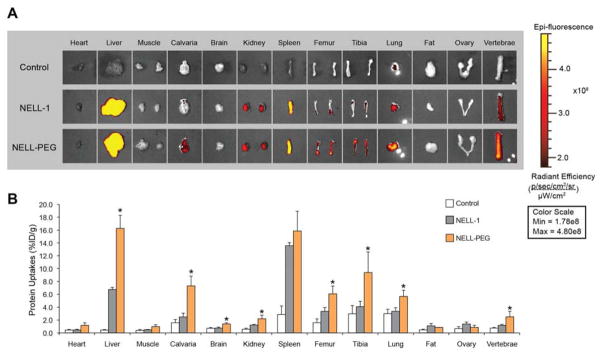
CD-1 mice (n = 3 per group) were administered intravenously with VivoTag-NELL-PEG-5k, VivoTag-NELL, or a saline control. Organs were imaged ex vivo at 48 hours post injection. (A) Ex vivo fluorescence images of the dissected organs were obtained using the IVIS imaging system. The gradient bar corresponds to the fluorescence intensity. (B) Various organs exhibited different uptakes of VivoTag-NELL-PEG-5k, VivoTag-NELL, and the saline control at 48 hours post tail vein injection. Ex vivo biodistribution confirmed that bones (calvaria, femurs, tibiae, and vertebrae) exhibited a greater retention of PEGylated NELL-1 than naked NELL-1 (*p<0.05).
3.2 Systemic osteogenic potential study (at q4d and q7d injection schedules)
3.2.1 In vivo bone densitometry
The BMD change in mice femurs and lumbar vertebrae were monitored weekly by DXA. Results were expressed as percent changes in areal BMD relative to the respective pre-treatment values at week 0. For the PBS/PEG control groups, BMD remained steady at baseline levels in distal femurs and lumbar vertebrae (L6) for the experimental period. In contrast, the NELL-PEG groups (both q4d and q7d) displayed a gradual and significant increase in BMD (16% and 11% respectively) of the distal femurs by 4 week post-treatment compared to the pre-treatment values but with no significant difference between the q4d and q7d groups (Fig. 3A). The lumbar vertebrae in both NELL-PEG groups exhibited increasing BMD relative to the baseline throughout the experiment. Interestingly, the q7d NELL-PEG group showed a greater BMD increment (11%) than the q4d NELL-PEG group (4%) at week 4. No significant difference in lumbar BMD was observed between the two experimental groups at week 4 (Fig. 3B).
Figure 3. Dual-energy X-ray absorptiometry (DXA) taken weekly to monitor bone mineral density (BMD) changes in femur and lumbar vertebrae.

(A) (Left) Femoral region-of-interest is shown as red box at distal metaphysis. (Right) At 4 weeks post treatment, femurs treated with q4d and q7d NELL-PEG showed a gradual and significant increase in BMD compared to their respective pre-treatment values. Both NELL-PEG groups also demonstrated statistically significant increases in femoral BMD compared to the PBS/PEG control, but with no considerable difference between each other (##p<0.01 for q4d NELL-PEG, **p<0.01 for q7d NELL-PEG). (B) (Left) Lumbar region-of-interest is shown as red box at L6 vertebral body. (Right) Lumbar vertebrae in both NELL-PEG groups exhibited increasing BMD relative to the baseline throughout the experiment, with greater BMD increments observed in the q7d NELL-PEG group than in the q4d NELL-PEG group. At week 4, lumbar vertebrae treated with q7d NELL-PEG showed significantly higher BMD increases than the vehicle group (*p<0.05 for q7d NELL-PEG). No significant difference in lumbar BMD was observed between the two experimental groups at week 4.
3.2.2 In vivo microPET/CT bone scan using [18F] fluoride ion
The physiological bone metabolic activity of the mouse skeleton was examined by weekly microPET/CT combination scans using [18F] fluoride ion. Qualitative analysis of live-microCT images revealed increased BMD in the NELL-PEG (q7d) group at the overall skeletal sites compared to control mice (data not shown). Live-[18F] microPET quantification data at each time-point were expressed as the percent of decay-corrected injected activity per cc of tissue (%ID/cc), using the formula shown in Fig. 4A, from which normalized mean values were then generated. MicroPET/CT revealed increased new bone formation in the NELL-PEG (q7d) group with higher activity distribution particularly near growth plate areas in the vertebral column, proximal humeri, proximal and distal femurs, and proximal tibias (Fig. 4A). The distal femur showed a significantly increased new bone formation after 4 weeks of treatment (Fig. 4B), and the terminal lumbar vertebra (L6) showed a mean increase in the NELL-PEG (q7d) group compared to control (data not shown).
Figure 4. Live-[18F]microPET/CT overlay imaging to assess bone metabolic rate.

(A) At 4 weeks of treatment, NELL-PEG (q7d) group exhibited an overall greater concentration of [18F] ion, particularly near growth plate areas in the proximal and distal femurs, proximal tibias, proximal humeri and in the vertebral bodies compared to control. Please note that the color intensity in the thoracic vertebrae is due to the overlap of the spinal curvature. (B) Quantitative assessment of [18F] uptake at the distal femur and the terminal lumbar vertebra (L6) was validated by statistical analysis of normalized mean values (%ID/cc). The distal femur showed a statistically significant percent increase of [18F] uptake at week 4 compared to week 0 (B; *p<0.05), and the L6 showed a mean increase in the NELL-PEG group compared to control (data not shown).
3.2.3 Post-mortem high-resolution microCT evaluation
In line with the in vivo DXA and microPET bone scan results, post-mortem microCT confirmed considerable improvements in the trabecular bone density (BMD), bone volume fraction (BV/TV), and structural parameters (Tb.Th, Tb.N, Tb.Sp) in femurs of both q4d and q7d NELL-PEG groups at 4 weeks post-treatment compared to the corresponding PBS/PEG control (Fig. 5A-E). Both NELL-PEG groups demonstrated a statistically significant increase in bone volume fraction (BV/TV) compared to the control, but with no substantial difference between each other (Fig. 5B). Notably, the q7d NELL-PEG group also showed significant improvement in other trabecular parameters (BMD, Tb.Th, and Tb.N) compared to the control (Fig. 5A-E).
Figure 5. Post-mortem microCT results at 4 weeks post treatment.

(A-E) Femurs treated with q4d and q7d NELL-PEG exhibited considerable increases in (A) the trabecular BMD, (B) the bone volume density (BV/TV), and various structural parameters including (C) trabecular thickness (Tb.Th), (D) trabecular number (Tb.N), and (E) trabecular spacing (Tb.Sp) compared to the PBS/PEG control. Both NELL-PEG groups demonstrated statistically significant BV/TV increases compared to the control, but with no significant difference between each other. Notably, the q7d NELL-PEG group exhibited significant improvement in all other trabecular values (BMD, Tb.Th, and Tb.N) compared to the control group (*p<0.05, **p<0.01). (F) 3D reconstructions of representative femurs in the volume of analysis (above; 3mm in height) and near the growth plate (bottom).
3.2.4 CFU-F assay, histological and immunohistochemical analyses
To examine the effect of NELL-1 on bone marrow stromal cell (BMSC) content, a CFU-F assay was performed using fresh and passaged bone marrow isolated from humeri immediately post-harvest. The results at 4 weeks post-treatment displayed a statistically significant increase in BMSC numbers in the NELL-PEG (q7d) group compared to the control, suggesting that NELL-PEG enhances the proliferation of BMSCs when administered systemically (Fig. 6). Histology stain confirmed increased bone formation and trabeculation in the metaphyseal area of the distal femur in the NELL-PEG treatment group (Fig. 7A, B). Consistently, OCN immunostaining demonstrated increased osteoblast numbers while TRAP staining demonstrated decreased osteoclast numbers in the NELL-PEG-treated group compared to the PBS/PEG control group (Fig. 7C-F).
Figure 6. Colony-forming unit-fibroblast (CFU-F) assay results from NELL-PEG (q7d) and PBS/PEG control groups.
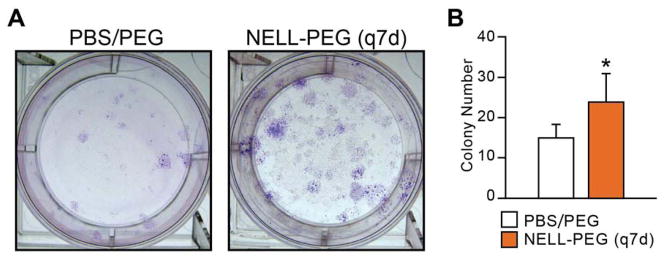
(A) CFU-F-derived colonies were stained using Giemsa Stain Solution at 4 weeks post treatment. (B) BMSC content was quantified by counting colonies microscopically. The q7d NELL-PEG group exhibited a significant increase in BMSC content compared to the control group (*p<0.05).
Figure 7. Histological and immunohistochemical staining of NELL-PEG (q7d) and PBS/PEG control groups.
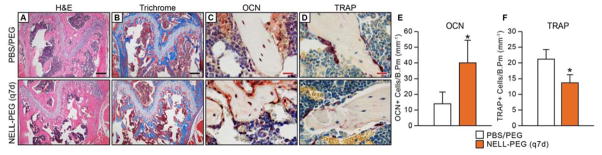
(A) H&E and (B) Trichrome staining exhibited greater trabecular bone formation at the distal femoral metaphysis in the q7d NELL-PEG group compared to control. (C) Osteocalcin (OCN) immunostaining exhibited a greater number of OCN positive cells with intense staining in the NELL-PEG group, and (D) TRAP staining exhibited a reduction in TRAP positive cells in the NELL-PEG treated femurs compared to control. (E, F) Quantification of OCN+ cells per trabecular bone perimeter (mm−1)(E) and TRAP+ cells per trabecular bone perimeter (mm−1)(F) were averaged from six random fields per sample. OCN was significantly increased and TRAP significantly decreased in NELL-PEG (q7d) group compared to PBS/PEG control by 4 weeks of treatment (*p<0.01).
4. DISCUSSION
Osteoporosis, characterized by decreased bone mass and a deterioration of bone microarchitecture due to increased osteoclastic and decreased osteoblastic activities, is a common metabolic bone disease with associated bone fragility and increased risk of fracture. Therapeutic approaches to osteoporotic bone loss have focused on either anabolic or antiresorptive agents, with many new biologics that increase Wnt/β-catenin activity currently in development. NELL-1, one such biologic, has proven successful as a growth factor-based local therapeutic similar to BMP-2, the most commonly used osteogenic growth factor in the market. It is important to note, however, that NELL-1 demonstrated fewer side effects when administered in vivo in comparison to BMP-2 [37, 38] as a direct result of its specificity to osteochondral lineage cells.
In regards to NELL-1’s mechanism, our published and unpublished data over the last decade show that NELL-1 exhibits exciting cell-type and stage-specific effects. While NELL-1 affects multiple signaling pathways [18, 26, 38–43], NELL-1 was found to induce osteogenesis principally through Wnt/β-catenin signaling pathway activation [42, 44] and RUNX2 expression [26, 29, 40]. NELL-1 also activates the ERK and JNK MAPK pathway during osteoblastic stimulation [26, 38], and has additive effects with sonic hedgehog (SHH) signaling in osteogenic differentiation of human MSCs [39]. Furthermore, NELL-1 was found to promote cell adhesion and differentiation via Integrin β-1, which is critical for Wnt signaling and FAK activation [43]. The precise molecular network of NELL-1 in promoting osteogenesis still remains incomplete although the significant progresses in delineating NELL-1 mechanism have been made in our previous reports.
With a previous genome-wide linkage study describing an association between NELL-1 and osteoporosis [28], with NELL-1’s dual anabolic and antiresorptive properties described both in vivo and in vitro [19], and with the recent success of reversing OVX-induced bone loss in mice via IV administration of naked NELL-1 [29], we have been both motivated and challenged to further investigate NELL-1 as a systemic anti-osteoporosis therapeutic. Thus, the present study examined the implementation of PEGylation – the most established, FDA-approved technique to prolong a protein’s half-life – to develop NELL-1 as an effective systemic therapy.
In our previous study, three types of PEG (linear 5 KDa, linear 20 kDa and branched 40 KDa) were investigated for their effects on the stability and bioactivity of NELL-1 in vitro. NELL-PEG-5k was selected for the current study because it demonstrated the highest thermostability among the three types of NELL-PEG tested and a bioactivity comparable to that of naked NELL-1 [34]. In this study, we investigated whether the PEGylation would improve the pharmacokinetics and bone quality of NELL-1 in vivo when intravenously administered. To achieve this, the study was performed with two aims. The first aim was to evaluate the serum protein concentration with time and biodistribution of NELL-PEG in comparison to naked NELL-1. The second aim was to investigate the systemic osteogenic capacity of NELL-PEG in vivo when administered at two different injection schedules, q4d and q7d, after performing an in vivo pharmacokinetic assessment.
The pharmacokinetics of PEGylated NELL-1 was investigated first. After being injected intravenously, NELL-PEG rapidly distributed throughout the vasculature and then began to clear from the blood system. The serum concentration and time course of NELL-PEG is shown in Fig. 1. Meanwhile, NELL-PEG slowly extravasated and accumulated in specific organ regions, and we assessed the biodistribution of NELL-PEG by an ex vivo method at 48 h as illustrated in Fig. 2. The two parts consist of the pharmacokinetic process of NELL-PEG in vivo.
The NELL-PEG group had higher exposure AUC, greater maximum concentration Cmax, and longer half-life time (T1/2) compared to the corresponding values for the naked NELL-1, which can be attributed to the decreased renal clearance after PEGylation. This result is in agreement with previous studies of PEGylated proteins [45–47]. Furthermore, the smaller K12/K21 ratio of NELL-PEG indicated that its transfer from the central compartment to the peripheral compartment was reduced by conjugation with PEG. The transfer rate became slower for both directions; in particular, the transfer rate of NELL-PEG was only half that of the naked NELL-1 for the transfer from vascular to extravascular compartments, indicating a high retention in the central compartment. This was confirmed by the high mean retention time (MRT), maximum serum concentration (Cmax), and AUC of NELL-PEG. The changes in the pharmacokinetic parameters after PEGylation could lead to increased clinical effectiveness of NELL-1 since it can maintain a protein concentration above the minimum effective concentration for an extended period of time.
PEGylation may also influence the biodistribution of protein after extravasation [48]. NELL-PEG and NELL-1 protein were fluorescently labeled and administered in mice, and the organs examined via imaging after 48 hours. This result indicated that NELL-PEG had significantly higher uptake in bone tissue compared to the naked NELL-1 after a single IV dose. This finding may be attributable to two reasons. First, the PEGylated NELL-1 has a higher concentration and longer retention time in the vasculature system as confirmed in the pharmacokinetics study, thus forming a higher concentration gradient between the blood vessel and tissue which in turn lead to a higher diffusion rate and eventually a higher uptake of protein. Second, NELL-1 could bind specifically to the receptor of apoptosis related protein 3 (APR3) membrane protein on osteoblasts in bone tissue [49], thereby resulting in a greater accumulation compared to other peripheral tissues such as muscle and adipose tissue. Although the highest concentration of protein was found in the liver and spleen 48 h after IV injection, autopsy and histology findings revealed no pathology at high NELL-PEG concentrations up to 50 ug/mL (data not shown). More importantly, NELL-PEG distribution in vital organs such as the brain and heart remained at low levels and did not exhibit a significant increase after PEGylation. Therefore, the pharmacokinetics study indicated that the PEGylation significantly affected the clearance process and tissue penetration of NELL-1. Such a favorable accumulation of the protein in bone tissue sheds positive light on the benefits of NELL-1 as a systemic therapy for skeletal diseases.
Since the PEGylation of NELL-1 significantly improved its pharmacokinetics, we further investigated the systemic osteogenic capacity of NELL-PEG in vivo, especially its activity under extended administration intervals than our previous systemic therapy study using unmodified NELL-1 [29]. PEG in PBS was used as control in order to assess any possible effect associated with the PEG molecule. The systemic administration of NELL-PEG in mice for 4 weeks revealed significantly increased bone mineral density (based on DXA) and percent bone volume (based on microCT) in 3-month-old mice in both q4d and q7d injection schedules. While the q4d and q7d NELL-PEG groups did not exhibit notable differences between each other, both groups exhibited significant improvements in all measured DXA and microCT parameters compared to the PBS/PEG control including trabecular bone density (BMD), volume (BV/TV), and structural measurements (Tb.Th, Tb.N, Tb.Sp). Interestingly, we found that although not statistically significant, the q7d group exhibited a greater osteogenic effect compared to the q4d group. Speculated reasons for these findings that invite further investigation include that this strain of mouse is reported to exhibit a poor response to treatment or OVX in the vertebral body due to very low baseline bone levels [50, 51]. In addition, the overdosing or frequent injection of a growth factor-based drug such as PTH has been shown to down-regulate the osteogenic effect, possibly by initiating negative feedback mechanism by overloading the receptor [52]. This is evidenced by the fact that pulsatile PTH dosing yields a favorable outcome in improving bone growth whereas continuous PTH dosing results in net bone loss [53, 54].
Moreover, F-18 microPET scanning of the NELL-PEG (q7d) group 4 weeks post-treatment revealed an increased new bone formation particularly in the vertebral column, proximal humeri, proximal and distal femurs, and proximal tibias compared to the control. Furthermore, a colony-forming unit (CFU) assay examining the mesenchymal cell (MSC) content in the humeri demonstrated a statistically significant increase in MSC numbers in the NELL-PEG (q7d) group compared to the control, suggesting that NELL-PEG enhances the proliferation of BMSCs when administered systemically q7d. Histology and immunohistochemistry analyses further corroborated increased bone formation and trabeculation as well as increased osteoblastic and decreased osteoclastic activities in the NELL-PEG group.
Taken together, these exciting findings encourage us to further investigate NELL-PEG as a systemic anti-osteoporosis therapeutic with not just a clinically feasible, but in fact a substantially improved injection schedule that could reduce costs and improve patient compliance in chronic treatment clinical settings. With regards to the circulation time of NELL-1 in vivo, an injection frequency reduced to q4d would make NELL-PEG a systemic therapy comparable to that of other combined anabolic and antiresorptive agents currently in development, specifically anti-DKK1 or anti-Sclerostin [35]. An injection frequency further reduced to q7d as suggested in this present study, however, would present a superior injection schedule when compared to other systemic anti-osteoporosis therapeutics. Such a reduced injection schedule may lead to significantly reduced treatment costs and increased patient compliance in clinical settings for the treatment of osteoporosis and other osteodeficient disorders. Furthermore, the PEGylation of osteoinductive molecule NELL-1 as a systemic therapy may also aid in the treatment of large post-surgical orthopedic and craniofacial defects such as in cleft palate and cranial suture repair.
5. CONCLUSIONS
The presented success in the PEGylation of NELL-1 is both innovative and novel in the field of orthopedic research. With an improved biodistribution and pharmacokinetics in vivo and with enhanced bone quality after systemic administration, this exciting discovery of a reduced injection frequency of NELL-PEG to q7d demonstrates PEGylated NELL-1 to be a strong candidate as a translational, systemic therapeutic for various osteodeficient disorders such as osteoporosis and large post-surgical orthopedic and craniofacial defects. Moreover, the present study champions the PEGylation method to be a revolutionary platform technology that invites further investigation of novel methodologies to deliver additional osteogenic growth factors.
Acknowledgments
This work was supported by the Center for the Advancement of Science in Space and the National Aeronautics and Space Administration (CASIS-NASA) 09-253-0369, NIH/NIAMS R01 AR061399-01A1, and NIH/NIAMS R01AR 066782-01. The authors thank Dr. Omar Velasco, Dr. Kambiz Khalilinejad, Dr. Caroline Girgius, Dr. Abdulaziz Mohammad, Pia Ang, Mahsa Dousti, Dr. Aaron W James, and Greg Asatrian for their help. The authors would also like to thank Dr. David Stout and Dr. Jason Lee at Crump Institute for Molecular Imaging, UCLA, for constructive advice on the biodistribution study.
Footnotes
Disclosures:
Drs. X.Z., B.W., K.T., and C.S. are inventors of Nell-1 related patents. Drs. X.Z., B.W., K.T., and C.S are founders and/or board members of Bone Biologics Inc. which sublicenses Nell-1 patents from the UC Regents, which also hold equity in the company.
Publisher's Disclaimer: This is a PDF file of an unedited manuscript that has been accepted for publication. As a service to our customers we are providing this early version of the manuscript. The manuscript will undergo copyediting, typesetting, and review of the resulting proof before it is published in its final citable form. Please note that during the production process errors may be discovered which could affect the content, and all legal disclaimers that apply to the journal pertain.
References
- 1.Heinemann DF. Osteoporosis. An overview of the National Osteoporosis Foundation clinical practice guide. Geriatrics. 2000;55:31–6. quiz 9. [PubMed] [Google Scholar]
- 2.Berry SD, Kiel DP, Donaldson MG, Cummings SR, Kanis JA, Johansson H, et al. Application of the National Osteoporosis Foundation Guidelines to postmenopausal women and men: the Framingham Osteoporosis Study. Osteoporos Int. 2010;21:53–60. doi: 10.1007/s00198-009-1127-3. [DOI] [PMC free article] [PubMed] [Google Scholar]
- 3.Shuler FD, Conjeski J, Kendall D, Salava J. Understanding the burden of osteoporosis and use of the World Health Organization FRAX. Orthopedics. 2012;35:798–805. doi: 10.3928/01477447-20120822-12. [DOI] [PubMed] [Google Scholar]
- 4.Watts NB, Lewiecki EM, Miller PD, Baim S. National Osteoporosis Foundation 2008 Clinician's Guide to Prevention and Treatment of Osteoporosis and the World Health Organization Fracture Risk Assessment Tool (FRAX): what they mean to the bone densitometrist and bone technologist. J Clin Densitom. 2008;11:473–7. doi: 10.1016/j.jocd.2008.04.003. [DOI] [PubMed] [Google Scholar]
- 5.Czerwinski E, Badurski JE, Marcinowska-Suchowierska E, Osieleniec J. Current understanding of osteoporosis according to the position of the World Health Organization (WHO) and International Osteoporosis Foundation. Ortop Traumatol Rehabil. 2007;9:337–56. [PubMed] [Google Scholar]
- 6.Jilka RL. Biology of the basic multicellular unit and the pathophysiology of osteoporosis. Med Pediatr Oncol. 2003;41:182–5. doi: 10.1002/mpo.10334. [DOI] [PubMed] [Google Scholar]
- 7.Cusano NE, Bilezikian JP. Combination anabolic and antiresorptive therapy for osteoporosis. Endocrinol Metab Clin North Am. 2012;41:643–54. doi: 10.1016/j.ecl.2012.04.005. [DOI] [PubMed] [Google Scholar]
- 8.Bilezikian JP. Combination anabolic and antiresorptive therapy for osteoporosis: opening the anabolic window. Curr Osteoporos Rep. 2008;6:24–30. doi: 10.1007/s11914-008-0005-9. [DOI] [PubMed] [Google Scholar]
- 9.Vahle JL, Sato M, Long GG, Young JK, Francis PC, Engelhardt JA, et al. Skeletal changes in rats given daily subcutaneous injections of recombinant human parathyroid hormone (1–34) for 2 years and relevance to human safety. Toxicol Pathol. 2002;30:312–21. doi: 10.1080/01926230252929882. [DOI] [PubMed] [Google Scholar]
- 10.Jilka RL. Molecular and cellular mechanisms of the anabolic effect of intermittent PTH. Bone. 2007;40:1434–46. doi: 10.1016/j.bone.2007.03.017. [DOI] [PMC free article] [PubMed] [Google Scholar]
- 11.Neer RM, Arnaud CD, Zanchetta JR, Prince R, Gaich GA, Reginster JY, et al. Effect of parathyroid hormone (1–34) on fractures and bone mineral density in postmenopausal women with osteoporosis. N Engl J Med. 2001;344:1434–41. doi: 10.1056/NEJM200105103441904. [DOI] [PubMed] [Google Scholar]
- 12.Minear S, Leucht P, Jiang J, Liu B, Zeng A, Fuerer C, et al. Wnt proteins promote bone regeneration. Sci Transl Med. 2010;2:29ra30. doi: 10.1126/scitranslmed.3000231. [DOI] [PubMed] [Google Scholar]
- 13.Wagner ER, Zhu G, Zhang BQ, Luo Q, Shi Q, Huang E, et al. The therapeutic potential of the Wnt signaling pathway in bone disorders. Curr Mol Pharmacol. 2011;4:14–25. [PubMed] [Google Scholar]
- 14.Cabrera CV, Alonso MC, Johnston P, Phillips RG, Lawrence PA. Phenocopies induced with antisense RNA identify the wingless gene. Cell. 1987;50:659–63. doi: 10.1016/0092-8674(87)90039-0. [DOI] [PubMed] [Google Scholar]
- 15.Nusslein-Volhard C, Wieschaus E. Mutations affecting segment number and polarity in Drosophila. Nature. 1980;287:795–801. doi: 10.1038/287795a0. [DOI] [PubMed] [Google Scholar]
- 16.Ting K, Vastardis H, Mulliken JB, Soo C, Tieu A, Do H, et al. Human NELL-1 expressed in unilateral coronal synostosis. Journal of bone and mineral research : the official journal of the American Society for Bone and Mineral Research. 1999;14:80–9. doi: 10.1359/jbmr.1999.14.1.80. [DOI] [PubMed] [Google Scholar]
- 17.Aghaloo T, Cowan CM, Chou YF, Zhang X, Lee H, Miao S, et al. Nell-1-induced bone regeneration in calvarial defects. Am J Pathol. 2006;169:903–15. doi: 10.2353/ajpath.2006.051210. [DOI] [PMC free article] [PubMed] [Google Scholar]
- 18.Cowan CM, Zhang X, James AW, Kim TM, Sun N, Wu B, et al. NELL-1 increases pre-osteoblast mineralization using both phosphate transporter Pit1 and Pit2. Biochem Biophys Res Commun. 2012;422:351–7. doi: 10.1016/j.bbrc.2012.04.077. [DOI] [PubMed] [Google Scholar]
- 19.James AW, Shen J, Velasco O, Asatrian G, Chung G, Khadarian K, Zhang Y, Chang L, Goyal R, Kim J, Zhang X, Adams J, Ting K, Soo C. Systemic administration of NELL-1, a Wnt/β-Catenin Regulator, Induces Bone Formation in Osteoporotic Mice via Integrinβ1. American Society of Bone and Mineral Research (ASBMR) Annual Meeting; 2013. [Google Scholar]
- 20.Kwak J, Zara JN, Chiang M, Ngo R, Shen J, James AW, et al. NELL-1 injection maintains longbone quantity and quality in an ovariectomy-induced osteoporotic senile rat model. Tissue engineering Part A. 2013;19:426–36. doi: 10.1089/ten.tea.2012.0042. [DOI] [PMC free article] [PubMed] [Google Scholar]
- 21.Li W, Lee M, Whang J, Siu RK, Zhang X, Liu C, et al. Delivery of lyophilized Nell-1 in a rat spinal fusion model. Tissue engineering Part A. 2010;16:2861–70. doi: 10.1089/ten.tea.2009.0550. [DOI] [PMC free article] [PubMed] [Google Scholar]
- 22.Lu SS, Zhang X, Soo C, Hsu T, Napoli A, Aghaloo T, et al. The osteoinductive properties of Nell- 1 in a rat spinal fusion model. The spine journal : official journal of the North American Spine Society. 2007;7:50–60. doi: 10.1016/j.spinee.2006.04.020. [DOI] [PubMed] [Google Scholar]
- 23.Siu RK, Lu SS, Li W, Whang J, McNeill G, Zhang X, et al. Nell-1 protein promotes bone formation in a sheep spinal fusion model. Tissue engineering Part A. 2011;17:1123–35. doi: 10.1089/ten.tea.2010.0486. [DOI] [PMC free article] [PubMed] [Google Scholar]
- 24.Aghaloo T, Jiang X, Soo C, Zhang Z, Zhang X, Hu J, et al. A study of the role of nell-1 gene modified goat bone marrow stromal cells in promoting new bone formation. Mol Ther. 2007;15:1872–80. doi: 10.1038/sj.mt.6300270. [DOI] [PMC free article] [PubMed] [Google Scholar]
- 25.Aghaloo T, Cowan CM, Zhang X, Freymiller E, Soo C, Wu B, et al. The effect of NELL1 and bone morphogenetic protein-2 on calvarial bone regeneration. J Oral Maxillofac Surg. 2010;68:300–8. doi: 10.1016/j.joms.2009.03.066. [DOI] [PMC free article] [PubMed] [Google Scholar]
- 26.Zhang X, Ting K, Bessette CM, Culiat CT, Sung SJ, Lee H, et al. Nell-1, a key functional mediator of Runx2, partially rescues calvarial defects in Runx2(+/−) mice. Journal of bone and mineral research : the official journal of the American Society for Bone and Mineral Research. 2011;26:777–91. doi: 10.1002/jbmr.267. [DOI] [PMC free article] [PubMed] [Google Scholar]
- 27.James AW, Pan A, Chiang M, Zara J, Zhang X, Ting K, et al. A new function of Nell-1 protein in repressing adipogenic differentiation. Biochem Biophys Res Commun. 2011 doi: 10.1016/j.bbrc.2011.06.111. [DOI] [PMC free article] [PubMed] [Google Scholar]
- 28.Karasik D, Hsu YH, Zhou Y, Cupples LA, Kiel DP, Demissie S. Genome-wide pleiotropy of osteoporosis-related phenotypes: the Framingham Study. Journal of bone and mineral research : the official journal of the American Society for Bone and Mineral Research. 2010;25:1555–63. doi: 10.1002/jbmr.38. [DOI] [PMC free article] [PubMed] [Google Scholar]
- 29.James AW, Shen J, Zhang X, Asatrian G, Goyal R, Kwak JH, Jiang L, Bengs B, Culiat CT, Turner AS, Seim HB, Wu BM, Lyons K, Adams JS, Ting K, Soo C. NELL-1 in the Treatment of Osteoporotic Bone Loss. Nature Communications. 2015 doi: 10.1038/ncomms8362. manuscript in press. [DOI] [PMC free article] [PubMed] [Google Scholar]
- 30.Jevsevar S, Kunstelj M, Porekar VG. PEGylation of therapeutic proteins. Biotechnol J. 2010;5:113–28. doi: 10.1002/biot.200900218. [DOI] [PubMed] [Google Scholar]
- 31.Ng EW, Shima DT, Calias P, Cunningham ET, Jr, Guyer DR, Adamis AP. Pegaptanib, a targeted anti-VEGF aptamer for ocular vascular disease. Nat Rev Drug Discov. 2006;5:123–32. doi: 10.1038/nrd1955. [DOI] [PubMed] [Google Scholar]
- 32.Levy Y, Hershfield MS, Fernandez-Mejia C, Polmar SH, Scudiery D, Berger M, et al. Adenosine deaminase deficiency with late onset of recurrent infections: response to treatment with polyethylene glycol-modified adenosine deaminase. J Pediatr. 1988;113:312–7. doi: 10.1016/s0022-3476(88)80271-3. [DOI] [PubMed] [Google Scholar]
- 33.Pfister D, Morbidelli M. Process for protein PEGylation. Journal of controlled release : official journal of the Controlled Release Society. 2014;180:134–49. doi: 10.1016/j.jconrel.2014.02.002. [DOI] [PubMed] [Google Scholar]
- 34.Zhang Y, Velasco O, Zhang X, Ting K, Soo C, Wu BM. Bioactivity and circulation time of PEGylated NELL-1 in mice and the potential for osteoporosis therapy. Biomaterials. 2014;35:6614–21. doi: 10.1016/j.biomaterials.2014.04.061. [DOI] [PMC free article] [PubMed] [Google Scholar]
- 35.Glantschnig H, Scott K, Hampton R, Wei N, McCracken P, Nantermet P, et al. A rate-limiting role for Dickkopf-1 in bone formation and the remediation of bone loss in mouse and primate models of postmenopausal osteoporosis by an experimental therapeutic antibody. J Pharmacol Exp Ther. 2011;338:568–78. doi: 10.1124/jpet.111.181404. [DOI] [PubMed] [Google Scholar]
- 36.Parfitt AM, Drezner MK, Glorieux FH, Kanis JA, Malluche H, Meunier PJ, et al. Bone histomorphometry: standardization of nomenclature, symbols, and units. Report of the ASBMR Histomorphometry Nomenclature Committee. Journal of bone and mineral research : the official journal of the American Society for Bone and Mineral Research. 1987;2:595–610. doi: 10.1002/jbmr.5650020617. [DOI] [PubMed] [Google Scholar]
- 37.Shen J, James AW, Zara JN, Asatrian G, Khadarian K, Zhang JB, et al. BMP2-induced inflammation can be suppressed by the osteoinductive growth factor NELL-1. Tissue engineering Part A. 2013;19:2390–401. doi: 10.1089/ten.tea.2012.0519. [DOI] [PMC free article] [PubMed] [Google Scholar]
- 38.Zhang X, Zara J, Siu RK, Ting K, Soo C. The role of NELL-1, a growth factor associated with craniosynostosis, in promoting bone regeneration. Journal of dental research. 2010;89:865–78. doi: 10.1177/0022034510376401. [DOI] [PMC free article] [PubMed] [Google Scholar]
- 39.James AW, Pang S, Askarinam A, Corselli M, Zara JN, Goyal R, et al. Additive effects of sonic hedgehog and Nell-1 signaling in osteogenic versus adipogenic differentiation of human adiposederived stromal cells. Stem cells and development. 2012;21:2170–8. doi: 10.1089/scd.2011.0461. [DOI] [PMC free article] [PubMed] [Google Scholar]
- 40.Truong T, Zhang X, Pathmanathan D, Soo C, Ting K. Craniosynostosis-associated gene nell-1 is regulated by runx2. Journal of bone and mineral research : the official journal of the American Society for Bone and Mineral Research. 2007;22:7–18. doi: 10.1359/jbmr.061012. [DOI] [PubMed] [Google Scholar]
- 41.Chen W, Zhang X, Siu RK, Chen F, Shen J, Zara JN, et al. Nfatc2 is a primary response gene of Nell-1 regulating chondrogenesis in ATDC5 cells. Journal of bone and mineral research : the official journal of the American Society for Bone and Mineral Research. 2011;26:1230–41. doi: 10.1002/jbmr.314. [DOI] [PMC free article] [PubMed] [Google Scholar]
- 42.Shen J, Siu R, Pang S, Zara J, Kwak J, Zhang X, James A, Chiang M, Ngo R, Li W, Lee M, Ting K, Soo C. The Novel Osteoinductive Wnt Regulator NELL-1 Potentially Antagonizes BMP2-induced Adipogenesis and Augments BMP2-induced Osteogenesis. The American Society for Bone and Mineral Research (abstract) 2011 [Google Scholar]
- 43.Shen J, James AW, Chung J, Lee K, Zhang JB, Ho S, et al. NELL-1 promotes cell adhesion and differentiation via Integrinbeta1. Journal of cellular biochemistry. 2012;113:3620–8. doi: 10.1002/jcb.24253. [DOI] [PubMed] [Google Scholar]
- 44.James AW. Review of Signaling Pathways Governing MSC Osteogenic and Adipogenic Differentiation. Scientifica. 2013;2013:684736. doi: 10.1155/2013/684736. [DOI] [PMC free article] [PubMed] [Google Scholar]
- 45.Bansal R, Post E, Proost JH, de Jager-Krikken A, Poelstra K, Prakash J. PEGylation improves pharmacokinetic profile, liver uptake and efficacy of Interferon gamma in liver fibrosis. Journal of controlled release : official journal of the Controlled Release Society. 2011;154:233–40. doi: 10.1016/j.jconrel.2011.05.027. [DOI] [PubMed] [Google Scholar]
- 46.Mattos A, de Jager-Krikken A, de Haan M, Beljaars L, Poelstra K. PEGylation of interleukin-10 improves the pharmacokinetic profile and enhances the antifibrotic effectivity in CCl(4)-induced fibrogenesis in mice. Journal of controlled release : official journal of the Controlled Release Society. 2012;162:84–91. doi: 10.1016/j.jconrel.2012.05.041. [DOI] [PubMed] [Google Scholar]
- 47.Zhang C, Fan K, Luo H, Ma X, Liu R, Yang L, et al. Characterization, efficacy, pharmacokinetics, and biodistribution of 5kDa mPEG modified tetrameric canine uricase variant. International journal of pharmaceutics. 2012;430:307–17. doi: 10.1016/j.ijpharm.2012.03.057. [DOI] [PubMed] [Google Scholar]
- 48.Caliceti P, Schiavon O, Veronese FM. Biopharmaceutical properties of uricase conjugated to neutral and amphiphilic polymers. Bioconjugate chemistry. 1999;10:638–46. doi: 10.1021/bc980155k. [DOI] [PubMed] [Google Scholar]
- 49.Zou X, Shen J, Chen F, Ting K, Zheng Z, Pang S, et al. NELL-1 binds to APR3 affecting human osteoblast proliferation and differentiation. FEBS letters. 2011;585:2410–8. doi: 10.1016/j.febslet.2011.06.024. [DOI] [PMC free article] [PubMed] [Google Scholar]
- 50.Li CY, Schaffler MB, Wolde-Semait HT, Hernandez CJ, Jepsen KJ. Genetic background influences cortical bone response to ovariectomy. Journal of bone and mineral research : the official journal of the American Society for Bone and Mineral Research. 2005;20:2150–8. doi: 10.1359/JBMR.050819. [DOI] [PubMed] [Google Scholar]
- 51.Bouxsein ML, Myers KS, Shultz KL, Donahue LR, Rosen CJ, Beamer WG. Ovariectomy-induced bone loss varies among inbred strains of mice. Journal of bone and mineral research : the official journal of the American Society for Bone and Mineral Research. 2005;20:1085–92. doi: 10.1359/JBMR.050307. [DOI] [PubMed] [Google Scholar]
- 52.Zhou H, Iida-Klein A, Lu SS, Ducayen-Knowles M, Levine LR, Dempster DW, et al. Anabolic action of parathyroid hormone on cortical and cancellous bone differs between axial and appendicular skeletal sites in mice. Bone. 2003;32:513–20. doi: 10.1016/s8756-3282(03)00057-7. [DOI] [PubMed] [Google Scholar]
- 53.Potter LK, Greller LD, Cho CR, Nuttall ME, Stroup GB, Suva LJ, et al. Response to continuous and pulsatile PTH dosing: a mathematical model for parathyroid hormone receptor kinetics. Bone. 2005;37:159–69. doi: 10.1016/j.bone.2005.04.011. [DOI] [PubMed] [Google Scholar]
- 54.Schmitt CP, Hessing S, Oh J, Weber L, Ochlich P, Mehls O. Intermittent administration of parathyroid hormone (1–37) improves growth and bone mineral density in uremic rats. Kidney international. 2000;57:1484–92. doi: 10.1046/j.1523-1755.2000.00993.x. [DOI] [PubMed] [Google Scholar]