

Abstract
Routinely used therapies are not adequate to treat the heterogeneity of breast cancer, and consequently, more therapeutic targets are desperately needed. To identify novel targets, we generated a breast cancer cDNA library enriched for genes that encode membrane and secreted proteins. From this library we identified SUSD2 (Sushi Domain Containing 2), which encodes an 822 amino acid protein containing a transmembrane domain and functional domains inherent to adhesion molecules. Previous studies describe the mouse homolog, Susd2, but there are no studies on the human gene associated with breast cancer. Immunohistochemistry analysis of human breast tissues showed weak or no expression of SUSD2 in normal epithelial cells, with the endothelial lining of vessels staining positive for SUSD2. However, staining was observed in pathological breast lesions and in lobular and ductal carcinomas. SUSD2 interacts with Galectin-1 (Gal-1), a 14-kDa secreted protein that is synthesized by carcinoma cells and promotes tumor immune evasion, angiogenesis and metastasis. Interestingly, we found that localization of Gal-1 on the surface of cells is dependent on the presence of SUSD2. Various phenotype assays indicate that SUSD2 increases the invasion of breast cancer cells and contributes to a potential immune evasion mechanism through induction of apoptosis of Jurkat T cells. Using a syngeneic mouse model, we observed accelerated tumor formation and decreased survival in mice with tumors expressing Susd2. We found significantly fewer CD4 tumor infiltrating lymphocytes in mice with tumors expressing Susd2. Together, our findings provide evidence that SUSD2 may represent a promising therapeutic target for breast cancer.
Keywords: breast cancer, SUSD2, Galectin-1, therapeutic target
Introduction
Breast cancer is the most common cancer in women and the second leading cause of cancer-related death in women worldwide (1). Tumor-specific immunotherapies offer the potential for high specificity toward cancerous cells, while omitting normal tissues, minimizing the systemic side effects of conventional chemotherapy. Immunotherapies use the binding specificity of antibodies to target molecules that are upregulated or specific to tumor cells. One such therapy utilizes trastuzumab (Herceptin), a humanized monoclonal antibody that binds to HER-2/neu (ErbB2) and inhibits the proliferation and survival of HER2-dependent tumors. When administered concurrently with adjuvant chemotherapy, trastuzumab significantly increases disease-free survival (2). However, only 25–30% of human breast cancers over-express HER-2 (3, 4), so there is a great need for the identification of additional breast tumor-specific immunotherapy targets. One limitation is the availability of unique protein targets that are present on cancer cells but are not expressed in normal essential tissues.
In order to identify genes that encode membrane and secreted proteins useful for the diagnosis or treatment of breast cancer, a cDNA library was generated from membrane-associated polyribosomal RNA (5). To remove ubiquitously expressed genes, the library was subtracted with RNA from normal brain, liver, kidney, lung, and muscle (5). After sequencing 25,000 library clones and aligning the sequences to the human genome, the genes represented in the library were ordered by abundance. HER-2 was the eighth most abundant gene (5), and here we report the identification of a new human breast cancer gene, SUSD2 (Sushi Domain Containing 2), the 18th most abundant gene in the membrane-associated polyribosomal cDNA library (MAPcL). SUSD2 is located on chromosome 22 and encodes an 822 amino acid type I membrane protein containing somatomedin B, AMOP, von Willebrand factor type D, and Sushi domains, which are frequently found in molecules playing important roles in cell-to-cell and cell-matrix adhesion.
Two papers have been published describing the mouse homolog, Susd2 (also known as mSVS-1 or SVS-1), which was identified by cDNA microarray analysis comparing global gene expression levels of v-K-ras transformed Ki3T3 cells to mouse NIH3T3 cells (6, 7). The Susd2 gene was found to be down-regulated in Ki3T3 cells compared to NIH3T3 cells (6). This study demonstrated that over-expression of Susd2 in HT1080 fibrosarcoma cells and HeLa cervical carcinoma cells inhibits clonogenicity, anchorage independent growth, migration, and invasion through Matrigel (6). The results indicate a possible tumor suppressive role of Susd2. However, the major conclusions drawn from these studies are based on transient expression systems using the mouse gene over-expressed in human cell lines (6).
Aside from these studies, the current knowledge about the function of SUSD2 in humans is limited. A recent publication detailing methods used to map human protein-protein interactions by mass spectrometry identified a high-confidence interaction between SUSD2 and Galectin-1 (Gal-1) (8). No further characterization of the interaction has been reported. Gal-1, encoded by the LGALS1 gene, is a 14-kDa protein that is part of a phylogenetically conserved family of proteins characterized by their ability to bind β-galactoside residues on many cellular glycoproteins. Gal-1 has been extensively studied and is implicated in tumor transformation, cell cycle regulation, apoptosis, cell adhesion, migration and inflammation (7). Recently, focus has shifted toward its role in tumor evasion of the immune system via regulation of T cell homeostasis and survival, T cell immune disorders, inflammation and allergies, as well as host-pathogen interactions (8–10).
Because SUSD2 was highly abundant in the MAPcL, we investigated whether expression of the gene is associated with breast cancer. To study the phenotypic and biological significance of SUSD2 in breast cancer, we performed several in vitro and in vivo analyses using stable cell lines. We have identified several mechanisms by which SUSD2 may contribute to breast tumorigenesis.
MATERIALS and METHODS
Cell Culture
MDA-MB-231, SK-BR-3, 293T, A2780, SKOV3, and 66CL4 cells were maintained in DMEM with 10% fetal bovine serum (FBS, Atlanta Biologicals). Jurkat cells were maintained in RPMI with 10% FBS. All cells were grown at 37°C in humidified 5% CO2. All cell lines were authenticated and tested negatively for mycoplasma.
RT-PCR
Total RNA isolation from breast tumors and cDNA generation was performed as described previously (11). PCRs to amplify SUSD2 and LGALS1 were performed using the following protocol: initial denaturation at 94°C for 3 min, 30 cycles of denaturation at 94°C for 1 min, annealing at 65°C for 1 min, and elongation at 72°C for 1 min, with a final 5 min extension at 72°C. The same PCR conditions were used with the Human Rapid-Scan gene expression panels (OriGene) for analysis of gene expression in normal tissue cDNA.
Western Blots
Tissue culture cell lines were washed twice with PBS and lysed in a buffer containing 150 mM NaCl, 50 mM Tris-HCl pH 7.5, 1.0% sodium deoxycholate, 1.0% Igepal CA-630, 0.1% sodium dodecyl sulfate (SDS), 5 mM EDTA, and protease inhibitors. Protein extracts were separated by SDS-PAGE and transferred to polyvinylidene difluoride membranes (Millipore). Blots were incubated sequentially with Western Blocking Reagent (Roche), primary antibody, and then secondary antibody, all for 1 hour. Colorimetric detection was performed using solutions of nitro-blue tetrazolium and 5-bromo-4-chloro-3′-indolyphosphate (NBT/BCIP 1-Step Solution, Pierce). Equal loading was verified by incubating the membranes with anti-GAPDH antibody. Primary antibodies used include polyclonal rabbit anti-SUSD2 (Prestige Antibodies), polyclonal goat anti-Gal-1 (R&D Systems), and monoclonal mouse anti-GAPDH (Sigma).
Immunofluorescence and Confocal Microscopy
Cells grown on glass coverslips were washed and fixed with 4% paraformaldehyde. After permeabilization with 0.1% Triton X-100, samples were blocked with 10% goat serum in PBS for 1 hour. Samples were exposed to primary antibodies for 1 hour followed by fluorescently conjugated secondary antibody staining for 1 hour. Coverslips were mounted on slides using Pro-Long Gold anti-fade mounting medium with DAPI (Invitrogen). Images were obtained by the Olympus Fluoview FV1000 confocal laser microscope. Omission of the primary antibody was performed to discriminate background staining. Primary antibodies used include polyclonal mouse anti-SUSD2 (Novus Biologicals) and polyclonal rabbit anti-Gal-1 (Cell Signaling).
Immunohistochemical Staining
Blocks of formalin-fixed, paraffin-embedded human breast tissue and mouse tumors were prepared for immunohistochemical analysis. Sections of 5 μm thickness were subjected to immunostaining by heat-induced epitope retrieval in citrate buffer followed by detection using a Vector ABC kit (Vector Laboratories), as described elsewhere (12). Accumax breast tissue arrays (ISU Abxis) were also immunostained by the same protocol. Antibodies used include anti-SUSD2 (Prestige Antibodies), anti-mouse Ki67 (Biocare Medical), and anti-mouse CD31 (Abcam). The immunostained sections were reviewed by a trained pathologist. Staining for Ki67 and CD31 was quantitated using ImageJ software (http://imagej.nih.gov/ij/download.html) (13).
Construction of Stable Cell Lines
The open reading frame of SUSD2 was cloned into the pLXSN retroviral vector and transfected into Phoenix packaging cells using Effectene (Qiagen), as recommended by the manufacturer. After 48 hours, the supernatant containing non-replicating forms of amphotrophic virus was harvested. Target cell lines were infected at 70% confluency with virus supernatant in the presence of 10 μg/ml Polybrene (Sigma). Stable clones were generated with antibiotic selection in 600 μg/ml G418. Cells transduced with the empty pLXSN vector were used as controls.
SK-BR-3 cells were used to generate stable SUSD2 knock-down cell lines utilizing SUSD2 shRNA-expressing lentiviral particles (pLKO.1 vector, MISSION™ shRNAs, Sigma). Cells were infected according to manufacturer’s instructions and selected with 0.8 μg/ml puromycin. Stable clones were selected for further study based on the extent of SUSD2 knock-down determined by flow cytometry and western immunoblot analysis (data not shown). A non-targeting shRNA sequence and the empty pLKO.1 vector were used as controls. (Sequences: SUSD2 #1, CCGGGACGATCATTTCTGCAACTTTCTCGAGAAAGTTGCAGAAATGATCGTCTTTTTTG; SUSD2 #2, CCGGCCAGTGTGATCTGCAGGTTTACTCGAGTAAACCTGCAGATC ACACTGGTTTTTTG).
Cell Proliferation and Colony-Forming Assays
To observe cellular proliferation rates, 2×10⁵ cells were plated in 100 mm tissue culture plates. Cells were collected and counted every 24 hours using an automated cell counter (Coulter Particle Counter, Beckman Coulter). Colony formation was analyzed by plating 500 cells in 100 mm tissue culture plates (in triplicate). After eight days, colonies were fixed in 2% paraformaldehyde and stained with 0.5% crystal violet. Colonies were defined as a minimum of 50 cells in a group and were counted using image analysis software (AlphaInnotech).
Migration and Invasion Assays
Cellular invasion and migration were analyzed using Boyden chamber-style cell culture inserts with or without Matrigel, respectively (BD Falcon). Cell culture inserts containing a polyester membrane with 8.0 μm pores were placed in 12-well cell culture dishes and seeded with 2×10⁴ cells per well in the top chamber, in serum-free media. Culture medium with 10% FBS was used as a chemoattractant in the lower chamber. After 22 hours, migrated cells were fixed with 2% paraformaldehyde and stained with 0.05% crystal violet. Inserts were removed and mounted on glass microscope slides. Cells in ten random fields were counted.
In Vitro Apoptosis Assay
We adapted a method for detection of Jurkat T cell apoptosis during co-culture with breast cancer cells, originally described by Kovács-Sólyom (14). Cancer cell lines were plated on glass coverslips and allowed to adhere overnight. Jurkat cells were pre-stained with 200 ng/ml Hoecsht 33342 (Sigma) and added to the coverslips at a 1:1 Jurkat to breast cancer cell ratio. After co-incubation for 16 hours, coverslips were fixed and stained with Annexin V-FITC for analysis by confocal microscopy. The percentage of apoptotic Jurkat cells was calculated by counting the number of Hoechst-stained cells (blue) that also stained with Annexin V-FITC (green). The following formula was used for calculations: (# of green and blue cells) / (# of blue cells) × 100 = percent apoptosis.
Co-immunoprecipitation Reactions
Cell extracts were immunoprecipitated using polyclonal rabbit anti-SUSD2 (Prestige Antibodies) or monoclonal mouse anti-Gal-1 (Santa Cruz) antibodies. Briefly, 1 mg of cellular lysate was incubated with Protein A agarose beads (GE Healthcare Life Sciences) to remove non-specific binding proteins. The supernatant was then subjected to immunoprecipitation by adding 1.5 μg of anti-SUSD2 antibody (Prestige Antibodies) or 3 μg of anti-Gal-1 antibody (Santa Cruz). The mixtures were gently agitated overnight at 4°C followed by the addition of Protein A agarose beads and agitation for 1 hour at 4°C. Immunocomplexes associated with the beads were recovered by centrifugation and washed by three cycles of resuspension in lysis buffer (150 mM NaCl, 50 mM Tris-HCl pH 7.5, 1.0% sodium deoxycholate, 1.0% Igepal CA-630, 0.1% SDS, 5 mM EDTA) followed by centrifugation. The immunocomplexes retained on the beads were resuspended in buffer containing 20% glycerol, 2% SDS, 250 mM Tris pH 6.8, β-mercaptoethanol and 0.1% bromophenol blue, boiled, and subjected to SDS-PAGE followed by western immunoblot analysis for anti-SUSD2 and anti-Gal-1, as described above.
Flow Cytometry
Cells were harvested using non-enzymatic cell dissociation buffer to avoid enzymatic digestion of cell surface proteins. To show the presence of SUSD2 and Gal-1 on the cell surface, non-permeabilized cells were resuspended in PBS supplemented with 1% heat-inactivated FBS and 0.1% NaN3 and stained with anti-SUSD2 (Novus Biologicals) and anti-Gal-1 (R&D Systems) antibodies, followed by fluorescently conjugated secondary antibodies. Samples were analyzed using an Accuri Flow Cytometer and gated based on forward- and side-scatter profile to exclude debris and cellular aggregates from the analysis.
In Situ Proximity Ligation Assay
Cells cultured in 16-well chamber slides were used with the Duolink In Situ Proximity Ligation Assay (Duolink-PLA) kit according to manufacturer’s instructions. Cells were stained with primary antibodies and incubated with the appropriate pair of Plus and Minus oligonucleotide-conjugated secondary antibodies from Olink Bioscience. After hybridization, ligation and amplification, a detection solution containing Texas Red-labeled oligo-linkers (Duolink Detection kit, Olink Bioscience) was added to allow visualization of protein-protein interactions as red dots. Coverslips were mounted using mounting media with DAPI and sealed with nail polish. Control experiments were performed with primary antibodies to proteins that do not interact with SUSD2 or Gal-1. Images were obtained using a FV1000 confocal microscope.
Mouse Model
All animal experiments were approved by the IACUC at Sanford Research, Sioux Falls, SD. Seven-week-old female Balb/c mice (Charles River Laboratories) were subcutaneously injected with 1×10⁵ syngeneic 66CL4 cells in 100 μl serum-free DMEM into the lower right mammary fat pad region. Tumor size was measured every 2–3 days once a palpable tumor had formed. Tumor volume was calculated with the following formula: volume = π/6 × (short diameter)2 × (long diameter). Mice were sacrificed when moribund or tumor volume reached 1500 mm3.
Analysis of Lymphocytes in Mouse Tissues
Tumors and spleens were harvested at time of necropsy. Spleens were dissociated into single-cell suspensions by mechanical disruption and passage through 70 μm cell strainers. Tumors were homogenized using a GentleMACS Dissociator (Miltenyi Biotech) and enzymatically digested according to manufacturer’s instructions. Erythrocytes and dead cells were removed from the tumor and spleen samples with red blood cell lysis solution (150 mM NH4Cl, 10 mM KHCO3, and 0.1 mM EDTA in H2O). Blood samples were collected from the heart post-mortem and lymphocytes were isolated using Ficoll Paque Plus. Tumor, spleen and blood lymphocytes were stained for T lymphocyte markers (α-CD4/PE, BD Bioscience; and α-CD8/FITC, eBioscience). Samples were analyzed using an Accuri Flow Cytometer and lymphocytes were gated based on forward- and side-scatter profile.
Statistics
Data are expressed as mean ± SEM. Where indicated, Student’s T test was used to compare two groups. A P value 0.05 or less is considered statistically significant. Kaplan-Meier analysis was used to assess survival and the Log-rank test was used to compare the survival distributions to determine statistical significance.
RESULTS
Expression of SUSD2 in breast cancer and normal tissues
To verify that SUSD2 is expressed in breast tumors from patients and identify the distribution and localization of SUSD2 in breast tissue, immunohistochemical (IHC) analysis was performed. Specificity of the anti-SUSD2 antibody used for IHC was verified by staining paraffin-embedded wild-type 293T cells and pcDNA3.1-SUSD2-Myc-His transiently transfected 293T cells (Sup. Fig. 1A & B, respectively). 293T cells do not express SUSD2, and no staining was observed in this sample (Sup. Fig. 1A). Staining for SUSD2 was observed in 293T cells that were transiently transfected with the SUSD2 expression plasmid, demonstrating the specificity of the anti-SUSD2 antibody (Sup. Fig. 1B). Matched sets of 20 breast cancer and normal breast tissues isolated from women undergoing a bilateral mastectomy, with one block containing the tumor and another from the contralateral normal breast, were stained using the anti-SUSD2 antibody. Minimal staining for SUSD2 was observed in benign breast tissue, with no staining in normal epithelial cells of benign ducts and lobules. However, staining was present in the endothelial cells lining blood vessels and capillaries in benign samples (Fig. 1A, 1–3). Positive staining for SUSD2 was observed in the cytoplasm and along the cytoplasmic membrane of various pathological lesions of the breast, including papillary metaplasia (Fig. 1A, 4–5) and sclerosing adenosis (Fig. 1A, 6). Positive staining for SUSD2 was observed in lobular and ductal breast carcinoma, as well as in both in situ and invasive breast carcinomas (Fig. 1A, 7–9). On higher magnification, cancerous cells stain distinctly positive for SUSD2 around the cell membrane (Fig. 1A, 9). To increase the sample size, a breast cancer tissue array was analyzed for SUSD2 staining by IHC for a total of 75 patient tumor samples studied. Overall, 82% stained positively for SUSD2, including 41 of 47 ER+, 30 of 36 HER-2 amplified, and 4 of 7 triple negative subtypes.
Figure 1.
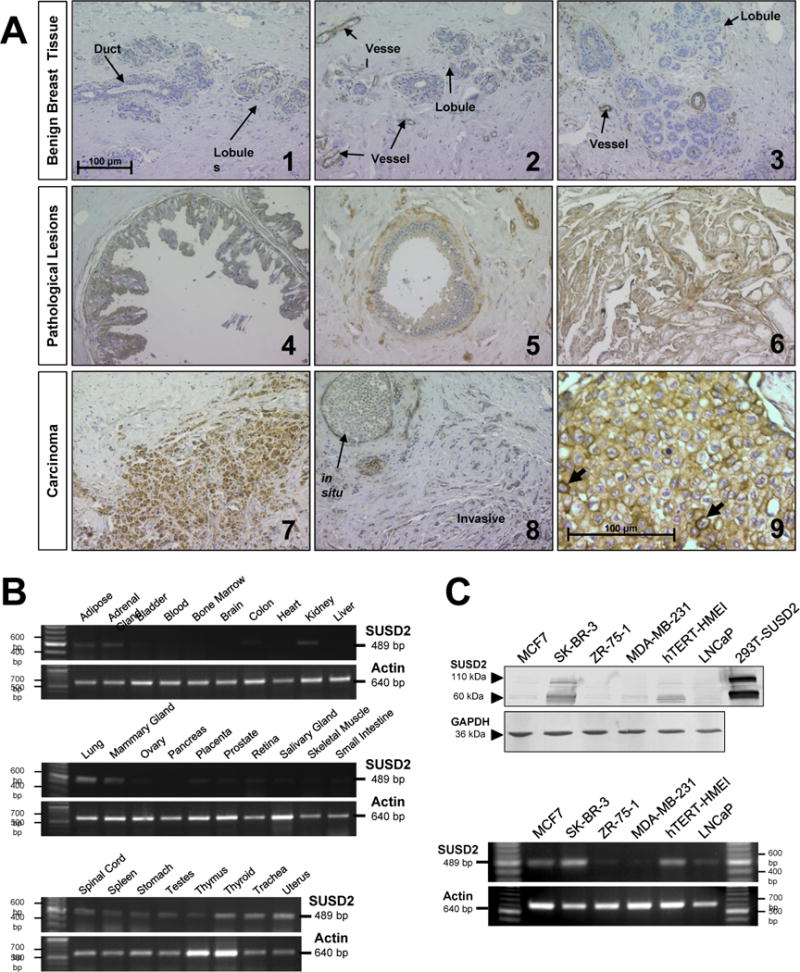
Analysis of SUSD2 in human tissues. (A) Paraffin-embedded blocks of tissue were collected from women undergoing a bilateral mastectomy for breast cancer. Tissue sections were immunostained with anti-SUSD2 antibody, counterstained with hematoxylin and analyzed by a trained pathologist. Images 1 through 8 were taken at an original magnification of 200×, and image 9 was taken at 400×. Scale bars indicate 100 μm. (B) Expression of SUSD2 in normal tissues was analyzed by RT-PCR using a panel of cDNAs derived from 28 different normal tissues. (C) Expression of SUSD2 in MAPcL cell lines was determined by western immunoblot analysis (top) using whole cell lysates harvested from MAPcL cell lines and pcDNA3.1-SUSD2-myc-His transfected 293T cells as a positive control. RT-PCR analysis (bottom) was performed using primers to SUSD2 that amplify a 489-bp fragment.
To investigate expression of SUSD2 in normal tissues, we used RT-PCR analysis on a cDNA panel derived from 28 different normal tissues. Many normal tissues did not express SUSD2; however, expression was detected in several normal tissues, such as adipose, adrenal gland, kidney, lung, mammary gland, placenta, thyroid, trachea and uterus (Fig. 1B). This data indicates that SUSD2 has restricted expression in normal tissues.
Because the MAPcL was generated from pooled membrane-associated polyribosomal RNA derived from six cell lines, we determined which of the cell lines contain SUSD2. Whole cell lysates harvested from the MAPcL cell lines and 293T cells transiently transfected with pcDNA3.1-SUSD2-Myc-His were separated by SDS-PAGE. After immunoblotting using an anti-SUSD2 antibody, two strong bands at 60 and 110-kDa were present in SK-BR-3 cells and the positive control (Fig. 1C, top). Comprised of 822 amino acids, the predicted size of SUSD2 is 90.4-kDa. The 110-kDa band is most likely a glycosylated form of SUSD2, which is consistent with previous studies showing Susd2 has at least four glycosylation sites (6). The 60-kDa band suggests SUSD2 is post-translationally cleaved. Lower levels were detected in MCF7 and hTERT-HME1 cells, while there was almost no detectable SUSD2 protein in ZR-75-1, MDA-MB-231 or LNCaP cells (Fig. 1C, top). Similar expression patterns were observed with RT-PCR analysis using total RNA from the cell lines as a template to generate cDNA (Fig. 1C, bottom). Finally, an anti-SUSD2 antibody was used for IHC analysis to stain for SUSD2 in the four breast cancer cell lines used to generate the MAPcL. Three of the four breast cancer cell lines had very weak to no detectable SUSD2, MCF7 (luminal A subtype), ZR-75-1 (luminal A subtype) and MDA-MB-231 (basal subtype) (15) (Sup. Fig. 1C, E and F). However, SK-BR-3, HER-2 subtype (15), showed distinct SUSD2 cell membrane staining by IHC (Sup. Fig. 1D). The significance of SUSD2 being expressed in SK-BR-3 cells that have amplification of HER-2 will be further investigated in the future.
Over-expression of SUSD2 increases invasion, but does not affect cellular proliferation or anchorage-dependent growth
To determine the function of SUSD2 in breast tumorigenesis, stable SUSD2-expressing cell lines were generated. MDA-MB-231 cells, which do not endogenously produce SUSD2 (Fig. 1C), were transfected with either pLXSN-SUSD2 or the empty vector, and antibiotic selection was used to generate stable cell lines. To examine whether SUSD2 affects the growth of breast cancer cells, we performed cell proliferation and colony-forming assays. Cellular proliferation was assayed by cell counting using a Coulter Counter. There was no significant difference in growth rates with SUSD2 over-expression compared to the empty vector controls (data not shown). The colony forming ability was assessed by seeding 500 cells in a 100 mm cell culture dish and counting the number of colonies formed in eight days. Morphological analysis of the colonies showed looser, less-circular colonies in the SUSD2 over-expressing cell lines than the empty vector control, but the total number of colonies did not significantly differ (Fig. 2A). In general, the plating efficiency of all four cell lines tested was approximately 80%. Similar results for proliferation and colony-forming ability were observed using additional clones (data not shown). These results together indicate that SUSD2 does not play a role in cellular proliferation or anchorage-dependent growth of breast cancer cells.
Figure 2.
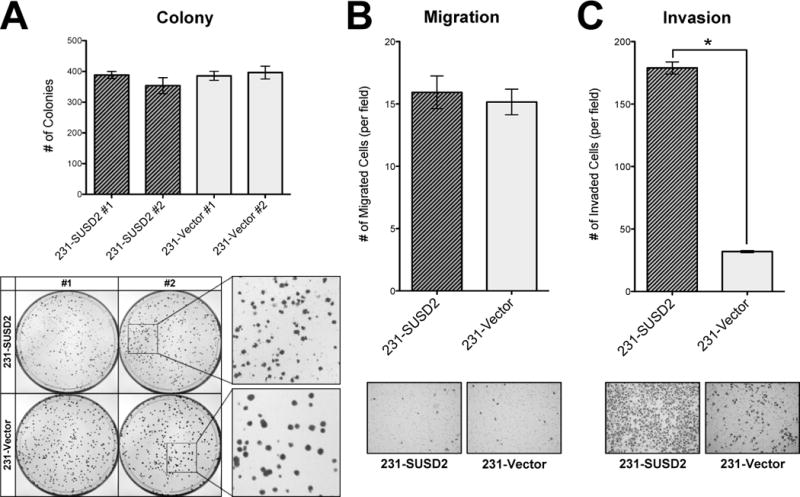
Over-expression of SUSD2 promotes invasion of breast cancer cells but does not alter anchorage-dependent growth. (A) Colony forming assay. MDA-MB-231-SUSD2 cell lines formed looser, less circular colonies than the vector-only controls, but there were no significant differences in the actual number of colonies. (B) Migration assay. Over-expression of SUSD2 does not affect migration of breast cancer cells. (C) Matrigel invasion assay. Cell culture inserts with Matrigel to simulate the basement membrane indicate that over-expression of SUSD2 increases the invasive potential of breast cancer cells (p<0.0001). Representative photos of the cells that moved through the membranes are shown.
We next examined whether SUSD2 expression influences the ability of breast cancer cells to migrate and/or invade using Boyden chamber-style cell culture inserts without or with Matrigel, respectively. MDA-MB-231-SUSD2 cell lines and vector-only controls were plated on the membranes, and allowed to migrate toward a chemoattractant in the lower chamber. As shown in Fig. 2B, SUSD2 over-expression did not significantly alter cellular migration. We performed a similar experiment to compare the ability of MDA-MB-231 cells to invade through Matrigel-coated cell culture inserts. As shown in Fig. 2C, SUSD2 over-expression significantly increased invasion by almost 7-fold.
Interaction of SUSD2 with Galectin-1
A previous study using mass spectrometry to screen for human interacting proteins identified an interaction between SUSD2 and Gal-1 (16). To verify that SUSD2 and Gal-1 interact, we performed co-immunoprecipitation using anti-SUSD2 antibodies followed by western immunoblot analysis with anti-Gal-1 antibodies. The reciprocal order of the antibodies was also performed. Gal-1 was detected by western immunoblot analysis when anti-SUSD2 antibodies were used for immunoprecipitation, and SUSD2 was detected by western immunoblot analysis of proteins pulled down by immunoprecipitation with anti-Gal-1 antibodies (Fig. 3A). No bands were detected using the vector-only cell line since SUSD2 is not made in these cells (Fig. 3A). MDA-MB-231-SUSD2 whole cell lysates were used as a positive control for the western immunoblot. Consistent with mass spectroscopy (16), we found that SUSD2 co-immunoprecipitated with Gal-1 and vice versa, indicating that the two proteins interact.
Figure 3.
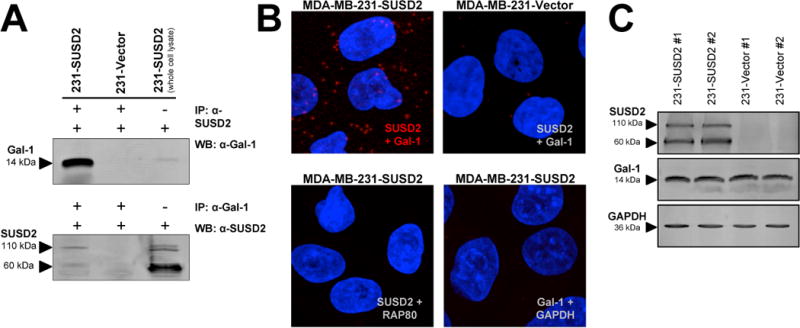
Interaction of SUSD2 and Galectin-1. (A) Co-immunoprecipitation was performed using anti-SUSD2 antibodies followed by western immunoblot analysis with anti-Gal-1 antibodies (top). The reciprocal order of antibodies was also performed (bottom). As a control for the western blot, 50 μg of total protein from MDA-MB-231-SUSD2 cells was loaded on the gel but not subjected to immunoprecipitation. (B) In situ PLA was performed using anti-SUSD2 and anti-Gal-1 antibodies. Negative controls were performed with antibodies to GAPDH and RAP80. Red dots indicate protein-protein interactions. Images shown are 20 stacked optical sections taken at 300× magnification using the same PMT, gain and offset settings. (C) SUSD2 and Gal-1 expression in MDA-MB-231 stable cell lines was determined by western immunoblot analysis.
We used in situ PLA to further confirm the interaction. This technique allows detection and visualization of protein-protein interactions through utilization of probes with oligonucleotides attached to antibodies against the two proteins. Interacting proteins located within 40 nm of each other permit rolling circle amplification of the DNA strands, allowing interacting protein molecules to be visualized (17). As shown in Fig. 3B, the interaction of SUSD2 and Gal-1, shown as red fluorescent dots, was confirmed by PLA. Only background levels were observed in MDA-MB-231-vector cells and in negative controls performed with antibodies to proteins that do not interact with SUSD2 or Gal-1 (Fig. 3B). These results indicate that SUSD2 and Gal-1 interact in very specific, punctate regions along the cell membrane of breast cancer cells.
Next, we determined whether over-expression of SUSD2 had an effect on Gal-1 protein levels. As shown in Fig. 3C, western immunoblot analysis using MDA-MB-231-SUSD2 cell lines and vector control cell lines indicated that levels of Gal-1 protein are not affected by SUSD2.
Subcellular localization of SUSD2 and Galectin-1
To determine whether SUSD2 and Gal-1 co-localize in breast cancer cells, immunofluorescence confocal microscopy was performed. Cells were fixed, permeabilized, incubated with anti-SUSD2 and anti-Gal-1 antibodies followed by fluorescently labeled secondary antibodies and visualized for SUSD2 and Gal-1 staining. Gal-1 had a similar staining pattern in all of the studied cell lines and was predominately located in the cell cytoplasm (Fig. 4A). SK-BR-3 cells and MDA-MB-231-SUSD2 cell lines, which express SUSD2 along the cell membrane, showed co-localization of SUSD2 with Gal-1 in small punctate regions on the surface of the cells (Fig. 4A), consistent with the findings by PLA (Fig. 3B).
Figure 4.
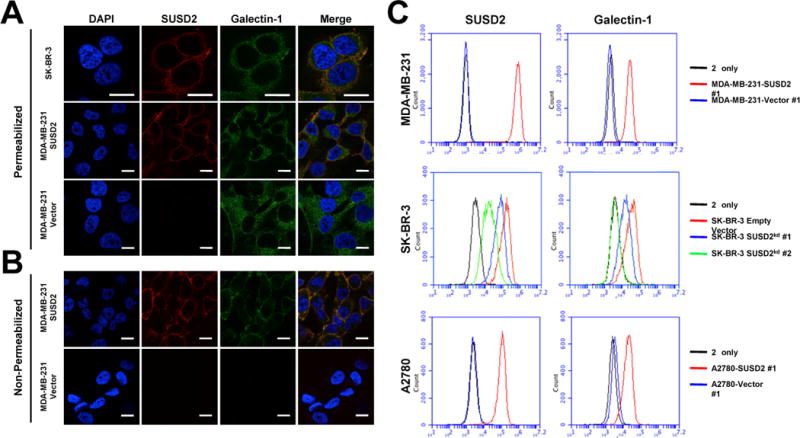
Subcellular localization of SUSD2 and Galectin-1. (A) Cells were permeabilized with Triton X-100 and immunostained with anti-SUSD2 (red) and anti-Gal-1 (green) antibodies. (B) Analysis of cell surface proteins was performed similarly, but with omission of the permeabilization step. Fluorescence indicates presence of cell surface proteins only. Nuclei were stained with DAPI, and scale bars indicate 10 μm. (C) Cell surface proteins were analyzed by flow cytometry using non-permeabilized cells.
Since SUSD2 is a type I transmembrane protein, we hypothesized that SUSD2 has an effect on cell surface presentation of Gal-1. In order to examine this possibility, we performed immunofluorescence confocal microscopy using non-permeabilized cells. Cell surface Gal-1 was detected only on cells that expressed SUSD2, while the empty vector control cells showed no detectable cell surface Gal-1 (Fig. 4B). We further verified this interaction by flow cytometry to analyze cell surface presentation of SUSD2 and Gal-1. Because the cells were not permeabilized, only surface proteins were detected. A large shift in fluorescence of cell surface SUSD2 above the secondary antibody only control indicates that SUSD2 is localized on the cell surface (Fig. 4C, top). When cells are labeled for Gal-1, an increase in the amount of Gal-1 on the surface of MDA-MB-231-SUSD2 cells is detected compared to the vector-only control (Fig. 4C, top).
Similar results were observed in stable SK-BR-3 SUSD2 knock-down cell lines generated using lentiviral transduction particles containing SUSD2-specific shRNA constructs. Cells were screened for cell surface SUSD2 and Gal-1 by flow cytometry and compared to the empty vector control cell line (Fig. 4C, middle). Cell surface Gal-1 was completely abrogated in the cell line displaying the greatest SUSD2 knock-down (SK-BR-3kd #2, Fig. 4C, middle). Consistently, the cell line that exhibited a partial knock-down of SUSD2 displayed a decreased amount of Gal-1 on the cell surface compared to SK-BR-3-vector cells (SK-BR-3kd #1, Fig. 4C, middle). These results show that the amount of Gal-1 on the cell surface correlates with expression of SUSD2 and confirm that SUSD2 is essential for cell surface presentation of Gal-1.
To determine if the influence of SUSD2 on the subcellular localization of Gal-1 is specific to breast cancer cells, similar techniques were used to analyze two different ovarian cancer cell lines generated to over-express SUSD2. As expected, over-expression of SUSD2 in SKOV3 (data not shown) and A2780 ovarian cancer cells leads to an increased cell surface presentation of Gal-1, indicating that this interaction is not limited to breast cancer cells (Fig. 4C, bottom).
Mouse breast cancer model
The 4T1 mammary carcinoma cell line was originally derived from a spontaneously arising mammary tumor in a Balb/c mouse. This model is often used for its high propensity to metastasize to lungs, liver, bone, and brain, similar to human breast cancers (18). Syngeneic mouse models allow analysis of the immune system’s response to the tumor. We utilized a 4T1 sibling cell line (66CL4) to examine the effect of Susd2 over-expression on breast tumorigenesis (18). Both 4T1 and 66CL4 cell lines have been classified as triple negative (estrogen receptor negative, progesterone receptor negative and HER-2 amplification negative) (19) and represent very aggressive models for breast tumorigenesis. Since 66CL4 wild-type cells do not endogenously express Susd2 (data not shown), we generated stable cell lines over-expressing either Susd2 or the empty pLXSN vector. Wild-type 66CL4 cells endogenously express Gal-1, and expression levels of Gal-1 are similar in cell lines with or without expression of Susd2 (data not shown), consistent with the results from human breast cancer cell lines (Fig. 3C). Similarly, we observed no significant difference in growth rates or colony-forming ability of 66CL4 cells with over-expression of Susd2, and similar results were observed in multiple clones (data not shown). These results are consistent with the findings from SUSD2 over-expression in human breast cancer cell lines and confirm that Susd2 does not play a role in cellular proliferation or anchorage-dependent growth of mouse mammary carcinoma cells.
Seven week-old female Balb/c mice were randomly divided into two groups of twelve mice and each group was injected with either 66CL4-pLXSN or 66CL4-Susd2 cells. Once a palpable tumor was formed, measurements were taken every 2–3 days. Mice in the 66CL4-Susd2 group displayed accelerated tumor formation and decreased survival compared to the 66CL4-pLXSN controls (Fig. 5A). Median survival for 66CL4-Susd2 tumor-bearing mice was 36 days, versus 41 days for the 66CL4-pLXSN tumor-bearing mice. Additionally, more mice in the 66CL4-Susd2 group were sacrificed due to development of moribund conditions than those in the 66CL4-pLXSN group (50% versus 8%, respectively) (Fig. 5B). The presence of lung metastases at the time of death was also noted more frequently in the 66CL4-Susd2 group than the 66CL4-pLXSN group (75% versus 55%, respectively) (Fig. 5C).
Figure 5.
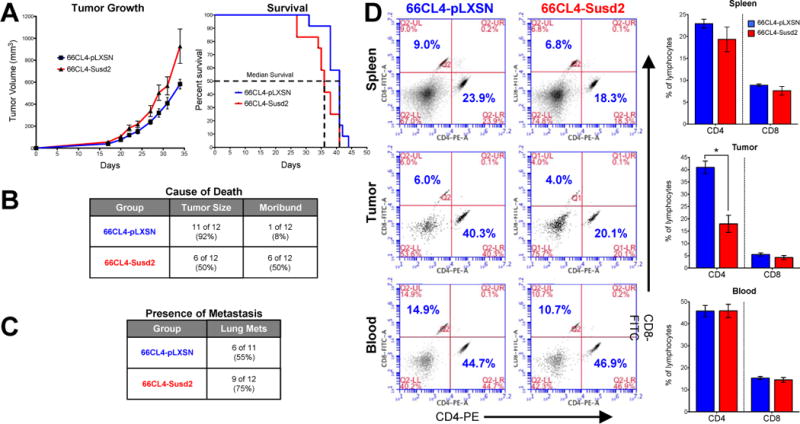
Analysis of Susd2 in breast tumorigenesis. (A) Tumor volume was monitored and mice were sacrificed when tumor volumes reached 1500 mm3 or mice exhibited moribund conditions. Analysis of survival indicates expression of Susd2 correlates with decreased survival (p=0.0199). (B) Cause of death was recorded at the time of sacrifice. Numbers indicated in the table refer to the actual number of mice sacrificed due to each specific cause of death. Percentages indicate the percent of each mouse model group that was sacrificed due to each specific cause of death. Significance was calculated by chi-square test (p=0.0247). (C) Presence of metastases in lungs was analyzed by H&E staining. (D) Lymphocytes were prepared from spleen, tumors, and blood of tumor-burdened mice and stained with CD4-PE and CD8-FITC for analysis by flow cytometry. The lymphocytes were gated based on FSC- and SSC-plots and the ratios of numbers of cells in the CD4+ (x-axis) and CD8+ (y-axis) cell populations were determined. Data are representative of independently performed experiments of n = 6–9 for each group (p<0.05).
We sought to determine if the accelerated tumor formation in the 66CL4-Susd2 mice was due to an increased proliferative rate of the tumor cells. We utilized IHC staining of paraffin-embedded tumors with Ki67 antibodies. The Ki67 nuclear antigen is associated with cellular proliferation and is often used to grade proliferation rates of tumors. The fraction of Ki67 positive tumor cells was used to determine the Ki67 index as a measure of the tumor growth rates. We observed similar Ki67 indexes for both 66CL4-Susd2 and 66CL4-pLXSN tumors (Fig. 6A), indicating that the difference in tumor growth rates in the mice was not due to a higher proliferative rate of the tumor cells themselves.
Figure 6.
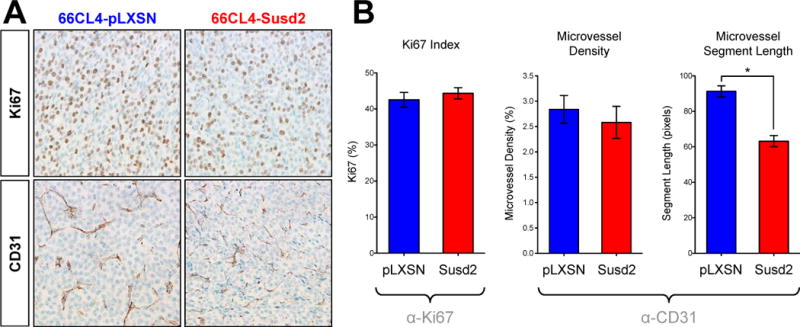
Immunohistochemical analysis of mouse tumors. (A) Proliferation was assessed by IHC staining of paraffin-embedded tumors with Ki67 antibody. Ki67 index was calculated as the percent of cells staining positively for Ki67. (B) Microvasculature was observed by IHC staining of paraffin-embedded tumors with endothelial cell-specific CD31 antibody. ImageJ software was used to calculate microvessel density and the average length of vessel segments in between branch points. Error bars indicate the SEM from counting three random fields in at least four different tumors from each group. Images were obtained at an original magnification of 40× and representative images are shown.
IHC staining of the tumors showed that the expression of CD31, an endothelial cell marker, was markedly more aberrant in the 66CL4-Susd2 tumors (Fig. 6B). We assessed the extent of angiogenesis by calculating the microvessel density in the tumors. Despite the obvious differences in the appearance of the microvasculature, we did not observe significant differences in the microvessel density. To quantitate aberrant blood vessel growth, we calculated the average length of vessel segments in between branch points. As shown in Fig. 6B, 66CL4-Susd2 tumors exhibited much shorter vessel segments between branch points than did the 66CL4-pLXSN tumors (63.2 versus 91.3 pixels, respectively).
The profile of lymphocytes in the tumors, spleen and blood was identified by immunostaining of cell surface markers and analysis by flow cytometry. Lymphocytes were gated based on forward- and side-scatter profile, and the proportion of CD4 to CD8 lymphocytes was calculated (Fig. 5D). A significantly lower percentage of CD4 lymphocytes was observed in tumors of 66CL4-Susd2 mice compared to the 66CL4-pLXSN control (18.0% versus 41.0%, respectively). No significant differences in proportions of CD8 lymphocytes were observed in the tumors, and both CD4 and CD8 lymphocyte populations were similar in the spleen and blood samples from both groups (Fig. 5D). These data together suggest that over-expression of Susd2 by mammary carcinoma tumors in mice alters the population of tumor-infiltrating CD4 lymphocytes.
Over-expression of SUSD2 increases apoptosis of Jurkat cells in co-culture
To examine the possibility that a similar reaction occurs when human cell lines expressing SUSD2 are exposed to T cells, we performed an in vitro co-culture experiment using Jurkat cells, an immortalized line of T cells. Adaptations of this model have been widely used to demonstrate that tumor cell lines can induce T cell apoptosis in co-culture experiments (14, 20–23). In our model, Jurkat cells were co-cultured with stable MDA-MB-231 cells over-expressing either SUSD2 or the empty vector control for 16 hours prior to staining of apoptotic cells with Annexin V. Co-culture with SUSD2-expressing cells caused a significant increase of apoptosis of the Jurkat cells (Fig. 7). We observed an average of 82% apoptosis of Jurkat cells co-cultured with MDA-MB-231-SUSD2, compared to 63% with MDA-MB-231-Vector cells (Fig. 7). This method detects one of the earliest events in apoptosis through the utilization of Annexin V, which has a strong and specific affinity for phosphatidyl serine (PS). PS is translocated from the inner leaflet of the plasma membrane to the outer leaflet soon after apoptosis is induced (24). As such, this method does not allow evaluation of the various pathways that culminate in the induction of apoptosis. This preliminary study suggests that breast cancer cell lines expressing SUSD2 may stimulate a more robust apoptotic response in T cells, but no definitive conclusions can be made as to which apoptotic pathways are affected.
Figure 7.
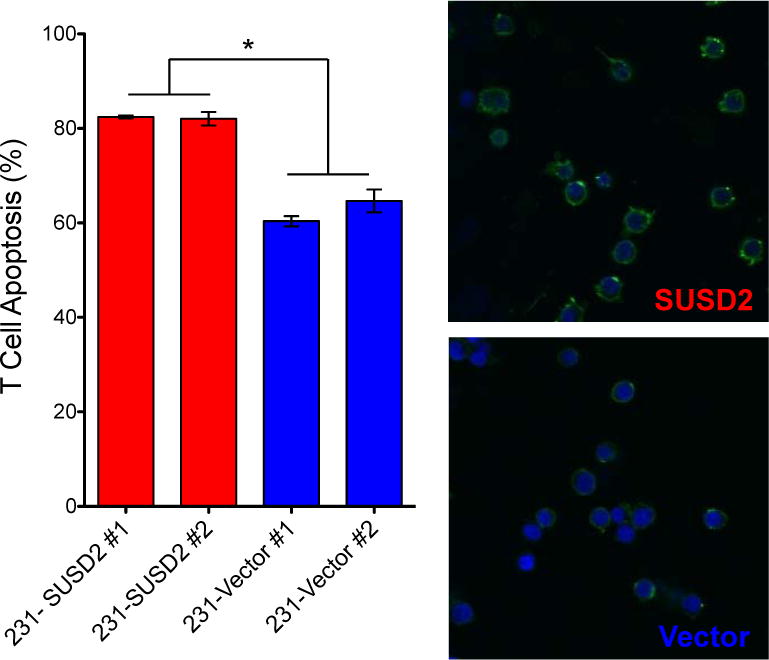
Over-expression of SUSD2 causes apoptosis of T cells. MDA-MB-231 cell lines expressing either SUSD2 or the empty vector controls were co-cultured with Jurkat T cells. Jurkat cells were pre-labeled with Hoechst (blue) prior to being added to the tumor cells. After co-culture for 16 hours, apoptosis was analyzed with Annexin V-FITC (green). Degree of apoptosis was determined by counting cells in ten random fields. Three independent experiments were performed and the graph shows data from one experiment. Error bars indicate SEM (p<0.0001). Representative images are shown on the right.
DISCUSSION
In the present study, we characterize a novel breast cancer gene, SUSD2, and investigate its function in tumorigenesis using in vitro functional assays and an in vivo syngeneic mouse model. SUSD2 is a type I transmembrane protein that localizes to the plasma membrane of breast cancer cells. We identified SUSD2 through generation of a breast cancer cDNA library enriched with genes encoding membrane and secreted proteins (5), and found that it is highly expressed in breast cancer but shows a restricted expression pattern in normal tissues (Fig. 1). IHC analysis showed strong staining in all stages of breast cancer, as well as in non-malignant pathological breast lesions (Fig. 1A). While 82% of breast tumors stained positive for SUSD2, limited staining was observed in benign breast tissue, with just the endothelial lining of blood vessels staining positive (Fig. 1A).
Because little is known about the function of SUSD2, we characterized the role of SUSD2 in breast cancer through the generation of stable cell lines. While over-expression of SUSD2 did not alter the ability of breast cancer cells to migrate in a Boyden chamber-style assay, it did significantly increase the ability of these cells to invade through Matrigel, a basement membrane-like substance used to simulate the metastatic potential of cancer cells (Fig. 2). Successful metastasis requires migration of the tumor cells through the basement membrane and invasion of the surrounding tissues. Our results indicate that breast cancer cells expressing SUSD2 may have enhanced metastatic potential, which was consistent with the increased incidence of lung metastases in the mouse model (Fig. 5C). Since metastatic disease is the main cause of death in breast cancer patients, the presence of SUSD2 in a breast tumor may represent a poor prognosis for the patient.
Of great interest is the finding that SUSD2 interacts with Gal-1 (Fig. 3). Galectins are a family of carbohydrate binding proteins that share an affinity for β-galactoside residues of various proteins and components of the extracellular matrix (25). Gal-1 has been extensively studied for its role in tumor immune escape mechanisms (7) and angiogenesis (26–28). Our studies indicate that expression of SUSD2 leads to an increased amount of Gal-1 on the cell surface (Fig. 4). Previous studies have found that cellular localization of Gal-1 is essential for interaction with the immune system, and specifically that cell surface Gal-1 is necessary for Gal-1-mediated apoptosis of T cells (14). Our studies show that more Jurkat cells undergo apoptosis when co-cultured with MDA-MB-231-SUSD2 cells compared to the vector-only control (Fig. 7). SUSD2-dependent cell surface localization of Gal-1 has not previously been reported and may play a significant role in modulating the body’s immune response to breast cancer. Two possible models for this interaction are that SUSD2 acts as a chaperone for Gal-1 to get to the surface of the cell or SUSD2 sequesters secreted Gal-1 on the cell surface. Future studies will define the exact interaction between the two proteins.
We generated stable 66CL4 cell lines to inject into the mammary fat pad region of mice. In general, mice in the 66CL4-Susd2 group displayed decreased survival and accelerated tumor growth compared to the 66CL4-vector control group, despite similar Ki67 indexes (Figs. 5–6). Although statistically significant (p=0.0199), the difference in median survival between the two groups of mice was only 12%. This result may be explained by the fact that the 4T1 and 66CL4 mouse models are virulent models, and a larger difference in survival between the two groups may be observed using a less-aggressive model. The difference in blood vessel growth between 66CL4-Susd2 and 66CL4-pLXSN tumors may partially account for the difference in tumor growth rates. The formation of tortuous and saccular vessels with haphazard patterns of excessive branching and interconnections is often correlated with accelerated tumor growth (29, 30).
Interestingly, significantly fewer CD4 lymphocytes were observed in the 66CL4-Susd2 tumors (Fig. 5D). The significance of CD4 lymphocytes within tumors is a controversial topic. CD4 cells are classified as “helper T cells,” and are generally thought to recruit and activate CD8 cytotoxic T cells and other lymphocytes to the site of immune activation. Evidence suggests that CD4 cells play a role in activating the host’s immune response to cancer by controlling the activation and persistence of CD8 T cell responses, and might also enhance the ability of the antigen presenting cells to initiate an endogenous CD8 response (31). Recently, a subset of CD4+CD25+ T cells, classified as regulatory T cells, was identified and are now thought to be essential in controlling immune responses by suppression of effector T cell proliferation and cytokine production (32). Future studies are needed to categorize the mouse CD4 tumor-infiltrating lymphocyte populations into CD4+CD25− and CD4+CD25+; therefore, conclusions related to the effect of Susd2 on this particular subset of T cells are not in the scope of this study.
The major finding from this study indicates that expression of Susd2 by mammary tumors promotes many aspects of breast tumorigenesis, including tumor immune evasion, angiogenesis and metastasis. We have shown that SUSD2 is a protein on the surface of breast cancer cells and may be a promising therapeutic target. By targeting SUSD2, multiple processes of breast tumorigenesis may be inhibited.
Supplementary Material
Acknowledgments
We thank Dr. Keith Miskimins for helpful suggestions and critical reading of the manuscript, and Dr. Sue Kane for excellent scientific support and outstanding ideas. We also acknowledge LCM Pathology (Sioux Falls, SD) and the Sanford Research Molecular Pathology Core run by Claire Evans for assistance with sample collection and immunohistochemical staining. We also acknowledge Jeffrey Sachs for his stellar laboratory skills and assistance with in vitro analyses of the mouse cell lines.
GRANT SUPPORT
This research was supported by a grant from Susan G. Komen for the Cure awarded to KAE. In addition, APW was awarded a 2011 American Medical Association (AMA) Foundation Seed Grant Award. The Molecular Pathology, Flow Cytometry and Imaging Cores are supported by a NIH Center of Biomedical Research Excellence (COBRE) grant, number 1P20RR024219-01A2.
Footnotes
COI: None
References
- 1.Jemal A, Bray F, Center MM, Ferlay J, Ward E, Forman D. Global cancer statistics. CA Cancer J Clin. 2011;61(2):69–90. doi: 10.3322/caac.20107. Epub 2011/02/08. doi: caac.20107 [pii] 10.3322/caac.20107. [DOI] [PubMed] [Google Scholar]
- 2.Hudis CA. Trastuzumab–mechanism of action and use in clinical practice. N Engl J Med. 2007;357(1):39–51. doi: 10.1056/NEJMra043186. Epub 2007/07/06. doi: 357/1/39 [pii] 10.1056/NEJMra043186. [DOI] [PubMed] [Google Scholar]
- 3.Yaziji H, Goldstein LC, Barry TS, Werling R, Hwang H, Ellis GK, et al. HER-2 testing in breast cancer using parallel tissue-based methods. JAMA : the journal of the American Medical Association. 2004;291(16):1972–7. doi: 10.1001/jama.291.16.1972. Epub 2004/04/29. [DOI] [PubMed] [Google Scholar]
- 4.Owens MA, Horten BC, Da Silva MM. HER2 amplification ratios by fluorescence in situ hybridization and correlation with immunohistochemistry in a cohort of 6556 breast cancer tissues. Clinical breast cancer. 2004;5(1):63–9. doi: 10.3816/cbc.2004.n.011. Epub 2004/05/14. [DOI] [PubMed] [Google Scholar]
- 5.Egland KA, Vincent JJ, Strausberg R, Lee B, Pastan I. Discovery of the breast cancer gene BASE using a molecular approach to enrich for genes encoding membrane and secreted proteins. Proc Natl Acad Sci U S A. 2003;100(3):1099–104. doi: 10.1073/pnas.0337425100. Epub 2003/01/23. doi: 10.1073/pnas.0337425100 0337425100 [pii] [DOI] [PMC free article] [PubMed] [Google Scholar]
- 6.Sugahara T, Yamashita Y, Shinomi M, Yamanoha B, Iseki H, Takeda A, et al. Isolation of a novel mouse gene, mSVS-1/SUSD2, reversing tumorigenic phenotypes of cancer cells in vitro. Cancer Sci. 2007;98(6):900–8. doi: 10.1111/j.1349-7006.2007.00466.x. Epub 2007/04/13. doi: CAS466 [pii] 10.1111/j.1349-7006.2007.00466.x. [DOI] [PMC free article] [PubMed] [Google Scholar]
- 7.Rabinovich GA. Galectin-1 as a potential cancer target. Br J Cancer. 2005;92(7):1188–92. doi: 10.1038/sj.bjc.6602493. Epub 2005/03/24. doi: 6602493 [pii] 10.1038/sj.bjc.6602493. [DOI] [PMC free article] [PubMed] [Google Scholar]
- 8.Camby I, Le Mercier M, Lefranc F, Kiss R. Galectin-1: a small protein with major functions. Glycobiology. 2006;16(11):137R–57R. doi: 10.1093/glycob/cwl025. Epub 2006/07/15. doi: cwl025 [pii] 10.1093/glycob/cwl025. [DOI] [PubMed] [Google Scholar]
- 9.Liu FT. Galectins: a new family of regulators of inflammation. Clin Immunol. 2000;97(2):79–88. doi: 10.1006/clim.2000.4912. Epub 2000/10/12. doi: 10.1006/clim.2000.4912 S1521-6616(00)94912-X [pii] [DOI] [PubMed] [Google Scholar]
- 10.Perillo NL, Pace KE, Seilhamer JJ, Baum LG. Apoptosis of T cells mediated by galectin-1. Nature. 1995;378(6558):736–9. doi: 10.1038/378736a0. Epub 1995/12/14. [DOI] [PubMed] [Google Scholar]
- 11.Egland KA, Liu XF, Squires S, Nagata S, Man YG, Bera TK, et al. High expression of a cytokeratin-associated protein in many cancers. Proc Natl Acad Sci U S A. 2006;103(15):5929–34. doi: 10.1073/pnas.0601296103. Epub 2006/04/06. doi: 0601296103 [pii] 10.1073/pnas.0601296103. [DOI] [PMC free article] [PubMed] [Google Scholar]
- 12.Chauhan SC, Vannatta K, Ebeling MC, Vinayek N, Watanabe A, Pandey KK, et al. Expression and functions of transmembrane mucin MUC13 in ovarian cancer. Cancer Res. 2009;69(3):765–74. doi: 10.1158/0008-5472.CAN-08-0587. Epub 2009/01/30. doi: 0008-5472.CAN-08-0587 [pii] 10.1158/0008-5472.CAN-08-0587. [DOI] [PubMed] [Google Scholar]
- 13.Abramoff M, Magalhaes P, Ram S. Image processing with ImageJ. Biophotonics International. 2004;11(7):36–42. [Google Scholar]
- 14.Kovacs-Solyom F, Blasko A, Fajka-Boja R, Katona RL, Vegh L, Novak J, et al. Mechanism of tumor cell-induced T-cell apoptosis mediated by galectin-1. Immunol Lett. 127(2):108–18. doi: 10.1016/j.imlet.2009.10.003. Epub 2009/10/31. doi: S0165-2478(09)00247-8 [pii] 10.1016/j.imlet.2009.10.003. [DOI] [PubMed] [Google Scholar]
- 15.Subik K, Lee JF, Baxter L, Strzepek T, Costello D, Crowley P, et al. The Expression Patterns of ER, PR, HER2, CK5/6, EGFR, Ki-67 and AR by Immunohistochemical Analysis in Breast Cancer Cell Lines. Breast cancer : basic and clinical research. 2010;4:35–41. Epub 2010/08/11. [PMC free article] [PubMed] [Google Scholar]
- 16.Ewing RM, Chu P, Elisma F, Li H, Taylor P, Climie S, et al. Large-scale mapping of human protein-protein interactions by mass spectrometry. Mol Syst Biol. 2007;3:89. doi: 10.1038/msb4100134. Epub 2007/03/14. doi: msb4100134 [pii] 10.1038/msb4100134. [DOI] [PMC free article] [PubMed] [Google Scholar]
- 17.Weibrecht I, Leuchowius KJ, Clausson CM, Conze T, Jarvius M, Howell WM, et al. Proximity ligation assays: a recent addition to the proteomics toolbox. Expert review of proteomics. 2010;7(3):401–9. doi: 10.1586/epr.10.10. Epub 2010/06/12. [DOI] [PubMed] [Google Scholar]
- 18.Aslakson CJ, Miller FR. Selective events in the metastatic process defined by analysis of the sequential dissemination of subpopulations of a mouse mammary tumor. Cancer research. 1992;52(6):1399–405. Epub 1992/03/15. [PubMed] [Google Scholar]
- 19.Kau P, Nagaraja GM, Zheng H, Gizachew D, Galukande M, Krishnan S, et al. A mouse model for triple-negative breast cancer tumor-initiating cells (TNBC-TICs) exhibits similar aggressive phenotype to the human disease. BMC cancer. 2012;12:120. doi: 10.1186/1471-2407-12-120. Epub 2012/03/29. [DOI] [PMC free article] [PubMed] [Google Scholar]
- 20.Fischer K, Mackensen A. The flow cytometric PKH-26 assay for the determination of T-cell mediated cytotoxic activity. Methods. 2003;31(2):135–42. doi: 10.1016/s1046-2023(03)00123-3. Epub 2003/09/06. [DOI] [PubMed] [Google Scholar]
- 21.Gastman BR, Atarshi Y, Reichert TE, Saito T, Balkir L, Rabinowich H, et al. Fas ligand is expressed on human squamous cell carcinomas of the head and neck, and it promotes apoptosis of T lymphocytes. Cancer Res. 1999;59(20):5356–64. Epub 1999/10/28. [PubMed] [Google Scholar]
- 22.Kudo D, Rayman P, Horton C, Cathcart MK, Bukowski RM, Thornton M, et al. Gangliosides expressed by the renal cell carcinoma cell line SK-RC-45 are involved in tumor-induced apoptosis of T cells. Cancer Res. 2003;63(7):1676–83. Epub 2003/04/03. [PubMed] [Google Scholar]
- 23.Uhlen M, Bjorling E, Agaton C, Szigyarto CA, Amini B, Andersen E, et al. A human protein atlas for normal and cancer tissues based on antibody proteomics. Molecular & cellular proteomics : MCP. 2005;4(12):1920–32. doi: 10.1074/mcp.M500279-MCP200. Epub 2005/08/30. [DOI] [PubMed] [Google Scholar]
- 24.Vermes I, Haanen C, Steffens-Nakken H, Reutelingsperger C. A novel assay for apoptosis. Flow cytometric detection of phosphatidylserine expression on early apoptotic cells using fluorescein labelled Annexin V. Journal of immunological methods. 1995;184(1):39–51. doi: 10.1016/0022-1759(95)00072-i. Epub 1995/07/17. [DOI] [PubMed] [Google Scholar]
- 25.Barondes SH, Cooper DN, Gitt MA, Leffler H. Galectins. Structure and function of a large family of animal lectins. J Biol Chem. 1994;269(33):20807–10. Epub 1994/08/19. [PubMed] [Google Scholar]
- 26.Baum LG, Seilhamer JJ, Pang M, Levine WB, Beynon D, Berliner JA. Synthesis of an endogeneous lectin, galectin-1, by human endothelial cells is up-regulated by endothelial cell activation. Glycoconj J. 1995;12(1):63–8. doi: 10.1007/BF00731870. Epub 1995/02/01. [DOI] [PubMed] [Google Scholar]
- 27.Dings RP, Van Laar ES, Loren M, Webber J, Zhang Y, Waters SJ, et al. Inhibiting tumor growth by targeting tumor vasculature with galectin-1 antagonist anginex conjugated to the cytotoxic acylfulvene, 6-hydroxylpropylacylfulvene. Bioconjug Chem. 2010;21(1):20–7. doi: 10.1021/bc900287y. Epub 2009/12/22. [DOI] [PubMed] [Google Scholar]
- 28.Thijssen VL, Postel R, Brandwijk RJ, Dings RP, Nesmelova I, Satijn S, et al. Galectin-1 is essential in tumor angiogenesis and is a target for antiangiogenesis therapy. Proc Natl Acad Sci U S A. 2006;103(43):15975–80. doi: 10.1073/pnas.0603883103. Epub 2006/10/18. doi: 0603883103 [pii] 10.1073/pnas.0603883103. [DOI] [PMC free article] [PubMed] [Google Scholar]
- 29.Jain RK. Normalization of tumor vasculature: an emerging concept in antiangiogenic therapy. Science. 2005;307(5706):58–62. doi: 10.1126/science.1104819. Epub 2005/01/08. [DOI] [PubMed] [Google Scholar]
- 30.Less JR, Skalak TC, Sevick EM, Jain RK. Microvascular architecture in a mammary carcinoma: branching patterns and vessel dimensions. Cancer research. 1991;51(1):265–73. Epub 1991/01/01. [PubMed] [Google Scholar]
- 31.Shafer-Weaver K, Anderson M, Malyguine A, Hurwitz AA. T cell tolerance to tumors and cancer immunotherapy. Advances in experimental medicine and biology. 2007;601:357–68. doi: 10.1007/978-0-387-72005-0_38. Epub 2007/08/24. [DOI] [PubMed] [Google Scholar]
- 32.Watanabe MA, Oda JM, Amarante MK, Cesar Voltarelli J. Regulatory T cells and breast cancer: implications for immunopathogenesis. Cancer Metastasis Rev. 2010;29(4):569–79. doi: 10.1007/s10555-010-9247-y. Epub 2010/09/11. [DOI] [PubMed] [Google Scholar]
Associated Data
This section collects any data citations, data availability statements, or supplementary materials included in this article.