

Summary
Evolution of large asexual cell populations underlies ~30% of deaths worldwide, including those caused by bacteria, fungi, parasites, and cancer. However, the dynamics underlying these evolutionary processes remain poorly understood because they involve many competing beneficial lineages, most of which never rise above extremely low frequencies in the population. To observe these normally hidden evolutionary dynamics, we constructed a sequencing-based ultra high-resolution lineage tracking system in Saccharomyces cerevisiae that allows us to monitor the relative frequencies of ~500,000 lineages simultaneously. In contrast with some expectations, we find that the spectrum of fitness effects of beneficial mutations is neither exponential nor monotonic. Early adaptation is a predictable consequence of this spectrum and is strikingly reproducible, but the initial small-effect mutations are soon outcompeted by rarer large-effect mutations that result in variability between replicates. These results suggest that early evolutionary dynamics may be deterministic for a period of time before stochastic effects become important.
Introduction
A major focus of biomedical research has been to identify mutations responsible for increased pathogenicity, cancer progression, or drug resistance in large evolving asexual cell populations1–12. Yet, even characterizing all mutations underlying a disease is not sufficient to understand its progression. Rather, a quantitative understanding of the evolutionary dynamics is necessary to determine which adaptive mutations contribute significantly to driving the population fitness higher, and which are serendipitous or inconsequential. Mutations identified through genome sequencing are likely to constitute only the “tip of the iceberg”, with many beneficial mutations that impact the evolutionary dynamics never rising above extremely low frequencies13,14.
A lineage trajectory, the size of a small subpopulation of cells over time, can be used to discover a beneficial mutation present at an extremely low frequency, and to measure its time of occurrence and selective advantage (Figure 1A)1,15–18. A lineage increasing in size faster than can be explained by stochastic drift indicates that a beneficial mutation has occurred and risen to a high enough frequency to grow almost deterministically (i.e. it has “established”). Most beneficial mutations will drift to extinction before establishing (SM 4.1 and 4.4). For those that do establish, the exponential rate at which a lineage grows is a measure of the fitness effect (s) of the mutation. Extrapolating back the exponential growth, the establishment time (τ) can be inferred: this is a rough estimate of when the mutation occurred19 (SM 4.1 and 4.2). A systematic characterization of the distributions of s and τ for beneficial mutations has been lacking, although these are fundamental to the evolutionary dynamics of large populations20.
Figure 1.

(a) Typical lineage trajectories. A small lineage that does not acquire a beneficial mutation (neutral, blue) will fluctuate in size due to drift before eventually being outcompeted. Rarely, a lineage will acquire a beneficial mutation (star) with a fitness effect of s (adaptive, red). In most cases, this beneficial mutation is lost to drift. If the beneficial mutants drift to a size >~1/s (lower dotted horizontal line), the lineage will begin to grow exponentially at a rate s. Extrapolating the exponential growth to the time at which the mutation is inferred to have reach a size ~1/s yields the establishment time (τ, dashed vertical line) which roughly corresponds to the time when the mutation occurred with an uncertainty of ~1/s. At sizes > ~1/Ub (upper dotted horizontal line), where Ub is the total beneficial mutation rate, the lineage will acquire additional beneficial mutations. (b) Lineage tracking with random barcodes. Left. Sequences containing random 20 nucleotide barcodes (colors) are inserted first into a plasmid and then into a specific location in the genome. Bottom. Recombination between two partially crippled loxP sites (loxP*) integrates the plasmid into the genome and completes a URA3 selectable marker, resulting in one functional and one crippled loxP site (loxP**). The URA3 marker is interrupted by an artificial intron containing the barcode. Right. To measure relative fitness, cells are passed through growth-bottleneck cycles of ~8 generations. Before each bottleneck, genomic DNA is extracted, lineage barcode tags are amplified using a two-step PCR protocol, and amplicons are sequenced. By inserting unique molecular identifiers49 (also short random barcodes, grey bars) in early cycles of the PCR, PCR duplicates of the same template molecule (purple) are detected49,50.
The major experimental challenge is developing a method to quantitatively measure the trajectories of large numbers of small lineages. Large lineages will accumulate multiple beneficial mutations contemporaneously, confounding measurements of s and τ (Figure 1A, multiple mutations, SM 4.5). Small lineages are unlikely to acquire a beneficial mutation at all, so many trajectories must be observed to characterize the distributions of s and τ. DNA barcodes offer a powerful way to simultaneously track multiple lineages21–23, yet technical barriers have limited the number of barcodes that can be inserted into cells24. Here we constructed a system capable of inserting ~500,000 random DNA barcodes into an initially clonal yeast population. Using this system in populations of ~108 cells growing in a defined glucose-limited minimal medium, we identify ~25,000 lineages that gain a beneficial mutation within ~168 generations, measure s and τ for each, and determine the spectrum of mutation rates to each fitness effect. This spectrum results in a deterministic increase in the mean population fitness early, with stochastic events governing its trajectory later.
Results
We generated yeast lineages by inserting a random 20-nucleotide barcode at a single location in the genome (Figure 1B, SM 1.3). To achieve a large number of integration events, we inserted a “landing pad” into a neutral location in the yeast genome that allows for high-frequency, site-specific genomic integration of plasmids via the Cre-loxP recombination system25,26. A plasmid library containing ~500,000 random barcodes was inserted into the genome at the landing pad. Barcoding requires ~48 generations of growth from a common ancestor (Extended Data 1). Adaptive mutations begin to occur during this initial growth and can be carried forward into the evolution.
The same barcoded yeast library was evolved in replicate experiments (E1 and E2) for ~168 generations in serial batch culture, diluting 1:250 every ~8 generations, with bottleneck population size of ~7×10⁷ (Extended Data 1, SM 4.4). To count the relative frequency of each lineage across time, we isolated genomic DNA from the pooled population, amplified lineage tags using a 2-step PCR protocol, and sequenced amplicons (Figure 1B, SM 1.5, 5.2).
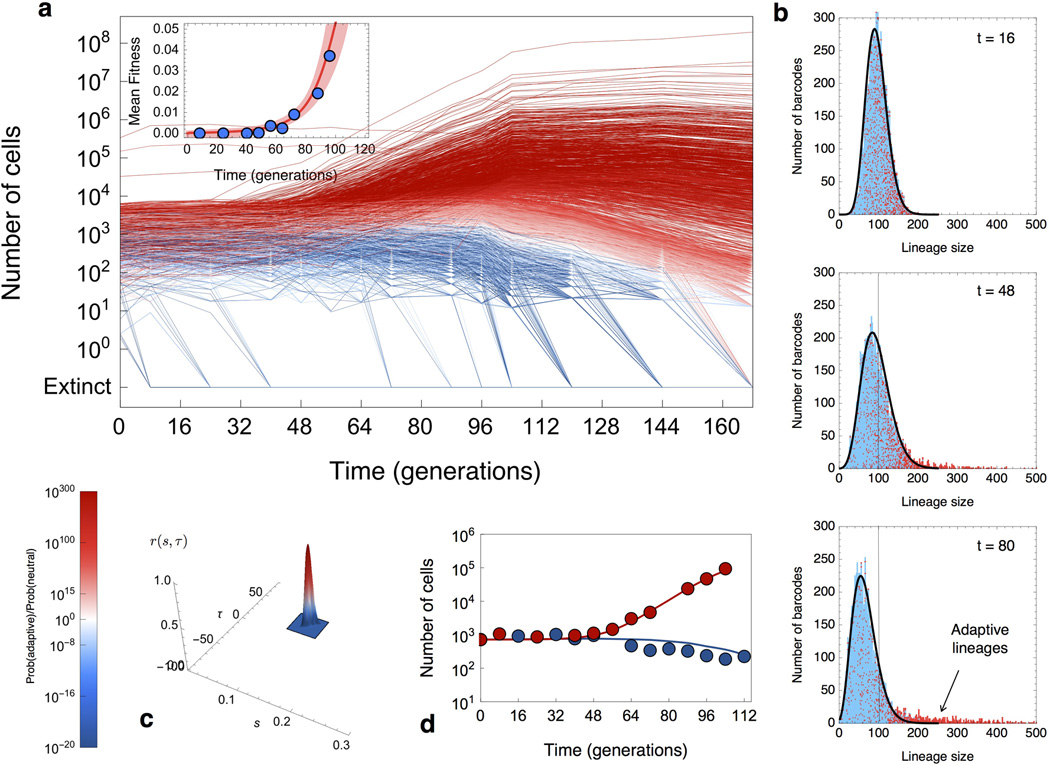
Plotting the relative frequency of each barcode over ~168 generations shows a reproducible pattern of population dynamics across replicates (Figure 2A and Extended Data 2A). Most lineages decline in frequency (blue lines, neutral lineages), but a modest fraction (~5%, see below) have acquired a beneficial mutation that established (red lines, adaptive lineages). At later time points, the growth of adaptive lineages attenuates as the population mean fitness increases (clonal interference)27.
Figure 2. Inferring the fitnesses and establishment times from lineage trajectories.

(a) Selected lineage trajectories from E1 colored according to the probability that they contain an established beneficial mutation. The decline of adaptive lineages at later times is caused by the increase of the population mean fitness (Inset). The population mean fitness is inferred from both the decline of neutral lineages (blue circles) and the growth of beneficial lineages (red line, SM 6.2). Shading indicates the error in mean fitness. The inferred fitnesses (b) and establishment times (c) from analysis of simulated trajectories correlate strongly with the known simulated values. (d) Scatter plot of the fitness of 33 clones picked from E2 at generation 88 inferred by sequencing and pairwise competition (coloring as in (a), with outliers lightened and excluded from correlation). Error bars are 1 standard deviation.
To calculate the probability that a lineage contains an adaptive mutation, one must differentiate between a trajectory that increases due to an adaptive event from one that increases due to genetic drift and measurement errors. Because either scenario is rare, the right-hand tail of the distribution of read numbers is particularly important. Thus, we characterized the full distribution of noise that results from drift and sampling errors due to DNA isolation, amplification and sequencing, (black curve, Extended Data 2B, SM 5). The decline in frequency of neutral lineages is used to infer the increase in mean fitness of the population4 (Figure 2A and Extended Data 2A and 2B).
Using our estimates of noise and the mean fitness, we calculate the probability that a trajectory is explained by a mutation with fitness effect, s, having an establishment time, τ, over a broad range of s and τ (under a uniform prior in τ and an exponential prior in s, Extended Data 2C). If this exceeds the probability that no beneficial mutation occurs, we define the lineage as adaptive, with the peak of the probability our best estimate of s and τ (SM 7). Estimates of s and τ for each adaptive lineage are combined to calculate a second measurement of the increase in mean fitness (Figure 2A and Extended Data 2A, insets). Our two methods to infer mean fitness agree, indicating that most lineages driving the mean fitness have been detected. Uncertainties in s and τ depend on the specific lineage trajectory; however, they are generally low (Δs ± 0.5%, Δτ ± 10 generations, SM 7.7).
To validate estimates of s and τ, we first analyzed a simulated data set with comparable levels of noise to our experiment (SM 12). We find a strong correlation between the known and inferred values for both s (R2 = 0.88 in Figure 2B) and τ (R2 = 0.93 in Figure 2C). Second, we picked 33 clones from generation 88 that belong to different adaptive lineages and performed pairwise competitive fitness assays on each (SM 2). We find a strong correlation between these two methods (R2 = 0.81, Figure 2D). Outliers (lightened data points) are likely due to a neutral cell being sampled from a lineage containing mostly adaptive cells. Other deviations could be due to interactions between adaptive lineages (i.e. frequency dependent fitness) or to multiple mutations on the same genome (SM 8).
In total, ~25,000 beneficial mutations with a fitness effect of >2% established before generation 112 in E1 (Figure 3A), a number that is roughly consistent with E2 (Extended Data Figure 3A) and simulated data (Figure S44, S45, SM 12). Adaptation occurs quickly: by generation 112 the population mean fitness is over 5% higher than the ancestor, with some lineages having a fitness advantage of >10%. E1 and E2 share 48 generations of common growth. During this time, ~6,000 lineages acquire a beneficial mutation that is sampled into, and establishes in, both replicates (Figure 3A and Extended Data Figure 3A, purple circles). We define these mutations as “pre-existing”: their presence is not an artifact of our experiment, but a general expectation for large populations grown from a single cell.
Figure 3. Fitness effects, establishment times, and population dynamics.

(a) Scatter plot of τ and s of all ~25,000 beneficial mutations (circles) identified in E1. Circle area represents the size of the lineage at generation 88. Purple circles indicate lineages with mutations that occurred in the period of common growth (t < 0) that were sampled into, and established in, E1 and E2. Green circles indicate lineages that were identified as adaptive in only one replicate and likely contain mutations that arose after t=0. Lines indicate the time limits before which mutations must occur in order to establish (large dash) or be observed (small dash). These limits trail the mean fitness (solid line) by ~1/s generations. (Inset) The spectrum of mutation rates, µ(s), as a function of fitness effect, s inferred from mutations that likely occurred after t=0 (SM 10.2). The y-axis is the mutation rate density, so the mutation rate to a range, Δs, is obtained by multiplying this by Δs. The total beneficial mutation rate to s>5% is inferred to be ~1 × 10⁻⁶ and is consistent across replicates. The observed spectrum is not exponential (gray line, with the error range shaded) (b) The distribution of the number of adaptive cells binned by their fitness over time. As the mean fitness (grey curtain) surpasses the fitness of a subpopulation, cells with that fitness begin to decline in frequency.
Beneficial mutation rates
To estimate the spectrum of beneficial mutation rates in the serial batch conditions, we consider only lineages that are identified as adaptive in one replicate but not the other (i.e. are unlikely to contain mutations that occurred before barcoding, SM9 and 10). Analyzing the total number of cells with each s yields the best estimate of the mutation rate spectrum (Figure 3A and Extended Data 3A, insets, and SM 11.1). These estimates are worse for fitness effects that have only occurred a few times. We find that beneficial mutations with s>5% occur at a rate of ~1×10⁻⁶ /cell /generation (SM 11.2, Figure 3A and Extended Data 3A, insets), a rate that is consistent across replicates. Using a fluctuation test28,29, we find that the ancestor to our barcoded strains has a spontaneous mutation rate in non-repeat regions of ~4×10⁻¹⁰ per nucleotide per generation (SM 1.7)30,31. This implies that mutations in ~0.04% of the genome, ~5,000 bases, confer beneficial fitness effects of >5%. This target size is broadly consistent with previous reports32,33, although it will certainly depend on the selective conditions. The beneficial mutation rate includes all events that have a heritable effect on fitness, and could include point mutations, indels, large genomic rearrangements or duplications, whole genome duplications, and possibly even heritable epigenetic modifications. Reported beneficial mutation rates depend on the range of fitness effects that can establish and be detected. For example, if we include lower fitness effect mutations that are mostly pre-existing (2%<s< 5%), we find a beneficial mutation rate that is ~50x higher. However, as we discuss below, the total beneficial mutation rate is not necessary for a predictive understanding of the evolutionary dynamics. Instead, knowledge of the rate of mutation to the range of fitness effects that drive the dynamics is what is needed.
Spectrum of mutation rates as a function of fitness effect
Several authors have used extreme value theory to predict that the spectrum of beneficial mutation rates is exponential34,35, with some experiments that sample small numbers of beneficial mutations supporting17,36,37 or contradicting38 this prediction. We do not find support for an exponential or even a monotonically decreasing distribution. Rather, most mutations we observe are confined to a narrow range of fitness effects (2%<s<5%). At larger fitnesses, the distribution is relatively flat with two slight peaks in the fitness ranges 7–8% and 10–11%, a feature that is consistent across replicates (Figure Figure 3A and Extended Data 3A, insets). Mutation rates to these two peaks are consistent with genomic target sizes of loss-of-function mutations for a single gene (~300 bases31); these have previously been shown to be adaptive in yeast grown in simple environments1,3,4,39. Weaker effect mutations (s < 2%), which are hard to detect because they are rapidly outcompeted before establishing, do not occur at high enough rates to impact the population dynamics (SM 9.3).
Distribution of establishment times, τ
For mutations that establish τ roughly corresponds to the time at which a beneficial mutation occurred, with an uncertainty of a few times 1/s due to variability in initial stochastic drift (SM 4.1). Establishment times are broadly distributed (−90<τ< 48). Lineages containing beneficial mutations with very negative τ (-90<τ<-40) are usually identified as adaptive in both replicates (Figure 3A and Extended Data Figure 3A, purple). Establishment times as negative as −90 generations are expected39 because of beneficial mutations that occur during the period of common growth (t<0, SM 10.1). Indeed the number of pre-existing beneficial mutations is broadly consistent with the beneficial mutation rate we infer (SM 10). We observe very few mutations with τ>48 for reasons we now discuss.
A beneficial mutation with a fitness effect s, that occurs in generation t will typically take another ~ 1/s generations to reach a size large enough to grow exponentially19. If before this time the mean fitness has increased by more than s, the mutation will decline in frequency and never grow exponentially. Thus, there is a time limit after which a beneficial mutation that occurs is unlikely to establish (Figure 3A and Extended Data 3A larger dashed lines). This time limit is shorter for smaller s for two reasons: (i) small s mutations must drift to higher numbers in order to establish, and (ii) the mean fitness of the population surpasses its fitness advantage in a shorter time. A mutation with s < 2% is therefore extremely unlikely to establish because this limit is reached quickly. Thus, a fundamental lower limit on which fitness-effects can establish emerges from the population dynamics.
In addition to establishing, beneficial mutations in our assay must also grow to a large enough number to be detectable above the number of neutral (ancestral) cells remaining in its lineage. This shortens the time window in which a beneficial mutation must occur to be observed (Figures 3A and Extended Data 3A, smaller dashed lines, SM 9). Beneficial mutations we are unable to detect (those occurring close to, or after, the time limit) never reach sizes much above their establishment number (1/s), are rapidly outcompeted, and typically go extinct. Such mutations are unlikely to have a significant impact on the population dynamics. Deleterious mutations are largely irrelevant here: given the mean fitness increases by a few percent in ~80 generations, a deleterious mutation will not rise to high frequency unless it occurs contemporaneously in a cell with a large beneficial mutation, and even then is unlikely to reach high frequencies40.
Overall population dynamics
Plotting the fitness distribution of all adaptive cells over time reveals that massive clonal interference underlies the population dynamics (Figure 3B and Extended Data 3B). Many beneficial mutations (~20,000 observed in E1, ~11,000 observed in E2) of small s (2%<s<5%, the “low fitness class”) drive the mean fitness early (t<72), but begin to be outcompeted by cells with larger s (~10%) that stem from fewer beneficial mutations (~5,000 in E1 and ~3,000 in E2). For the first ~80 generations the mean fitness trajectory in both replicates is strikingly similar (grey curtain, Figure 3B and Extended Data 3B and SM 6.5). However, by ~112 generations, the mean fitness is being driven by ~100 of the most beneficial mutations (s>10%). Because mutations to these higher fitness effects are rare, they display stochastic establishment times that lead to differences in the mean fitness between the two replicates at late times (SM 6.5). In E2, these higher fitness mutations happen to establish earlier, contributing to a quicker decline in the low fitness class, and fewer observed adaptive lineages overall. By generation ~132, we observe that the low fitness class has shrunk to a small fraction of the population. This, however, does not mean that cells in this class are inconsequential: they prevent mutations with even smaller s from establishing. Because they are so numerous early in the evolution, some cells in this class are likely to accumulate additional beneficial mutations whose expansion could enable them to eventually outcompete cells that initially acquired higher s mutations.
Fitness effects that drive the early evolutionary dynamics in this large population are a predictable consequence of the population size and spectrum of mutation rates. The range of s at the highest frequency at time t (those that are dominating the increase in mean fitness) are those that maximize st + log(µ(s)), with µ(s) being the mutation rate to s (SM, 11.1). That is, the most important fitness effects at a given time are determined by a balance between being sufficiently probable to have established multiple times and sufficiently fit to have grown to large cell numbers.
Adaptive lineages that accumulate an additional beneficial mutation in a cell with an existing beneficial mutation (double mutants), can impact the dynamics. However, double mutants are rare before ~168 generations because most single mutants are not yet present at high enough cell numbers to acquire a second mutation that establishes. We estimate that fewer than ~50 of the inferred values of s and τ are impacted by double mutants (~0.2% of all adaptive lineages, SM 4.5). Ecological changes in the environment caused by mutants can result in frequency-dependent selection and impact the evolutionary dynamics. But, over the time range used to infer fitnesses (up to ~100 generations) our observations are consistent with the simplifying assumption that beneficial mutations have frequency-independent fitness effects and thus subpopulations only interact via competition against the mean fitness (Figure 2A and Extended Data 2A, insets).
Discussion
Tracking a large number of small lineages provides a granular view of evolutionary dynamics that is not possible by other methods1–3. By focusing on sequencing just 0.002% of the genome, we gain almost five orders of magnitude in frequency resolution over genome sequencing approaches. This enables us to identify tens of thousands of independent beneficial mutations, some of which never reach frequencies above ~10−5. By contrast, our previous population sequencing approach, which detected mutations at frequencies above ~1%1, would have identified only ~15 adaptive lineages in this study (Figure 4, SM 9.4). Furthermore, barcode tracking yields estimates of the fitness effects and occurrence times for all changes that convey substantial fitness advantage, whether or not they are amenable to being identified via genome sequencing.
Figure 4. The need for high frequency resolution.

The fitness spectrum of adaptive lineages that could be identified at different frequency resolution thresholds.
Our results show that in an asexually evolving population of ~108 cells, a large number of independent beneficial mutations drive adaptation. While individually each mutation is rare and occurs stochastically, collectively they have a predictable impact on the population dynamics. In large populations therefore, the early evolutionary dynamics is almost deterministic: it only becomes stochastic when mutations so rare that they have occurred only a handful of times, or multiple mutations on the same genome, expand to an appreciable fraction of the population. Mutations with certain fitness effects play a far more important role in driving the dynamics than others, resulting in a subtle interplay between deterministic and stochastic effects.
High-resolution lineage tracking is a powerful tool to study many questions important to evolution. Using this system across many environmental regimes, perhaps for longer periods of time than in this work, the relationships between adaptation rate, environment, and ecology could be quantitatively studied. A potential limitation of lineage tracking is that barcode diversity will always diminish over time. However, the possibility of adding barcodes at different times over the course of an evolution could provide a means to overcome this.
Cancer and microbial infections can have population sizes up to ~1012 cells in a single individual, suggesting that massive clonal interference and complex population dynamics are likely to characterize disease progression and drug resistance41–44. While mutations that rise to high frequencies are often emphasized, much larger numbers of low frequency mutations could be at least as important for disease progression or drug resistance. To study these low-frequency mutations, barcode tracking could be implemented in pathogenic microbes, cancer cell lines, or even animal tumor models45–48. Indeed, lineage tracking has the potential to identify the treatment regimes that most effectively slow the rate of adaptation. By randomly picking clones and sequencing their barcodes, one can cheaply identify many clones belonging to independent adaptive lineages. By sequencing the genomes of these clones, the mutational determinants for a broad range of beneficial fitness effects can be discovered. In combination with whole genome sequencing, lineage tracking therefore offers a powerful method by which to characterize the mutational spectrum underlying evolution, disease progression and drug resistance.
Extended Data
Extended Data Figure 1. Total population size over time.
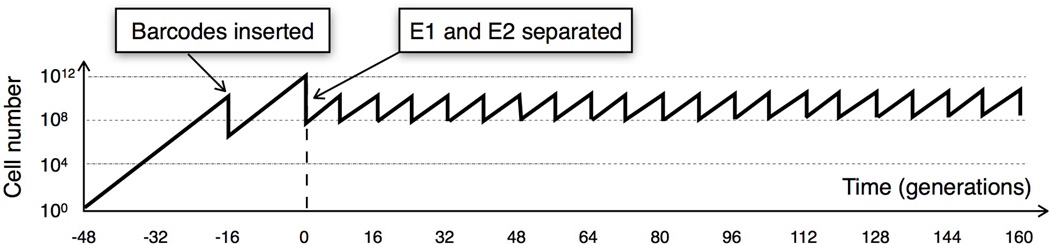
A single ancestral cell is grown for ~32 generations to ~1010 cells before barcodes are inserted. Cells that incorporate a barcode are grown for another 16 generations. The population is then divided into two replicates (E1 and E2) at t=0. Beneficial mutations that occurred prior to barcoding can be sampled into both replicates.
Extended Data Figure 2. Inferring the fitnesses and establishment times from lineage trajectories.
(a) Selected lineage trajectories and the mean fitness trajectory from replicate E2. (b) The distribution of lineage sizes over time, for lineages that begin with ~100+/− 2 cells (vertical line). Adaptive lineages (red) begin to expand above the neutral expectation (black curve) and push neutral lineages to lower cell numbers (blue). (c) The posterior probability distribution over s and τ for an adaptive lineage in E2 (d) The measured trajectory of this lineage in E1 (unadaptive, blue circles) and E2 (adaptive, red circles) compared with the predicted trajectory with largest probability in E1 (blue line) and E2 (red line).
Extended Data Figure 3. Fitness effects and establishment times for replicate E2.

(a) Scatter plot of τ and s of all ~14,000 beneficial mutations (circles) identified in E2. Circle area represents the size of the lineage at generation 88. Purple circles indicate lineages with mutations that occurred in the period of common growth (t < 0) that were sampled into, and established in, E1 and E2. Green circles indicate lineages that were identified as adaptive in only one replicate and likely contain mutations that arose after t=0. Lines indicate the time limits before which mutations must occur in order to establish (large dash) or be observed (small dash). These limits trail the mean fitness (solid line) by ~1/s generations. (Inset) The spectrum of mutation rates, µ(s), as a function of fitness effect, s inferred from mutations that likely occurred after t=0 (SM 10.2). The y-axis is the mutation rate density, so the mutation rate to a range, Δs, is obtained by multiplying this by Δs. The total beneficial mutation rate to s>5% is inferred to be ~1 × 10⁻⁶ and is consistent across replicates. The observed spectrum is not exponential (gray line, with the error range shaded) (b) The distribution of the number of adaptive cells binned by their fitness over time. As the mean fitness (grey curtain) surpasses the fitness of a subpopulation, cells with that fitness begin to decline in frequency.
Supplementary Material
Acknowledgments
The authors thank Mark Siegal, Katja Schwartz, Barbara Dunn, Mia Jaffe, Dan Kvitek, Joel Thompson, Diamantis Sellis, and Yuan Zhu for helpful discussions. We would like to acknowledge funding support from NIH grants R01 HG003328, 5-T32-HG-44-17 and R25 GM067110, NSF grants DMS-1120699 and PHY-1305433, Bio-X IIP6-63 grant from Stanford University, Betty Moore Foundation grant no. 2919, and The Louis and Beatrice Laufer Center.
Footnotes
Contributions
S.F.L. conceived of the barcoding system. S.F.L and G.S. designed the barcoding system and evolution experiments. S.F.L, J.R.B., D.A.P., G.S., and D.S.F developed the project vision. S.F.L performed the barcoding and evolution experiments. S.V and D.A.P designed the pairwise competition assays. S.V. performed the pairwise competition assays. J.R.B and D.S.F developed theory and analyzed the data. J.R.B and S.F.L. wrote the paper. All authors edited the paper.
References
- 1.Kvitek DJ, Sherlock G. Whole genome, whole population sequencing reveals that loss of signaling networks is the major adaptive strategy in a constant environment. PLoS Genet. 2013;9:e1003972. doi: 10.1371/journal.pgen.1003972. [DOI] [PMC free article] [PubMed] [Google Scholar]
- 2.Herron MD, Doebeli M. Parallel evolutionary dynamics of adaptive diversification in Escherichia coli. PLoS Biol. 2013;11:e1001490. doi: 10.1371/journal.pbio.1001490. [DOI] [PMC free article] [PubMed] [Google Scholar]
- 3.Lang GI, et al. Pervasive genetic hitchhiking and clonal interference in forty evolving yeast populations. Nature. 2013;500:571–574. doi: 10.1038/nature12344. [DOI] [PMC free article] [PubMed] [Google Scholar]
- 4.Lang GI, Botstein D, Desai MM. Genetic variation and the fate of beneficial mutations in asexual populations. Genetics. 2011;188:647–661. doi: 10.1534/genetics.111.128942. [DOI] [PMC free article] [PubMed] [Google Scholar]
- 5.Ding L, et al. Genome remodelling in a basal-like breast cancer metastasis and xenograft. Nature. 2010;464:999–1005. doi: 10.1038/nature08989. [DOI] [PMC free article] [PubMed] [Google Scholar]
- 6.Shah SP, et al. Mutational evolution in a lobular breast tumour profiled at single nucleotide resolution. Nature. 2009;461:809–813. doi: 10.1038/nature08489. [DOI] [PubMed] [Google Scholar]
- 7.Mardis E, Ding L, Dooling D, Larson D, McLellan M. Recurring Mutations Found by Sequencing an Acute Myeloid Leukemia Genome. New England Journal of Medicine. 2009;11:361. doi: 10.1056/NEJMoa0903840. [DOI] [PMC free article] [PubMed] [Google Scholar]
- 8.International Cancer Genome Consortium et al. International network of cancer genome projects. Nature. 2010;464:993–998. doi: 10.1038/nature08987. [DOI] [PMC free article] [PubMed] [Google Scholar]
- 9.Pleasance ED, et al. A comprehensive catalogue of somatic mutations from a human cancer genome. Nature. 2010;463:191–196. doi: 10.1038/nature08658. [DOI] [PMC free article] [PubMed] [Google Scholar]
- 10.Weinreich DM, Delaney NF, DePristo MA, Hartl DL. Darwinian evolution can follow only very few mutational paths to fitter proteins. Science. 2006;312:111–114. doi: 10.1126/science.1123539. [DOI] [PubMed] [Google Scholar]
- 11.Young BC, et al. Evolutionary dynamics of Staphylococcus aureus during progression from carriage to disease. PNAS. 2012;109:4550–4555. doi: 10.1073/pnas.1113219109. [DOI] [PMC free article] [PubMed] [Google Scholar]
- 12.Holden MTG, et al. A genomic portrait of the emergence, evolution, and global spread of a methicillin-resistant Staphylococcus aureus pandemic. Genome Res. 2013;23:653–664. doi: 10.1101/gr.147710.112. [DOI] [PMC free article] [PubMed] [Google Scholar]
- 13.Desai MM, Walczak AM, Fisher DS. Genetic diversity and the structure of genealogies in rapidly adapting populations. Genetics. 2013;193:565–585. doi: 10.1534/genetics.112.147157. [DOI] [PMC free article] [PubMed] [Google Scholar]
- 14.Neher RA, Hallatschek O. Genealogies of rapidly adapting populations. PNAS. 2013;110:437–492. doi: 10.1073/pnas.1213113110. [DOI] [PMC free article] [PubMed] [Google Scholar]
- 15.Hegreness M, Shoresh N, Hartl D, Kishony R. An equivalence principle for the incorporation of favorable mutations in asexual populations. Science. 2006;311:1615–1617. doi: 10.1126/science.1122469. [DOI] [PubMed] [Google Scholar]
- 16.Kao KC, Sherlock G. Molecular characterization of clonal interference during adaptive evolution in asexual populations of Saccharomyces cerevisiae. Nature Genetics. 2008;40:1499–1504. doi: 10.1038/ng.280. [DOI] [PMC free article] [PubMed] [Google Scholar]
- 17.Imhof M, Schlötterer C. Fitness effects of advantageous mutations in evolving Escherichia coli populations. Proc. Natl. Acad. Sci. U.SA. 2001;98:1113–1117. doi: 10.1073/pnas.98.3.1113. [DOI] [PMC free article] [PubMed] [Google Scholar]
- 18.Gerrits A, et al. Cellular barcoding tool for clonal analysis in the hematopoietic system. Blood. 2010;115:2610–2618. doi: 10.1182/blood-2009-06-229757. [DOI] [PubMed] [Google Scholar]
- 19.Desai MM, Fisher DS. Beneficial mutation selection balance and the effect of linkage on positive selection. Genetics. 2007;176:1759–1798. doi: 10.1534/genetics.106.067678. [DOI] [PMC free article] [PubMed] [Google Scholar]
- 20.Charlesworth B. The good fairy godmother of evolutionary genetics. Curr. Biol. 1996;6:220. doi: 10.1016/s0960-9822(02)00457-8. [DOI] [PubMed] [Google Scholar]
- 21.Berns K, et al. A large-scale RNAi screen in human cells identifies new components of the p53 pathway. Nature. 2004;428:431–437. doi: 10.1038/nature02371. [DOI] [PubMed] [Google Scholar]
- 22.Smith AM, et al. Quantitative phenotyping via deep barcode sequencing. Genome Res. 2009;19:1836–1842. doi: 10.1101/gr.093955.109. [DOI] [PMC free article] [PubMed] [Google Scholar]
- 23.Lu R, Neff NF, Quake SR, Weissman IL. Tracking single hematopoietic stem cells in vivo using high-throughput sequencing in conjunction with viral genetic barcoding. Nat Biotechnol. 2011;29:928–933. doi: 10.1038/nbt.1977. [DOI] [PMC free article] [PubMed] [Google Scholar]
- 24.Blundell JR, Levy SF. Beyond genome sequencing: Lineage tracking with barcodes to study the dynamics of evolution, infection, and cancer. Genomics. 2014 doi: 10.1016/j.ygeno.2014.09.005. [DOI] [PubMed] [Google Scholar]
- 25.Sternberg N, Hamilton D. Bacteriophage P1 site-specific recombination. Journal of Molecular Biology. 1981;150:467–486. doi: 10.1016/0022-2836(81)90375-2. [DOI] [PubMed] [Google Scholar]
- 26.Austin S, Ziese M, Sternberg N. A novel role for site-specific recombination in maintenance of bacterial replicons. Cell. 1981;25:729–736. doi: 10.1016/0092-8674(81)90180-x. [DOI] [PubMed] [Google Scholar]
- 27.Gerrish PJ, Lenski RE. The fate of competing beneficial mutations in an asexual population. Genetica. 1998;102–103:127–144. [PubMed] [Google Scholar]
- 28.Luria SE, Delbrück M. Mutations of Bacteria from Virus Sensitivity to Virus Resistance. Genetics. 1943;28:491–511. doi: 10.1093/genetics/28.6.491. [DOI] [PMC free article] [PubMed] [Google Scholar]
- 29.Lang GI, Murray AW. Estimating the per-base-pair mutation rate in the yeast Saccharomyces cerevisiae. Genetics. 2008;178:67–82. doi: 10.1534/genetics.107.071506. [DOI] [PMC free article] [PubMed] [Google Scholar]
- 30.Lynch M, et al. A Genome-Wide View of the Spectrum of Spontaneous Mutations in Yeast. Proceedings of the National Academy of Sciences of the United States of America. 2008;105:9272–9277. doi: 10.1073/pnas.0803466105. [DOI] [PMC free article] [PubMed] [Google Scholar]
- 31.Zhu YO, Siegal ML, Hall DW, Petrov DA. Precise estimates of mutation rate and spectrum in yeast. PNAS. 2014;111:E2310–E2318. doi: 10.1073/pnas.1323011111. [DOI] [PMC free article] [PubMed] [Google Scholar]
- 32.Joseph SB, Hall DW. Spontaneous mutations in diploid Saccharomyces cerevisiae: more beneficial than expected. Genetics. 2004;168:1817–1825. doi: 10.1534/genetics.104.033761. [DOI] [PMC free article] [PubMed] [Google Scholar]
- 33.Desai MM, Fisher DS, Murray AW. The speed of evolution and maintenance of variation in asexual populations. Curr. Biol. 2007;17:385–394. doi: 10.1016/j.cub.2007.01.072. [DOI] [PMC free article] [PubMed] [Google Scholar]
- 34.Gillespie JH. Molecular evolution over the mutational landscape. Evolution. 1984;38:1116. doi: 10.1111/j.1558-5646.1984.tb00380.x. [DOI] [PubMed] [Google Scholar]
- 35.Orr HA. The distribution of fitness effects among beneficial mutations. Genetics. 2003;163:1519–1526. doi: 10.1093/genetics/163.4.1519. [DOI] [PMC free article] [PubMed] [Google Scholar]
- 36.Kassen R, Bataillon T. Distribution of fitness effects among beneficial mutations before selection in experimental populations of bacteria. Nat Genet. 2006;38:484–488. doi: 10.1038/ng1751. [DOI] [PubMed] [Google Scholar]
- 37.Rokyta DR, Joyce P, Caudle SB, Wichman HA. An empirical test of the mutational landscape model of adaptation using a single-stranded DNA virus. Nat Genet. 2005;37:441–444. doi: 10.1038/ng1535. [DOI] [PubMed] [Google Scholar]
- 38.Rokyta DR, et al. Beneficial fitness effects are not exponential for two viruses. J. Mol. Evol. 2008;67:368–376. doi: 10.1007/s00239-008-9153-x. [DOI] [PMC free article] [PubMed] [Google Scholar]
- 39.Gresham D, et al. The repertoire and dynamics of evolutionary adaptations to controlled nutrient-limited environments in yeast. PLoS Genet. 2008;4:e1000303. doi: 10.1371/journal.pgen.1000303. [DOI] [PMC free article] [PubMed] [Google Scholar]
- 40.Good BH, Rouzine IM, Balick DJ, Hallatschek O, Desai MM. Distribution of fixed beneficial mutations and the rate of adaptation in asexual populations. PNAS. 2012;109:4950–4955. doi: 10.1073/pnas.1119910109. [DOI] [PMC free article] [PubMed] [Google Scholar]
- 41.Salmon SE, Smith BA. Immunoglobulin synthesis and total body tumor cell number in IgG multiple myeloma. The Journal of Clinical Investigation. 1970;49:1114–1121. doi: 10.1172/JCI106327. [DOI] [PMC free article] [PubMed] [Google Scholar]
- 42.Michaelson JS, et al. Predicting the survival of patients with breast carcinoma using tumor size. Cancer. 2002;95:713–723. doi: 10.1002/cncr.10742. [DOI] [PubMed] [Google Scholar]
- 43.König C, Simmen HP, Blaser J. Bacterial concentrations in pus and infected peritoneal fluid--implications for bactericidal activity of antibiotics. J. Antimicrob. Chemother. 1998;42:227–232. doi: 10.1093/jac/42.2.227. [DOI] [PubMed] [Google Scholar]
- 44.Wilson ML, Gaido L. Laboratory Diagnosis of Urinary Tract Infections in Adult Patients. Clin Infect Dis. 2004;38:1150–1158. doi: 10.1086/383029. [DOI] [PubMed] [Google Scholar]
- 45.Thomas CE, Ehrhardt A, Kay MA. Progress and problems with the use of viral vectors for gene therapy. Nat. Rev. Genet. 2003;4:346–358. doi: 10.1038/nrg1066. [DOI] [PubMed] [Google Scholar]
- 46.Bushman F, et al. Genome-wide analysis of retroviral DNA integration. Nat. Rev. Microbiol. 2005;3:848–858. doi: 10.1038/nrmicro1263. [DOI] [PubMed] [Google Scholar]
- 47.Ran FA, et al. Double Nicking by RNA-Guided CRISPR Cas9 for Enhanced Genome Editing Specificity. Cell. 2013;154:1380–1389. doi: 10.1016/j.cell.2013.08.021. [DOI] [PMC free article] [PubMed] [Google Scholar]
- 48.Mali P, et al. RNA-guided human genome engineering via Cas9. Science. 2013;339:823–826. doi: 10.1126/science.1232033. [DOI] [PMC free article] [PubMed] [Google Scholar]
- 49.Kivioja T, et al. Counting absolute numbers of molecules using unique molecular identifiers. Nat. Methods. 2012;9:72–74. doi: 10.1038/nmeth.1778. [DOI] [PubMed] [Google Scholar]
- 50.Lundberg DS, Yourstone S, Mieczkowski P, Jones CD, Dangl JL. Practical innovations for high-throughput amplicon sequencing. Nat. Methods. 2013;10:999–1002. doi: 10.1038/nmeth.2634. [DOI] [PubMed] [Google Scholar]
Associated Data
This section collects any data citations, data availability statements, or supplementary materials included in this article.