

I respond to Williams and Shattuck's comments regarding the importance of eusociality on the longevity of fossorial species [1]. Williams and Shattuck extend our analysis [2] by compiling further data on fossorial and terrestrial mammals (less than 60 kg) and including eusociality as an additional factor in their analyses. They find that both eusociality and fossoriality are associated with increased maximum longevity in mammals after accounting for phylogenetic autocorrelation. We welcome these analyses by Williams and Shattuck as they bring helpful insights with regards to the drivers of longevity. In their comment, Williams and Shattuck also suggest that additional analyses may further distinguish between these competing hypotheses. In response to this point, I re-analyse the dataset compiled by them while, further to accounting for non-independence owing to shared ancestry, also accounting for variation associated with phylogeny inference. I show that eusociality but not fossoriality is associated with increased maximum longevity in mammals.
To carry out this analysis, I use the same approach as previously [3,4]. I selected a distribution of 25 randomly chosen trees from Kuhn et al. [4] and treated them as equivalent to a Bayesian posterior distribution of trees. I used the data collated by Williams and Shattuck [1] and log10 transformed both maximum longevity and body mass before mean centring and expressing the data in units of standard deviation. These data, as defined by Williams and Shattuck [1], include a classification of eusociality, as determined by reproductive skew, and habitat, categorized as terrestrial (including occasional burrowers that burrow only to construct nests for offspring or those that use shallow, simple burrows, in addition to terrestrial mammals that do not burrow) and fossorial (including mammals that spend time above ground but shelter in sealed or complex burrows, in addition to subterranean mammals that spend the majority of time underground). Using the MCMCglmm package [5] in R v. 3.0.2 [6], I fit a model of the form of
| 1 |
The number of iterations (5.1 × 10⁶), thinning (2500) and burn-in period (1 × 10⁵) were determined using the coda package [7]. I used the same uninformative prior as in our previous paper [2], whereas convergence was tested using the Gelman–Rubin statistic [8]. All code is available as part of the mulTree package [3].
In line with Williams and Shattuck, I found that eusocial species live longer than non-eusocial species of similar body mass (table 1). However, in contrast to results of Williams and Shattuck and our original paper [2], I find no correlation between fossoriality and lifespan (table 1).
Table 1.
Relationship between maximum longevity (months), body mass (g), sociality (eusocial or non-eusocial) and habitat (fossorial or terrestrial) in mammals. Estimates are modal estimates from 25 models. Lower CI, lower 95% credibility interval from 25 models. Upper CI, upper 95% credibility interval from 25 models. Posterior distribution, distribution of estimates from 25 models. 5 100 000 iterations with 100 000 burn-in and thinning interval of 2500.
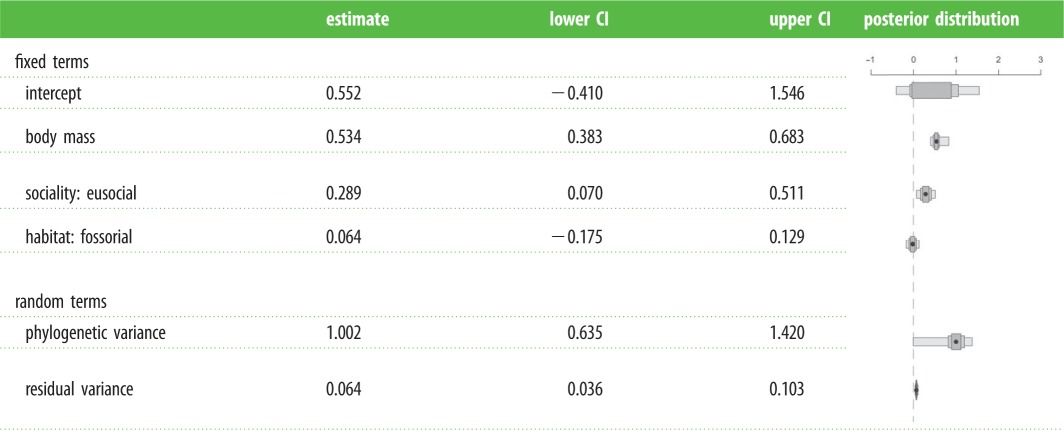 |
As previously noted by Williams and Shattuck, the predicted association between eusociality and increased longevity is expected through the reduction of extrinsic mortality of breeding individuals in eusocial groups. While previous studies have not shown an association between cooperative breeding and maximum longevity in mammals [9] and birds [10], these results suggest that eusociality in mammals, as defined by Williams and Shattuck, is strongly associated with increased lifespans.
Although fossoriality is also expected to increase maximum longevity, through decreased extrinsic mortality, I find no association between increased longevity and fossoriality in this dataset. Even after accounting for body size and eusociality, the aardvark (Orycteropus afer) is the only mammal with fossorial tendencies included in the top 5% of residuals. Conversely, four species with fossorial tendencies are found in the bottom 5% residuals: three pocket mice (Perognathus longimembris, Perognathus flavescens, Perognathus flavus) and the common shrew (Sorex araneus).
Williams and Shattuck's work helpfully extends our analysis to include eusociality; however, the lack of correlation between fossoriality and longevity in this dataset requires further attention given the predicted reduction of extrinsic mortality associated with burrowing. Analysis of fossorial species in other groups such as reptiles, along with the inclusion of more detailed life-history data, may yield more insights into the role of fossoriality in life-history evolution.
Acknowledgements
I thank Natalie Copper, Andrew Jackson, Thomas Guillerme, Sive Finlay, Adam Kane, Seán Kelly and Deirdre McClean for reading over this reply and providing helpful comments and suggestions.
Footnotes
The accompanying comment can be viewed at http://dx.doi.org/10.1098/rspb.2014.1664.
Funding statement
Funding was provided by the Earth and Natural Sciences (ENS) Doctoral Studies Programme, funded by the Higher Education Authority (HEA) through the Programme for Research at Third Level Institutions, Cycle 5 (PRTLI-5), co-funded by the European Regional development Fund (ERDF).
References
- 1.Williams SA, Shattuck MR. 2015. Ecology, longevity and naked mole-rats: confounding effects of sociality? Proc. R. Soc. B 282, 20141664 ( 10.1098/rspb.2014.1664) [DOI] [PMC free article] [PubMed] [Google Scholar]
- 2.Healy K, et al. 2014. Ecology and mode-of-life explain lifespan variation in birds and mammals. Proc. R. Soc. B 281, 20140298 ( 10.1098/rspb.2014.0298) [DOI] [PMC free article] [PubMed] [Google Scholar]
- 3.Guillerme T, Healy K. 2014. mulTree: a package for running MCMCglmm analysis on multiple trees ( 10.5281/zenodo.12902) [DOI]
- 4.Kuhn TS, Mooers AØ, Thomas GH. 2011. A simple polytomy resolver for dated phylogenies. Methods Ecol. Evol. 2, 427–436. ( 10.1111/j.2041-210X.2011.00103.x) [DOI] [Google Scholar]
- 5.Hadfield JD. 2010. MCMC methods for multi-response generalized linear mixed models: the MCMCglmm R package. J. Stat. Softw. 33, 1–22.20808728 [Google Scholar]
- 6.R Core Team. 2013. A language and environment for statistical computing. Vienna, Austria: R Foundation for Statistical Computing. [Google Scholar]
- 7.Plummer M, Best N, Cowles K, Vines K. 2006. CODA: convergence diagnosis and output analysis for MCMC. R News 6, 7–11. [Google Scholar]
- 8.Gelman A, Rubin DB. 1992. Inference from iterative simulation using multiple sequences. Stat. Sci. 7, 457–472. ( 10.1214/ss/1177011136) [DOI] [Google Scholar]
- 9.Lukas D, Clutton-Brock T. 2012. Life histories and the evolution of cooperative breeding in mammals. Proc. R. Soc. B 279, 4065–4070. ( 10.1098/rspb.2012.1433) [DOI] [PMC free article] [PubMed] [Google Scholar]
- 10.Beauchamp G. 2014. Do avian cooperative breeders live longer? Proc. R. Soc. B 281, 20140844 ( 10.1098/rspb.2014.0844) [DOI] [PMC free article] [PubMed] [Google Scholar]