

Abstract
Becker muscular dystrophy (BMD) is a variant of dystrophin deficiency resulting from DMD gene mutations. Phenotype is variable with loss of ambulation in late teenage or late mid-life years. There is currently no treatment for this condition. In this BMD proof-of-principle clinical trial, a potent myostatin antagonist, follistatin (FS), was used to inhibit the myostatin pathway. Extensive preclinical studies, using adeno-associated virus (AAV) to deliver follistatin, demonstrated an increase in strength. For this trial, we used the alternatively spliced FS344 to avoid potential binding to off target sites. AAV1.CMV.FS344 was delivered to six BMD patients by direct bilateral intramuscular quadriceps injections. Cohort 1 included three subjects receiving 3 × 10¹¹ vg/kg/leg. The distance walked on the 6MWT was the primary outcome measure. Patients 01 and 02 improved 58 meters (m) and 125 m, respectively. Patient 03 showed no change. In Cohort 2, Patients 05 and 06 received 6 × 10¹¹ vg/kg/leg with improved 6MWT by 108 m and 29 m, whereas, Patient 04 showed no improvement. No adverse effects were encountered. Histological changes corroborated benefit showing reduced endomysial fibrosis, reduced central nucleation, more normal fiber size distribution with muscle hypertrophy, especially at high dose. The results are encouraging for treatment of dystrophin-deficient muscle diseases.
Introduction
Becker muscular dystrophy (BMD) is a clinical variant of dystrophin deficiency of muscle caused by a DMD gene mutation. The clinical course of BMD is milder compared to Duchenne muscular dystrophy (DMD), but there is wide variability in phenotype. There may be a delay in motor development, however in most cases reported symptoms relate to participation in sports in early teenage years. Lost ambulation is a major milestone that occurs in the fourth or fifth decade, although wheelchair independence may be preserved until after age 60.1 Cardiomyopathy is often the cause of death in BMD related to severe left ventricular dilation with reduced ejection fraction, complicated by life-threatening arrhythmias.2 The majority of BMD patients have deletions of the DMD gene, estimated at a frequency of 80%.3 Other BMD causing mutations include missense mutations,4 exon duplications,5 and even out-of-frame exon deletions or nonsense mutations that predict no significant dystrophin translation.6,7 Attempts to define the clinical course by dystrophin on muscle biopsy have been disappointing.8,9
For clinical trials, there is consensus that distinction of BMD from DMD relies not on the specific mutation or dystrophin protein levels on muscle biopsy, but rather on the ability to maintain ambulation beyond age 16 years.7,10,11 Another key feature of the ambulatory BMD patient is the targeted weakness of the quadriceps muscles (knee extensors).10,12,13 This can be relatively selective, so much so that it manifests as a form fruste, referred to as quadriceps myopathy.14 Often it is this selective lower extremity weakness that predisposes patients to frequent falls and is a key determinate in maintaining independent ambulation. Increasing muscle strength in BMD is challenging and no treatment modality has been identified.15,16 Of interest, the benefit of glucocorticoids as demonstrated for the dystrophinopathy in the DMD population has not proved effective in BMD.17 In the current clinical trial, a potential strategy to achieve a clinically meaningful effect on muscle health and strength was applied to BMD through inhibition of the myostatin pathway. Extensive studies in the mdx mouse18 and in nonhuman primates19 supported this approach, demonstrating significant increases in strength by delivery of follistatin (FS) using adeno-associated virus (AAV). FS has been shown to function as a potent myostatin antagonist with the additional benefit of controlling muscle mass through pathways independent of the myostatin signaling cascade.20 There are two isoforms of follistatin generated by alternative splicing and initially translated to isoforms FS317 and FS344.21 Posttranslational modification of each cleaves a 29 amino acid signal peptide giving rise to FS288 and FS315. FS288 functions collaboratively in reproductive physiology with activin and inhibins of the hypothalamic pituitary-gonadal axis.22 FS315 more reliably targets skeletal muscle, has no known cardiotoxicity or other adverse effects and is ideal for gene delivery to muscle.
AAV1.CMV.FS344 delivered by direct intramuscular injection to quadriceps and tibialis anterior muscles of the mdx mouse increased muscle mass and strength throughout the lower extremities with a demonstrable remote effect on these same parameters in the upper limbs and increased muscle mass in the paraspinal muscles.18 This we attributed to the muscle acting as a secretory site for follistatin with the circulating isoform reaching remote sites.23 AAV1.CMV.FS344 was further tested in the nonhuman primate to explore a paradigm applicable to clinical trial. In the cynomolgus macaque, we injected AAV1.FS344 directly into the quadriceps muscle resulting in an increase in size and strength of this muscle.19 These preclinical studies in the absence of toxicity enabled a phase 1/2a clinical trial in patients with BMD (IND 14845).
Results
Patient characteristics and response to treatment
Six male BMD patients were treated according to a dose-ascending gene therapy regimen (Table 1). This was a single site study conducted at Nationwide Children's Hospital. Enrolled subjects were ambulatory with knee extensor muscle weakness greater than 2 SDs below age expectations.24 Participants were not on any immunosuppressive therapy at the time of recruitment, but were placed on prednisone 1 month prior to AAV1.CMV.FS344 injections as a precaution against an immune response to AAV capsid, as previously found in human clinical trials.25,26,27 Prednisone dosing remained the same for ~1 month postinjection and was tapered off by day 60 postgene delivery. T cell responses towards AAV1 capsid and follistatin were assessed by IFN-γ ELISpot assay and were <50 spot forming cells/million PBMCs for each participant upon enrollment. Serum neutralizing antibody titers to AAV1 were assessed by ELISA and were below 1:50 at the start of the study and monitored according to a previously published clinical trial schedule.26,27 Muscle biopsies were performed 30 days prior to administration of AAV1.CMV.FS344 as a baseline histopathological assessment of muscle with a follow up biopsy on the opposite extremity at day 180 postgene transfer. The extremity undergoing initial biopsy was chosen by a randomization table and taken from the proximal vastus lateralis, thus determining the postbiopsy site in the opposite extremity targeting the same head of the quadriceps. Serum chemistry/hematology batteries were assessed at baseline, days 7, 14, 30, 60, 90, 180, and 1 year to evaluate for adverse effects due to gene transfer and included: complete blood count, liver function studies, kidney function (cystatin C),28 amylase, creatine kinase, and serum hormones (FSH, LH, testosterone, estrogen).
Table 1. Characteristics of becker muscular dystrophy patients enrolled in trial.
Cohort 1 included three ambulatory subjects, ages 30, 35, and 37 (34 ± 3.6), genetically diagnosed with in-frame DMD gene mutations. Subjects in this cohort received 3 × 10¹¹ vg/kg/leg (total 6e11 vg/kg/patient) delivered to three of the four muscle groups of the quadriceps: the vastus lateralis (VL), rectus femoris (RF), and vastus medialis (VM). Four injections were delivered per muscle, each with the guidance of ultrasonography and a MyoJect Luer Lock EMG needle. This first cohort has now been followed for 1 year postgene delivery (Figure 1). In two subjects, improvement on the 6MWT was robust: Patient 01 improved by 58 meters (m), and Patient 02 by 125 m. Patient 03 improved modestly, with an increase of 9 m; however, we would not consider this outside the range of variability for the BMD population, based on previous clinical experience. Although, no comparative natural history data of the 6MWT in BMD patients is available, substantial increases in 6MWT as observed in our subjects would not be predicted over the course of 1 year in untreated BMD patients.
Figure 1.
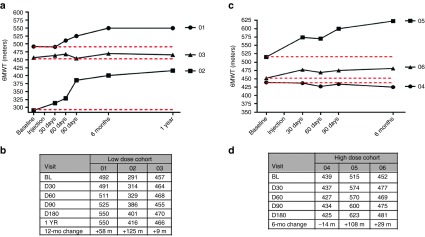
Distance walked in 6-minute walk test (6MWT) following follistatin gene therapy. (a) Distance walked in meters in the 6MWT for subjects receiving AAV1.CMV.FS344 in each leg (3 × 10¹¹ vg/kg/leg) with follow up for 1 year. A stippled red line shows the baseline for each patient. Patients are numbered consecutively based on treatment at ~4–6 week intervals. (b) The table shows the exact distances at each time point from baseline (BL) to 1 year. The “12-mo change” indicates the distance walked compared to BL. (c) Distance walked in meters in the 6MWT for subjects receiving AAV1.CMV.FS344 in each leg (6 × 10¹¹ vg/kg/leg) with follow up for 6 months. (d) The table again shows the exact distances at each time point from baseline (BL) to 6 months. The “6-mo change” indicates the distance walked compared to BL. D, day.
Furthermore, the improvement in walk distance in patient's 01 and 02 cannot be attributed to prednisone, since they had completely stopped the drug by day 90, while strength peaked at day 180 and was maintained throughout the remainder of the clinical trial. There were no significant adverse events during this trial that were related to gene transfer (Supplementary Table S1). No abnormalities were noted in any organ system assessment of liver, kidney, or bone marrow, and pituitary-gonadal hormone levels (FSH, LH, estrogen, testosterone (Supplementary Figure S1)) remained normal throughout the trial. Assessment of the IFN-γ ELISpot assay for T-cell immune responses to AAV1 capsid or follistatin showed no consistent or predictable response related to T-cell immunity between patients (Figure 2). Of particular note, Patient 03 who achieved the least benefit in this cohort from gene transfer showed virtually no increase in T-cell immunity throughout year 1, while Patient 02 showed an increase in T cells targeting AAV1, and patient 01 showed increased T cells to follistatin. Serum anti-follistatin antibody levels were never elevated above pretreatment levels (remained below 1:50 titer) in Cohort 1.
Figure 2.

Interferon-gamma (IFN-γ) ELISpot assays. The T cell immune responses to AAV1 capsid and follistatin are shown for each patient throughout the clinical trial. Spot forming cells (SFCs) per million peripheral blood mononuclear cells (PBMCs) are shown on the Y-axis, and days postinfection (dpi) on X-axis.
Based on the safety of Cohort 1, an additional three BMD patients were enrolled in the ascending dose trial. Cohort 2 included ambulatory subjects ages 24, 30, and 34 (29 ± 5.0) with in-frame DMD gene mutations (Table 1). The dose for this group was increased to 6 × 10¹¹ vg/kg/leg (1.2e12 vg/kg/patient). Gene delivery followed the paradigm described for the first cohort with delivery to the three major groups of the quadriceps: VL, RF, and VM. These three patients (04, 05, and 06) have now been followed for 6 months and the results of the 6MWT are shown in Figure 1. It is likely that Cohort 2 subjects have received maximum benefit from gene transfer based on findings in the first cohort. Subject one of Cohort 2 (Patient 04) showed the least benefit of any patient in the trial. There was a decrease in the 6MWT by 14 m. The other two patients in this cohort improved their walking distance. Patient 05 increased by 108 m, and Patient 06 by 29 m, with improvements found as early as 1 month postgene delivery and maintained over 6 months.
In neither cohort did we find a consistent increase in quadriceps muscle strength following AAV.FS344 gene transfer. This finding follows a pattern we encountered in our clinical trial of eteplirsen for exon skipping where we also showed functional benefit in the 6MWT without increasing quadriceps strength over a similar duration of study.29 We believe that muscle fibrosis is a barrier to increasing quantitative measures of muscle strength in single muscle groups, accounting for the poor correlation. The success we report here is related to follistatin gene therapy targeting a composite group of muscles contributing to the results of 6MWT because of the remote effect of secretion following FS344 transduced muscle fibers. Remote effects of AAV1.CMV.FS344 were apparent in preclinical studies in both mice and nonhuman primates.18,19 Another factor contributing to outcomes was predicted by McDonald et al suggesting that longer duration studies may be necessary to increase absolute values of strength by myometry.30
In Cohort 2 subjects as in the low dose subjects, no significant adverse events were encountered (Supplementary Table S1), serum chemistries and hormone levels (Supplementary Figure S1) remained normal, and there was there was no consistent pattern of T-cell immunity specific to AAV capsid pool as evaluated by ELISpot assays (Figure 2). Patient 06 showed early and significant elevation of immune response to follistatin that was not present prior to gene transfer. Serum anti-follistatin antibody levels in Cohort 2 remained below 1:50 titers.
Gross examination and MRI results
Our goal at the conceptualization of this clinical trial was to diffusely and symmetrically increase the size of the quadriceps muscle. Muscle hypertrophy was an outcome we had seen in mice and nonhuman primate studies injected with AAV1.CMV.FS344, in a manner that extended well beyond the specific sites of injection.18,19 In the cynomolgus macaque, each of the three major muscles of the quadriceps (VL, RF, and VM) received a single injection. Follistatin secretion from transduced muscle at the site of injection reached remote sites. In the clinical trial, we compensated for the larger muscle mass by distributing four injections to each of three major muscle groups of the quadriceps. However, despite ultrasound-guided injections designed to target muscle and avoid regions of muscle fibrosis, this was only possible up to a degree. Two subjects with strikingly different degrees of muscle fibrosis illustrate the challenge (Figure 3a–d) of effectively delivering AAV1.CMV.FS344 to muscle. For example, Patient 06 (Figure 3a,b) showed significant improvement in 6MWT (108 m) and had less muscle fibrosis compared to Patient 03 (Figure 3c,d) who exhibited no significant improvement in the 6MWT (9 m). Subsequent analysis using an MRI-based grading scale applied to thigh muscles at the time of enrollment confirmed fibrosis as a major obstacle in achieving improved 6MWT (Figure 4). It is apparent that muscle fibrosis precluded the diffuse follistatin-induced muscle hypertrophy that we had seen in the normal muscle of the nonhuman primate. Of note, in this clinical trial, gross muscle hypertrophy was focal following gene transfer and could be observed on clinical examination (Figure 5). These areas of muscle were strikingly apparent and often pointed out by the patients.
Figure 3.

Site of gene transfer on leg compared to areas of fibrosis. (a) The sites of gene transfer to the right leg is shown for Patient 05 (distance walked = 108 m, 6MWT) using a surgical marking pen; (b) MRI of quadriceps muscles for Patient 05 shows a mild degree of MRI intensity (T1-weighted image); (c) the sites of gene transfer to the right leg is shown for Patient 03 (distance walked = 9 m, 6MWT) using a surgical marking pen; (d) MRI of quadriceps muscles for Patient 03 shows marked increase in intensity indicative of fibrosis.
Figure 4.

Grading Scale for quadriceps muscles by magnetic resonance images (MRI). Muscle MRIs were used to establish a grading scale for the quadriceps muscles based on approximate percentage of increased image intensity indicating degree of fibrosis replacing normal muscle. There was an overall correlation between fibrosis and distance walked on the 6MWT with Patients 03 and 04 demonstrating the least benefit from gene transfer. RF, rectus femoris; VL/VI, vastus lateralis/vastus intermedius; VM, vastus medialis.
Figure 5.

Focal areas of clinical muscle hypertrophy. Following gene transfer, focal areas of muscle hypertrophy (red arrows) could be seen clinically, as shown in Patients 01 and 05. We never observed diffuse quadriceps muscle enlargement as we had seen in preclinical studies in the nonhuman primate.
Muscle biopsy analysis
To further evaluate the effects of AAV1.CMV.FS344, we performed muscle biopsy analyses comparing pre- and posttreatment muscle biopsies obtained 30 days prior to gene delivery and at 6 months following gene transfer. One patient refused a second biopsy (Patient 04) and another showed severe fibrosis in the area targeted for the second biopsy (Patient 03) limiting interpretation. Postinjection biopsies from the low dose subjects (Cohort 1; Patient 01 and 02) highlighted follistatin-induced regeneration.31,32,33 The biopsies demonstrated an increase in the number of muscle fibers per unit area, inclusive of small and medium size diameter subpopulations (Supplementary Figure S2a). The findings favor improved radial growth of small fibers resulting from enhanced muscle regeneration combined with decreased frequency of necrosis/regeneration cycles in the muscle. The follistatin effect was better defined in the postinjection muscle biopsies from the high dose subjects (Cohort 2, Patient 05 and 06) (Figure 6a–d; Supplementary Figure S2b,c). There was a shift to a larger mean fiber diameter population: Patient 05, prebiopsy 40.14 ± 2.10 µm (n = 323 fibers) versus postbiopsy 59.33 ± 1.54 µm (n = 292 fibers); P < 0.0001; Patient 06, pre 47.48 ± 2.00 µm (n = 245 fibers) versus post 63.74 ± 2.45 µm (n = 277) P < 0.0001. Posttreatment muscle fibers appeared to be more uniform in size distribution distinct from untreated Becker muscle where many small and hypertrophied fibers are seen side-by-side (Figure 6a,c). More notable, the quantification of endomysial connective tissue (fibrosis) using picrosirius staining confirmed the anti-fibrotic effect of follistatin previously reported muscle,33 lung,34 liver,35 and pancreas.36 We found that the connective tissue was significantly decreased in posttreatment biopsy samples from all patients (P < 0.0002, one-way analysis of variance followed by Bartlett's test). In Cohort 2 patients posttreatment, we found that connective tissue was reduced to 35% of baseline for Patient 05 and to 43% of baseline for patient 06 (P < 0.017, one-way analysis of variance) (Figure 7, Supplementary Figure S3). In addition, following gene transfer both cohorts showed a decrease in the percent of fibers with central nuclei (Supplementary Figure S4) suggesting that myonuclei movements toward periphery were completed. DNA copy number at the site of biopsy is shown for each patient undergoing posttreatment in Supplementary Table S2. Muscle transgene expression specific for the FS344 isoform by RT-PCR was corroborated comparing pre- and posttreatment muscle biopsies (Supplementary Figure S5).
Figure 6.
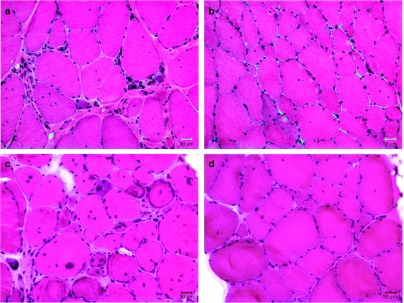
Muscle biopsy changes following follistatin gene therapy. (a) Pretreatment biopsy from Patient 05; (b) Posttreatment biopsy from Patient 05; (c) Pretreatment biopsy from Patient 06; (d) Posttreatment biopsy from Patient 06. The posttreatment biopsies show reduced fibrosis and a decrease in central nucleation. The number of small muscle fibers is markedly reduced and fewer split fibers are seen. Fiber size analyses showed a shift toward larger mean fiber diameter populations: Patient 05, prebiopsy 40.14 ± 2.10 µm (n = 323 fibers) versus postbiopsy 59.33 ± 1.54 µm (n = 292 fibers); P < 0.0001; Patient 06, pre 47.48 ± 2.00 µm (n = 245 fibers) versus post 63.74 ± 2.45 µm (n = 277) P < 0.0001.
Figure 7.

Reduced fibrosis following follistatin gene therapy. Percent fibrosis using picrosirius staining was quantified comparing pre- and posttreatment muscle biopsies in high dose cohort. The error bars represent standard error of the mean. Posttreatment, we found that fibrosis was reduced to 35% of baseline for Patient 05 and to 43% of baseline for patient 06 (P < 0.017; mean percent fibrosis in Cohort 2 pretreatment 33.14 ± 4.47 versus posttreatment 19.28 ± 1.73; one-way analysis of variance).
A potential interesting finding in this study was the number of Pax7+ satellite cell nuclei between pre- and postgene therapy biopsies. There has been ongoing concern raised by several investigators regarding myostatin inhibition and relation to satellite cell depletion.37,38,39 In this study comparing pre- and postfollistatin biopsies there was no consistent decline in the number of Pax7+ satellite cell nuclei per muscle fiber (Supplementary Figure S6) and the quantification of Pax7+ satellite cell nuclei postgene transfer consistently exceeded our previously reported control numbers (0.065 ± 0.006).40
Expression of microRNAs in response to follistatin
Previous studies have shown that AAV encoding follistatin reduces expression of miR-206, miR-1, and miR-29a.41 As a confirmatory biomarker for a follistatin effect, we compared miR-206 expression levels between first and second muscle biopsies from both cohorts following AAV1.CMV.FS344 injection. In BMD muscle, in which perpetual necrosis/regeneration cycles take place, the baseline miR-206 levels were found 4- to 5.6-fold higher than control muscle samples (Supplementary Figure S7a). Six months postgene injections there was a down regulation of miR-206 expression in all patients suggesting an overall slower rate of necrosis/regeneration events. Similar trends of down regulation of miR-1 and miR-29c were observed in posttreatment samples (Supplementary Figure S7b,c).
Discussion
A solid rationale preceded our clinical trial of follistatin gene delivery for BMD. A compelling justification is the lack of treatment for this form of muscular dystrophy including failed trials of glucocorticoids,17 creatine monophosphate,42 sildenafil15 and an attempt to replace dystrophin using a plasmid-based gene replacement strategy.43 The motivation for employing an inhibitor of the myostatin pathway originated from both preclinical and clinical studies. The potential importance of this pathway was first illustrated in 1997 in the myostatin knock out mouse showing a large and widespread increase in skeletal muscle mass.44 Myostatin, a member of the transforming growth factor-β superfamily, is an endogenous inhibitor of muscle growth. The effect of myostatin is conserved throughout mammalian species,45,46,47,48 including humans where the identification of myostatin gene mutations led to hypermuscularity through the combination of muscle fiber hyperplasia and hypertrophy.49,50 The benefits of loss of myostatin activity are also well established in dystrophic mice.51,52,53 The results of the first clinical trial of myostatin inhibition using a recombinant neutralizing antibody to inhibit myostatin (MYO-029) are likewise of interest showing a small, dose-related increase in muscle mass preferentially targeting BMD subjects in preference to other forms of dystrophy including limb girdle and facioscapulohumeral muscular dystrophies. However, no direct clinical benefit in muscle strength or function was seen in the MYO-029 trial.54
Follistatin is a potent inhibitor of the myostatin pathway and transgenic mice overexpressing follistatin demonstrate striking increases in muscle mass.55 The potential for follistatin as a therapeutic vehicle is enhanced because of its independence from the myostatin pathway. In the myostatin-null mouse, follistatin transgene expression results in an impressive quadrupling of muscle mass.20 In moving to a clinical trial, defining the follistatin isoform with the least off-target toxicity was an important step. The choice was between two isoforms generated by alternative splicing. The FS344 variant includes a C-terminal acidic region that undergoes peptide cleavage to generate the serum circulating, nontissue binding, FS315 isoform. This isoform avoids off-target effects especially affecting sites within the pituitary-gonadal axis.56,57,58,59 Our initial gene transfer experiments using AAV1.CMV.FS344 in the mdx mouse demonstrated enhanced muscle mass and strength for more than 2 years without adverse effects.18 We extended these studies to nonhuman primates for up to 15 months without histologic or functional adverse events to any key organ systems.19
The intramuscular injection of AAV1.CMV.FS344 to BMD subjects in this clinical trial represents a successful proof-of-principle study with an excellent safety profile that mirrored preclinical findings. The major clinical finding is the improvement in the distance walked on the 6MWT following injection of the quadriceps muscles. There was no apparent difference in functional outcome between low and high dose, with two of three patients improving in each cohort. Impressively, two patients improved by over 100 m in 6MWT. Two other patients improved, with increases of 58 m and 29 m. Two patients failed to significantly improve. We believe that the greatest obstacle to gene expression-related improvement was muscle fibrosis (Figures 3 and 4). Whereas in the normal muscle of nonhuman primates, FS344 led to diffuse muscle enhancement,19 in BMD subjects with underlying widespread connective tissue replacement of muscle, there were only focal areas of muscle hypertrophy (Figure 5). Thus, future enrollment will benefit from pretreatment MRI assessment and MRI-guided gene transfer. The extension of that finding is to avoid diffuse fibrosis by early intervention. Having said that, we did find an anti-fibrotic effect in endomysial fibrosis in regions of the biopsy where gene expression was apparent supported by findings including a reduced number of central nuclei, an increased in the number of muscle fibers, and a shift toward larger fiber diameters and more uniform fiber distribution especially in high dose subjects. Overall these findings are consistent with follistatin-induced enhancement of muscle differentiation leading to more efficient regenerative activity.31 We also found reduced expression of miR-206 and muscle expression of the specific follistatin isoform expressed following AAV gene transfer. We did not find a predictive correlation with DMD gene mutations (Table 1) or with dystrophin expression on muscle biopsy prior to treatment (data not shown).
In preparation for this clinical trial, safety concerns were raised regarding follistatin dysregulation of pituitary gonadotropins, especially follicle-stimulating hormone (FSH) and luteinizing hormone (LH).57,58,59 FSH and LH are involved in control of the reproductive function in vertebrates. In addition, follistatin is found in gonads and pituitary tissues and autocrine/paracrine effects on gonadotropins effects could be exerted by overexpression of follistatin in these tissues. Data generated from preclinical studies in nonhuman primates showed no changes in FSH, LH, testosterone or estrogen.19 This safety profile extended to the clinical trial where we again saw no changes in gonadotropins, testosterone or estrogen levels following gene therapy (Supplementary Figure S1). In addition, subjects in this clinical trial were closely monitored for a wide range of toxicity in every organ system and no abnormalities were encountered. Follistatin gene therapy delivered by AAV1 under the control of a CMV promoter proved to be exceptionally safe.
The safety findings in combination with gene expression in muscle, and functional improvement provide a firm foundation for application of AAV1.FS344 gene delivery for other muscle diseases. We have initiated a trial in sporadic inclusion body myositis (sIBM). This is a challenging disease because of lack of treatment, a long-term debilitating course, and an inflammatory infiltration in muscle that responds poorly to immune suppression. The ability of follistatin to target inflammatory cells, promote muscle regeneration, and increase muscle fiber size, provide significant potential for a therapeutic effect in sIBM. We also have plans to extend this trial of intramuscular AAV1.CMV.FS344 to DMD patients changing the protocol to include a wider delivery of vector to multiple muscle groups. It is also noteworthy for future consideration that dual vector delivery of AAV carrying FS344 in combination with micro-dystrophin in mdx mice improved tetanic force and provided full protection against eccentric contraction.60
In summary, the safety and efficacy as determined by the distance walked in the 6MWT, along with improved muscle histopathology in a first in human clinical trial of AAV1.CMV.FS344 warrants consideration for studies in other forms of muscular dystrophy. This study also sets the stage for a pivotal clinical trial for BMD patients.
Materials and Methods
Study subjects. Subject eligibility included proof of BMD mutation, knee extensor weakness 2 standard deviation below normal,24 ambulatory, ability to cooperate for testing, willingness to practice contraception during the study, and no evidence of cardiomyopathy, diabetes, or organ system abnormalities of bone marrow, liver, or kidney. Human immunodeficiency virus infection, hepatitis A, B, or C, or known autoimmune diseases were exclusion criteria. IRB approved consent forms were obtained by the principal investigator (JRM) and signed by subjects. Consents included approval for muscle biopsies performed under local anesthesia with incisions made over the proximal vastus lateralis. A randomization table determined the side of the pretreatment biopsy. The postgene transfer biopsy was done at 6 months postgene transfer to the same muscle of the opposite extremity with particular effort to stay within the area of the gene injection sites. Taking immunosuppressive drugs other than glucocorticoids during the trial was prohibited.
The Institutional Review Board at Nationwide Children's Hospital approved this clinical trial. The protocol followed the Helsinki Declaration; all patients gave their written informed consent and the trial was registered at Clin.Trials.Gov.
Vector production
Purification and characterization. The AAV1 vector product was produced using the AAV vector plasmid pAAV.CMV.FS344-Kan (Supplementary Figure S8). It contains the human follistatin gene expression cassette flanked by AAV2 inverted terminal repeat sequences (ITR). It is this sequence that is encapsidated into AAV1 virions. The plasmid was constructed by inserting the human follistatin cDNA sequence (human cDNA, Genbank Accession # NM 013409) obtained from Origene Technologies (Rockville, MD) into plasmid pAAV-MCS (Stratagene, La Jolla, CA) using BamH I and Xho l restriction sites. The construct contains the CMV immediate early promoter/enhancer and uses the β-globin intron for high-level expression and the human growth hormone polyadenylation termination signal. Subsequently, the bla open reading frame encoding ampicillin resistance was removed using BspH I digestion and the kanamycin resistance gene (amino-glycoside 3′-phosphotransferase II gene) from Transposon Tn5 was PCR amplified with BspH I ends from plasmid pSELECT-neo-mcs (InVivogen, San Diego, CA) and used to replace the bla gene to yield the AAV vector plasmid pAAV.CMV.FS344-Kan (5,347 bp). The only viral sequences in this vector are the inverted terminal repeats of AAV2, which are required for both viral DNA replication and packaging of the rAAV vector genome. All plasmids used in the production process were produced by Aldevron under its GMP-S quality system and infrastructure utilizing the most salient features of cGMP manufacturing; traceability, document control, and materials segregation. rAAV1.CMV.FS344 was produced in the Nationwide Children's Viral Vector GMP Manufacturing Facility. Vector production followed previously published methods using plasmid DNA tri-transfection of HEK293 cells followed by iodixanol and anion exchange column chromatography purification.25 Briefly, cells were cultivated in ten-tray Corning Cell Stacks, and all open manipulations were performed in class II biosafety cabinets in an ISO Class 5 environment. The purification process was performed in a closed system; where possible however, iodixanol gradient purification, an open step, was performed in an ISO Class 5 BSC. Purification consisted of collecting the cells plus media and subjecting them to a single pass microfluidization at 1000 psig followed by clarification and tangential flow filtration for volume reduction, iodixanol gradient purification and anion exchange chromatography on the 40% iodixanol fraction. After purification, the product was diafiltered with final formulation buffer and sterile filtered to yield the two Purified Bulks. After Purified Bulk testing, the two Purified Bulks were pooled, diluted with sterile formulation buffer (20 mmol/l Tris pH 8.0, 1 mmol/l MgCl2, 200 mmol/l NaCl, 0.001% Pluronic F68) and a manual Final Fill was performed within a BSC in the CMF Purification Room. Following Fill, the drug product underwent release testing in anticipation of formal release by our Quality Assurance Unit (QAU). Tests were performed on In-Process samples, the Purified Bulk Drug Substance, and the Final Fill drug product along with stability testing. Certificates of Stability and Analysis were submitted and approved by the FDA. The DNase Resistant Particle titer (also referred to as vector genomes (vg)) were determined for In-Process, Purified Bulk and Release Testing samples using real-time quantitative PCR (qPCR) using serial dilutions of a plasmid standard (pAAV.CMV.FS344-Kan) by the NCH-CMF QC laboratory and CMV Forward Primer 5′-TGG.AAA.TCC.CCG.TGA.GTC.AA-3′, CMV Reverse Primer 5′-CAT.GGT.GAT.GCG.GTT.TTG.G-3′ and CMV probe FAM-CCG.CTA.TCC.ACG.CCC.ATT.GAT.G-FAM.
Functional measures. The primary functional outcome, the 6MWT was performed at Nationwide Children's Hospital by the same clinical evaluators (L.P.L. and L.N.A.). The 6MWT was assessed at baseline prior to the muscle biopsy. Single-day assessments were performed at 30 days, 60 days, 90 days, 6 months, and 1 year. Direct measure of maximum voluntary isometric contraction of quadriceps muscles (knee extension) served as a secondary outcome measure. These outcome measures have been previously described.29
Muscle biopsy analysis. Biopsies were obtained from the quadriceps muscles, mounted in gum tragacanth and frozen in isopentane cooled in liquid nitrogen. A standard battery of stains including H&E, modified Gomori trichrome, and ATPase (pH 4.2, 4.6, and 9.4) was performed pre- and posttreatment. H&E stained cross sections were used for fiber size measurements and internal nuclei determinations. Depending on the available tissue size, 8–12 randomly selected areas were photographed at 20× and stored. Fiber diameters were recorded with a calibrated micrometer, using the AxioVision, 4.2 software (Zeiss). Fiber size distribution histograms were generated as number per mm2 area. These same images were used to identify the number of fibers with either one or more central nuclei and percent of fibers with central nuclei. The amount of endomysial and perimysial connective tissue was quantified in pre- and posttreatment biopsies using the Picro Sirius Red Stain Kit (Abcam ab150681). Twelve fields were randomly selected in pre- and posttreatment biopsies and photographed at 20×; the level of fibrosis was analyzed with ImagePro software. Analysis was made using customs method with 2.5 minute counter stained slides without color correction. Red area (as proportion of fibrotic area) was expressed as percent of total area. The mean ± SE of the number of images represented each biopsy. Pax7 positive satellite cells were identified with mouse Pax7 IgG1 antibody (R&D systems) by immunohistochemistry protocol of Super Sensitive polymer-HRP detection kit using i6000 Automated Staining System from Biogenex. Briefly, cryosections were fixed in 2% paraformaldehyde for 10 minutes at 4 °C and incubated in Pax7 antibody (1:100 dilutions) for 30 minutes after blocking with peroxide and Power Block for 10 minutes. Slides were washed five times with IHC supersensitive wash buffer. Finally, 3,3′-Diaminobenzidine (DAB) was used as a substrate and Mayor's hematoxylin as a counterstain. Pax7 positive nuclei counts were done using ImageScope software (Apereo) and expressed as number of Pax7 positive nuclei per muscle fiber.
In pretreatment biopsies, immunohistochemistry was performed to correlate dystrophin expression with outcome measures. The number of dystrophin positive fibers (NCL-Dys2, Novacastra Laboratories) and quantification of dystrophin intensity were performed using Bioquant image analysis software (Nashville, TN).
RT-PCR was used to confirm expression of follistatin transcript derived from the AAV.CMV.FS344 vector. RNA was isolated from pre- and posttreatment biopsies and following cDNA conversion, a vector specific PCR product was amplified using the following primers: forward primer 5′-CGAACATCGATTGAATTCCC-3′ and reverse primer 5′-CTTGCTCAGTTCGGTCTT-3′. To ensure specificity for amplification of vector derived transcript, the forward primer was designed to be complementary to an unspliced and transcribed region in the distal 3′ region of the CMV promoter with the reverse primer binding to the follistatin transgene.
Quantitative PCR to detect genome copy number. Taqman qPCR was used to quantify the number of vector genome copies compared to baseline biopsies as previously described.26,27 A vector specific primer probe was used to determine the copy number, reported as vector genomes per microgram of genomic DNA. The primer sets amplified a unique sequence of the CMV promoter within the CMV.FS cassette: 5-TGGAAATCCCCGTGAGTCAA-3; a CMV reverse primer, 5-CATGGTGATGCGGTTTTGG-3; and CMV probe, 5-FAM-CCGCTATCCACGCCCATTGATG-TAMRA-3 (IDT).
Identification of muscle specific microRNA expression. Total RNA was isolated from the specimens using mirVana miRNA isolation kit (Life Technologies). Reverse transcription was performed by using Taqman microRNA reverse transcription kit (Applied Biosystems). Quantitative reverse transcription-polymerase chain reaction (qRT-PCR) for miR-1, miR-206, miR-133a, and U6 snRNA was performed using RT kits from Life Technologies specific for each miR.
The catalog numbers for each as follows, miR-1: 4427975, ID 002222, miR-206: 4427975, ID 000510, miR-29c: 4427975, ID000587, U6: 4427975, ID001973.
Each miRNA expression was normalized to U6 snRNA expression. Expression data is shown as means of relative expression values obtained from three samples and normalized to normal control levels (set at 1). Standard error of means and presented in a graph format.
IFN-γ ELISpot analysis. ELISpot (enzyme-linked immunospot) assays were performed on fresh PBMCs, which were added at a concentration of 2 × 10⁵/well in duplicate wells of a 96-well flat-bottom membrane-plate (Millipore, Billerica, MA). Three peptide pools were used for the AAV1 capsid protein (Genemed Synthesis), containing 34–36 peptides, each 18 amino acids long and overlapping by 11 residues. Two peptide pools encompassing the follistatin protein (Genemed Synthesis) were used as previously described,18 Concanavalin A (Sigma) served as a positive control, and 0.25% DMSO as a negative control. Peptides were added directly to the wells at a final concentration of 1 µg/ml in 200 µl of AIM-HS (Aim-V lymphocyte media (Invitrogen) supplemented with 2% human AB serum (Gemini-BioScience BLCL medium) RPMI 1640 (Gibco) supplemented with 10% fetal bovine serum (Gibco) and Pen Strep (Gibco)). Human IFN-γ ELISpot kits were purchased from U-CyTech (Utrecht, Netherlands). After the addition of PBMCs and peptides, the plates were incubated at 37 °C for 48 hours and then developed according to the manufacturer's protocol. IFN-γ-spot formation was counted using a Cellular Technologies Limited Systems analyzer (CTL, Cleveland, OH).
Anti-AAV neutralizing antibody titers. The assay is based on the ability of neutralizing antibody (Nab) in serum to block target cell transduction with a B-gal reporter vector stock. C12 rep expressing HeLa cells (Viral Vector Core, Nationwide Children's Hospital) were plated in a 96-well plate (Corning) at a concentration of 5e4 cells/well, Plates were incubated at 37 °C with 5% CO2. The following day, an aliquot of patient serum was heat inactivated for 30 minutes at 56 °C. Serum was diluted in duplicate twofold with DMEM in a 96-well plate so that the plate contained 1:50–1:1,638,400 dilutions. 5e7 DRP/ml AAV1.CMV.βgal virus was added to the serially diluted wells in a volume of 25 µl. For the assay cutoff, 25 µl of 5e7, 1e7, and 5e6 DRP/ml were added to other wells containing 1:50 diluted naïve serum The 96-well plates were then rocked for 2–5 minutes, and incubated for 1 hour at 37 °C. Media was then removed and all 50 µl of the diluted serum/AAV1 complexes were added to the corresponding well containing C12 cells. 50 µl of the Ad5 (MOI = 250) were added to the diluted serum samples.
After overnight incubation at 37 °C, the media was replaced with 10% FBS DMEM media the media was removed after 36 hours. of incubation and gently washed with 200 µl/well of PBS (Invitrogen). 100 µl/well of Pierce β-gal Assay Reagent (Thermo Scientific) were added and incubated for 30 minutes at 37 °C. The plates were then read at 405 nm on a SPECTRA max M2 plate reader (Molecular Devices). The 5e6 DRP/ml positive control was the assay cutoff, which represents an equivalent of 10% infection and 90% neutralization. The farthest serum dilution producing an average absorbance at 405 nm that was less than the average absorbance of the 5e6 DRP/ml positive control was considered the anti-AAV1 titer.
Anti-follistatin antibody titers. An ELISA (Enzyme-Linked Immunosorbent Assay) was performed to measure the level of circulating anti-follistatin antibody in plasma. Briefly, Immulon-4 96-well plates (ISC BioExpress) were coated with 100 µl of human follistatin protein in carbonate buffer (pH 9.4; Pierce) per well. Plates were sealed overnight at 4 °C. Plates were blocked with 280 µl per well of a 5% nonfat dry milk and 1% normal goat serum (Invitrogen) in PBS for 3 hours at 25 °C. Patient plasma was diluted at a 1:50 ratio in solution identical to the blocking solution and 100 µl added in duplicate to both wells coated with follistatin in carbonate buffer and wells coated with carbonate buffer alone. Plates were incubated at 25 °C for 1 hour before being washed five times with 280 µl of PBS-T (0.05% Tween). Blocking solution was used again to dilute the secondary antibody, goat anti-human IgG-HRP (Sigma) at a 1:10,000 dilution. Wells received 250 µl of the secondary antibody and were incubated at 25 °C for 30 minutes before being washed five times and blotted dry. Tetramethybenzidine (TMB; 100 µl/well; Pierce) was added and incubated at 25 °C for 10 minutes in the dark, before the addition of 100 µl of 1 N H2SO4 (Acros Organics) to stop the reaction. The absorbance at 450 Å was measured using a Wallace 1420-050 Multilabel Counter (Perkin Elmer). Samples were considered positive if the absorbance at 450 Å average of the antigen-coated wells was three times greater than wells coated with carbonate buffer alone.
Muscle imaging. Muscle MRI was performed using T1 weighted spin echo on a 3.0 Tesla GE Signa Excite (General Electric Healthcare; Milwaukee, WI). Noncontrast enhanced images obtained from both legs were collected at baseline and 6 months postgene therapy treatment for all six subjects. Axial T1-weighted images of the lower extremities to the knees were obtained to study pelvic and thigh musculature. A body coil was used for obtaining T1 spin echo pulse sequences (repetition time (TR) 650 microseconds; echo time (TE) 15 microseconds) with a 256 × 256 matrix and a slice thickness of 10 mm each with no gap between slices. A field of view (FOV) of 480 mm was used and a total of 48 slices for each leg was obtained. A retrospective analysis of the images was performed by applying a semi-quantitative method for grading the degree of individual muscle involvement.61,62,63 Grading of muscles was based on the following scoring system:
Stage 0: Normal appearance
Stage 1: Scattered small areas of increased intensity
Stage 2a: Numerous discrete areas of increased intensity less than 30% of the volume of the muscle
Stage 2b: Numerous discrete areas of increased intensity with early confluence, 30–60% of the volume of the muscle
Stage 3: Washed-out appearance due to confluent areas increased intensity with muscle still present at the periphery
Stage 4: End-stage appearance, muscle entirely replaced by areas of increased intensity
Analysis of degree of muscle involvement on MRI using the above described scoring system was performed by two independent observers (S.A-Z. and A.G.) and a consensus on the scoring was reached for all muscle groups in all six subjects. Individual muscles were graded separately with the exception of the vastus lateralis and intermedius that were graded as one muscle due to poorly differentiated boundaries.
Statistical analyses. GraphPad Prism software (La Jolla, CA) was used for all statistical analyses. For all comparisons, two-tailed Student's t-test was used or where appropriate one-way analysis of variance was applied. A value of P < 0.05 was considered statistically significant.
SUPPLEMENTARY MATERIAL Figure S1. Hormonal profile for follistatin-treated patients. Figure S2. Muscle fiber size distribution histograms from pre and posttreatment biopsies. Figure S3. Picrosirius red collagen staining of muscle pre- and postfollistatin treatment. Figure S4. Follistatin gene therapy and central nucleation. Figure S5. Pre-and posttreatment RT-PCR on muscle biopsies. Figure S6. Pax7 positive nuclei per muscle fiber in pre- and posttreatment biopsies for Patients 01, 02, 05, and 06. Figure S7. miR-206, miR-1, and miR29c levels in pre- and posttreatment muscle biopsies for Patients 01, 02, 05, and 06. Figure S8. AAV.CMV.FS344-Kan plasmid used for vector production. Table S1. Follistatin gene therapy adverse events. Table S2. Follistatin DNA copy number.
Acknowledgments
The Parent Project Muscular Dystrophy supported the Clinical Trial. Staff for this trial and some of the materials and supplies were supplied by the Senator Paul D Wellstone Muscular Dystrophy Research Center, NICHD, NIH, Bethesda, MD #5U54HD066409-05. Jesse's Journey supported some of the participating staff. The Myositis Association (TMA) made helped bring this trial to the clinic by supporting the preclinical studies. The authors declare no conflict of interest.
BKK had intellectual property filed through Nationwide Children's Hospital and an equity interest related to work that is licensed to Milo Biotechnology. BKK also serves as a paid consultant for Milo. The relationships are managed through a conflict management plan.
Supplementary Material
Follistatin gene therapy adverse events.
Follistatin DNA copy number.
References
- England SB, Nicholson LV, Johnson MA, Forrest SM, Love DR, Zubrzycka-Gaarn EE, et al. Very mild muscular dystrophy associated with the deletion of 46% of dystrophin. Nature. 1990;343:180–182. doi: 10.1038/343180a0. [DOI] [PubMed] [Google Scholar]
- Nigro G, Muntoni F. 42nd ENMC Sponsored International Workshop: X-linked cardiomyopathies. 21-23 June 1996, Naarden, The Netherlands. Neuromuscul Disord. 1997;7:397–403. doi: 10.1016/s0960-8966(97)87156-8. [DOI] [PubMed] [Google Scholar]
- Bushby KM, Gardner-Medwin D, Nicholson LV, Johnson MA, Haggerty ID, Cleghorn NJ, et al. The clinical, genetic and dystrophin characteristics of Becker muscular dystrophy. II. Correlation of phenotype with genetic and protein abnormalities. J Neurol. 1993;240:105–112. doi: 10.1007/BF00858726. [DOI] [PubMed] [Google Scholar]
- Beggs AH, Hoffman EP, Snyder JR, Arahata K, Specht L, Shapiro F, et al. Exploring the molecular basis for variability among patients with Becker muscular dystrophy: dystrophin gene and protein studies. Am J Hum Genet. 1991;49:54–67. [PMC free article] [PubMed] [Google Scholar]
- Aartsma-Rus A, Fokkema I, Verschuuren J, Ginjaar I, van Deutekom J, van Ommen GJ, et al. Theoretic applicability of antisense-mediated exon skipping for Duchenne muscular dystrophy mutations. Hum Mutat. 2009;30:293–299. doi: 10.1002/humu.20918. [DOI] [PubMed] [Google Scholar]
- Flanigan KM, Dunn DM, von Niederhausern A, Soltanzadeh P, Gappmaier E, Howard MT, et al. United Dystrophinopathy Project Consortium Mutational spectrum of DMD mutations in dystrophinopathy patients: application of modern diagnostic techniques to a large cohort. Hum Mutat. 2009;30:1657–1666. doi: 10.1002/humu.21114. [DOI] [PMC free article] [PubMed] [Google Scholar]
- Flanigan KM, Dunn DM, von Niederhausern A, Soltanzadeh P, Howard MT, Sampson JB, et al. United Dystrophinopathy Project Consortium Nonsense mutation-associated Becker muscular dystrophy: interplay between exon definition and splicing regulatory elements within the DMD gene. Hum Mutat. 2011;32:299–308. doi: 10.1002/humu.21426. [DOI] [PMC free article] [PubMed] [Google Scholar]
- van den Bergen JC, Wokke BH, Janson AA, van Duinen SG, Hulsker MA, Ginjaar HB, et al. Dystrophin levels and clinical severity in Becker muscular dystrophy patients. J Neurol Neurosurg Psychiatry. 2014;85:747–753. doi: 10.1136/jnnp-2013-306350. [DOI] [PubMed] [Google Scholar]
- Neri M, Torelli S, Brown S, Ugo I, Sabatelli P, Merlini L, et al. Dystrophin levels as low as 30% are sufficient to avoid muscular dystrophy in the human. Neuromuscul Disord. 2007;17:913–918. doi: 10.1016/j.nmd.2007.07.005. [DOI] [PubMed] [Google Scholar]
- Brooke MH, Fenichel GM, Griggs RC, Mendell JR, Moxley R, Miller JP, et al. Clinical investigation in Duchenne dystrophy: 2. Determination of the “power” of therapeutic trials based on the natural history. Muscle Nerve. 1983;6:91–103. doi: 10.1002/mus.880060204. [DOI] [PubMed] [Google Scholar]
- Bushby KM, Gardner-Medwin D. The clinical, genetic and dystrophin characteristics of Becker muscular dystrophy. I. Natural history. J Neurol. 1993;240:98–104. doi: 10.1007/BF00858725. [DOI] [PubMed] [Google Scholar]
- Mendell JR, Province MA, Moxley RT, 3rd, Griggs RC, Brooke MH, Fenichel GM, et al. Clinical investigation of Duchenne muscular dystrophy. A methodology for therapeutic trials based on natural history controls. Arch Neurol. 1987;44:808–811. doi: 10.1001/archneur.1987.00520200012009. [DOI] [PubMed] [Google Scholar]
- von Mitzlaff HC, Liechti-Gallati S, Rösler KM, Burgunder JM. [Quadriceps myopathy as dystrophin-associated myopathy] Schweiz Med Wochenschr. 1993;123:1865–1869. [PubMed] [Google Scholar]
- Sunohara N, Arahata K, Hoffman EP, Yamada H, Nishimiya J, Arikawa E, et al. Quadriceps myopathy: forme fruste of Becker muscular dystrophy. Ann Neurol. 1990;28:634–639. doi: 10.1002/ana.410280506. [DOI] [PubMed] [Google Scholar]
- Witting N, Kruuse C, Nyhuus B, Prahm KP, Citirak G, Lundgaard SJ, et al. Effect of sildenafil on skeletal and cardiac muscle in Becker muscular dystrophy. Ann Neurol. 2014;76:550–557. doi: 10.1002/ana.24216. [DOI] [PubMed] [Google Scholar]
- Leung DG, Herzka DA, Thompson WR, He B, Bibat G, Tennekoon G, et al. Sildenafil does not improve cardiomyopathy in Duchenne/Becker muscular dystrophy. Ann Neurol. 2014;76:541–549. doi: 10.1002/ana.24214. [DOI] [PMC free article] [PubMed] [Google Scholar]
- Bäckman E, Henriksson KG. Low-dose prednisolone treatment in Duchenne and Becker muscular dystrophy. Neuromuscul Disord. 1995;5:233–241. doi: 10.1016/0960-8966(94)00048-e. [DOI] [PubMed] [Google Scholar]
- Haidet AM, Rizo L, Handy C, Umapathi P, Eagle A, Shilling C, et al. Long-term enhancement of skeletal muscle mass and strength by single gene administration of myostatin inhibitors. Proc Natl Acad Sci U S A. 2008;105:4318–4322. doi: 10.1073/pnas.0709144105. [DOI] [PMC free article] [PubMed] [Google Scholar]
- Kota J, Handy CR, Haidet AM, Montgomery CL, Eagle A, Rodino-Klapac LR, et al. Follistatin gene delivery enhances muscle growth and strength in nonhuman primates. Sci Transl Med. 2009;1:6ra15. doi: 10.1126/scitranslmed.3000112. [DOI] [PMC free article] [PubMed] [Google Scholar]
- Lee SJ. Quadrupling muscle mass in mice by targeting TGF-beta signaling pathways. PLoS One. 2007;2:e789. doi: 10.1371/journal.pone.0000789. [DOI] [PMC free article] [PubMed] [Google Scholar]
- Inouye S, Guo Y, DePaolo L, Shimonaka M, Ling N, Shimasaki S. Recombinant expression of human follistatin with 315 and 288 amino acids: chemical and biological comparison with native porcine follistatin. Endocrinology. 1991;129:815–822. doi: 10.1210/endo-129-2-815. [DOI] [PubMed] [Google Scholar]
- Sugino K, Kurosawa N, Nakamura T, Takio K, Shimasaki S, Ling N, et al. Molecular heterogeneity of follistatin, an activin-binding protein. Higher affinity of the carboxyl-terminal truncated forms for heparan sulfate proteoglycans on the ovarian granulosa cell. J Biol Chem. 1993;268:15579–15587. [PubMed] [Google Scholar]
- Nakatani M, Takehara Y, Sugino H, Matsumoto M, Hashimoto O, Hasegawa Y, et al. Transgenic expression of a myostatin inhibitor derived from follistatin increases skeletal muscle mass and ameliorates dystrophic pathology in mdx mice. FASEB J. 2008;22:477–487. doi: 10.1096/fj.07-8673com. [DOI] [PubMed] [Google Scholar]
- Tawil R, McDermott MP, Mendell JR, Kissel J, Griggs RC. Facioscapulohumeral muscular dystrophy (FSHD): design of natural history study and results of baseline testing. FSH-DY Group. Neurology. 1994;44 3 Pt 1:442–446. doi: 10.1212/wnl.44.3_part_1.442. [DOI] [PubMed] [Google Scholar]
- Nathwani AC, Tuddenham EG, Rangarajan S, Rosales C, McIntosh J, Linch DC, et al. Adenovirus-associated virus vector-mediated gene transfer in hemophilia B. N Engl J Med. 2011;365:2357–2365. doi: 10.1056/NEJMoa1108046. [DOI] [PMC free article] [PubMed] [Google Scholar]
- Mendell JR, Rodino-Klapac LR, Rosales XQ, Coley BD, Galloway G, Lewis S, et al. Sustained alpha-sarcoglycan gene expression after gene transfer in limb-girdle muscular dystrophy, type 2D. Ann Neurol. 2010;68:629–638. doi: 10.1002/ana.22251. [DOI] [PMC free article] [PubMed] [Google Scholar]
- Mendell JR, Rodino-Klapac LR, Rosales-Quintero X, Kota J, Coley BD, Galloway G, et al. Limb-girdle muscular dystrophy type 2D gene therapy restores alpha-sarcoglycan and associated proteins. Ann Neurol. 2009;66:290–297. doi: 10.1002/ana.21732. [DOI] [PMC free article] [PubMed] [Google Scholar]
- Viollet L, Gailey S, Thornton DJ, Friedman NR, Flanigan KM, Mahan JD, et al. Utility of cystatin C to monitor renal function in Duchenne muscular dystrophy. Muscle Nerve. 2009;40:438–442. doi: 10.1002/mus.21420. [DOI] [PMC free article] [PubMed] [Google Scholar]
- Mendell JR, Rodino-Klapac LR, Sahenk Z, Roush K, Bird L, Lowes LP, et al. Eteplirsen Study Group Eteplirsen for the treatment of Duchenne muscular dystrophy. Ann Neurol. 2013;74:637–647. doi: 10.1002/ana.23982. [DOI] [PubMed] [Google Scholar]
- McDonald CM, Henricson EK, Abresch RT, Florence JM, Eagle M, Gappmaier E, et al. PTC124-GD-007-DMD Study Group The 6-minute walk test and other endpoints in Duchenne muscular dystrophy: longitudinal natural history observations over 48 weeks from a multicenter study. Muscle Nerve. 2013;48:343–356. doi: 10.1002/mus.23902. [DOI] [PMC free article] [PubMed] [Google Scholar]
- Yaden BC, Croy JE, Wang Y, Wilson JM, Datta-Mannan A, Shetler P, et al. Follistatin: a novel therapeutic for the improvement of muscle regeneration. J Pharmacol Exp Ther. 2014;349:355–371. doi: 10.1124/jpet.113.211169. [DOI] [PubMed] [Google Scholar]
- McCroskery S, Thomas M, Platt L, Hennebry A, Nishimura T, McLeay L, et al. Improved muscle healing through enhanced regeneration and reduced fibrosis in myostatin-null mice. J Cell Sci. 2005;118 Pt 15:3531–3541. doi: 10.1242/jcs.02482. [DOI] [PubMed] [Google Scholar]
- Zhu J, Li Y, Lu A, Gharaibeh B, Ma J, Kobayashi T, et al. Follistatin improves skeletal muscle healing after injury and disease through an interaction with muscle regeneration, angiogenesis, and fibrosis. Am J Pathol. 2011;179:915–930. doi: 10.1016/j.ajpath.2011.04.008. [DOI] [PMC free article] [PubMed] [Google Scholar]
- Aoki F, Kurabayashi M, Hasegawa Y, Kojima I. Attenuation of bleomycin-induced pulmonary fibrosis by follistatin. Am J Respir Crit Care Med. 2005;172:713–720. doi: 10.1164/rccm.200412-1620OC. [DOI] [PubMed] [Google Scholar]
- Patella S, Phillips DJ, Tchongue J, de Kretser DM, Sievert W. Follistatin attenuates early liver fibrosis: effects on hepatic stellate cell activation and hepatocyte apoptosis. Am J Physiol Gastrointest Liver Physiol. 2006;290:G137–G144. doi: 10.1152/ajpgi.00080.2005. [DOI] [PubMed] [Google Scholar]
- Ohnishi N, Miyata T, Ohnishi H, Yasuda H, Tamada K, Ueda N, et al. Activin A is an autocrine activator of rat pancreatic stellate cells: potential therapeutic role of follistatin for pancreatic fibrosis. Gut. 2003;52:1487–1493. doi: 10.1136/gut.52.10.1487. [DOI] [PMC free article] [PubMed] [Google Scholar]
- Lee SJ, Huynh TV, Lee YS, Sebald SM, Wilcox-Adelman SA, Iwamori N, et al. Role of satellite cells versus myofibers in muscle hypertrophy induced by inhibition of the myostatin/activin signaling pathway. Proc Natl Acad Sci U S A. 2012;109:E2353–E2360. doi: 10.1073/pnas.1206410109. [DOI] [PMC free article] [PubMed] [Google Scholar]
- McCroskery S, Thomas M, Maxwell L, Sharma M, Kambadur R. Myostatin negatively regulates satellite cell activation and self-renewal. J Cell Biol. 2003;162:1135–1147. doi: 10.1083/jcb.200207056. [DOI] [PMC free article] [PubMed] [Google Scholar]
- Gilson H, Schakman O, Kallista S, Lause P, Tsuchida K, Thissen JP. Follistatin induces muscle hypertrophy through satellite cell proliferation and inhibition of both myostatin and activin. Am J Physiol Endocrinol Metab. 2009;297:E157–E164. doi: 10.1152/ajpendo.00193.2009. [DOI] [PubMed] [Google Scholar]
- Rosales XQ, Malik V, Sneh A, Chen L, Lewis S, Kota J, et al. Impaired regeneration in LGMD2A supported by increased PAX7-positive satellite cell content and muscle-specific microrna dysregulation. Muscle Nerve. 2013;47:731–739. doi: 10.1002/mus.23669. [DOI] [PMC free article] [PubMed] [Google Scholar]
- Winbanks CE, Beyer C, Hagg A, Qian H, Sepulveda PV, Gregorevic P. miR-206 represses hypertrophy of myogenic cells but not muscle fibers via inhibition of HDAC4. PLoS One. 2013;8:e73589. doi: 10.1371/journal.pone.0073589. [DOI] [PMC free article] [PubMed] [Google Scholar]
- Walter MC, Lochmüller H, Reilich P, Klopstock T, Huber R, Hartard M, et al. Creatine monohydrate in muscular dystrophies: A double-blind, placebo-controlled clinical study. Neurology. 2000;54:1848–1850. doi: 10.1212/wnl.54.9.1848. [DOI] [PubMed] [Google Scholar]
- Romero NB, Braun S, Benveniste O, Leturcq F, Hogrel JY, Morris GE, et al. Phase I study of dystrophin plasmid-based gene therapy in Duchenne/Becker muscular dystrophy. Hum Gene Ther. 2004;15:1065–1076. doi: 10.1089/hum.2004.15.1065. [DOI] [PubMed] [Google Scholar]
- McPherron AC, Lawler AM, Lee SJ. Regulation of skeletal muscle mass in mice by a new TGF-beta superfamily member. Nature. 1997;387:83–90. doi: 10.1038/387083a0. [DOI] [PubMed] [Google Scholar]
- McPherron AC, Lee SJ. Double muscling in cattle due to mutations in the myostatin gene. Proc Natl Acad Sci U S A. 1997;94:12457–12461. doi: 10.1073/pnas.94.23.12457. [DOI] [PMC free article] [PubMed] [Google Scholar]
- Grobet L, Martin LJ, Poncelet D, Pirottin D, Brouwers B, Riquet J, et al. A deletion in the bovine myostatin gene causes the double-muscled phenotype in cattle. Nat Genet. 1997;17:71–74. doi: 10.1038/ng0997-71. [DOI] [PubMed] [Google Scholar]
- Mosher DS, Quignon P, Bustamante CD, Sutter NB, Mellersh CS, Parker HG, et al. A mutation in the myostatin gene increases muscle mass and enhances racing performance in heterozygote dogs. PLoS Genet. 2007;3:e79. doi: 10.1371/journal.pgen.0030079. [DOI] [PMC free article] [PubMed] [Google Scholar]
- Clop A, Marcq F, Takeda H, Pirottin D, Tordoir X, Bibé B, et al. A mutation creating a potential illegitimate microRNA target site in the myostatin gene affects muscularity in sheep. Nat Genet. 2006;38:813–818. doi: 10.1038/ng1810. [DOI] [PubMed] [Google Scholar]
- Schuelke M, Wagner KR, Stolz LE, Hübner C, Riebel T, Kömen W, et al. Myostatin mutation associated with gross muscle hypertrophy in a child. N Engl J Med. 2004;350:2682–2688. doi: 10.1056/NEJMoa040933. [DOI] [PubMed] [Google Scholar]
- Prontera P, Bernardini L, Stangoni G, Capalbo A, Rogaia D, Ardisia C, et al. 2q31.2q32.3 deletion syndrome: report of an adult patient. Am J Med Genet A. 2009;149A:706–712. doi: 10.1002/ajmg.a.32688. [DOI] [PubMed] [Google Scholar]
- Bogdanovich S, Krag TO, Barton ER, Morris LD, Whittemore LA, Ahima RS, et al. Functional improvement of dystrophic muscle by myostatin blockade. Nature. 2002;420:418–421. doi: 10.1038/nature01154. [DOI] [PubMed] [Google Scholar]
- Wagner KR, McPherron AC, Winik N, Lee SJ. Loss of myostatin attenuates severity of muscular dystrophy in mdx mice. Ann Neurol. 2002;52:832–836. doi: 10.1002/ana.10385. [DOI] [PubMed] [Google Scholar]
- Bogdanovich S, Perkins K, Krag T, Whittemore LA, Khurana T. Myostatin propeptide-mediated ameliortion of dystophic pathophysiology. FASEB J. 2005;19:543–549. doi: 10.1096/fj.04-2796com. [DOI] [PubMed] [Google Scholar]
- Wagner KR, Fleckenstein JL, Amato AA, Barohn RJ, Bushby K, Escolar DM, et al. A phase I/IItrial of MYO-029 in adult subjects with muscular dystrophy. Ann Neurol. 2008;63:561–571. doi: 10.1002/ana.21338. [DOI] [PubMed] [Google Scholar]
- Lee SJ, McPherron AC. Regulation of myostatin activity and muscle growth. Proc Natl Acad Sci U S A. 2001;98:9306–9311. doi: 10.1073/pnas.151270098. [DOI] [PMC free article] [PubMed] [Google Scholar]
- Inouye S, Guo Y, DePaolo L, Shimonaka M, Ling N , Shimasaki S . Recombinant expression of human follistatin with 315 and 288 amino acids: chemical and biological comparison with native porcine follistatin. Endocrinology. 1991;129:815–822. doi: 10.1210/endo-129-2-815. [DOI] [PubMed] [Google Scholar]
- Kaiser UB, Lee BL, Carroll RS, Unabia G, Chin WW, Childs GV. Follistatin gene expression in the pituitary: localization in gonadotropes and folliculostellate cells in diestrous rats. Endocrinology. 1992;130:3048–3056. doi: 10.1210/endo.130.5.1572312. [DOI] [PubMed] [Google Scholar]
- Michel U, Albiston A, Findlay JK. Rat follistatin: gonadal and extragonadal expression and evidence for alternative splicing. Biochem Biophys Res Commun. 1990;173:401–407. doi: 10.1016/s0006-291x(05)81072-1. [DOI] [PubMed] [Google Scholar]
- Aroua S, Maugars G, Jeng SR, Chang CF, Weltzien FA, Rousseau K, et al. Pituitary gonadotropins FSH and LH are oppositely regulated by the activin/follistatin system in a basal teleost, the eel. Gen Comp Endocrinol. 2012;175:82–91. doi: 10.1016/j.ygcen.2011.10.002. [DOI] [PubMed] [Google Scholar]
- Rodino-Klapac LR, Janssen PM, Shontz KM, Canan B, Montgomery CL, Griffin D, et al. Micro-dystrophin and follistatin co-delivery restores muscle function in aged DMD model. Hum Mol Genet. 2013;22:4929–4937. doi: 10.1093/hmg/ddt342. [DOI] [PMC free article] [PubMed] [Google Scholar]
- Hawley RJ, Jr, Schellinger D, O'Doherty DS. Computed tomographic patterns of muscles in neuromuscular diseases. Arch Neurol. 1984;41:383–387. doi: 10.1001/archneur.1984.04050160045014. [DOI] [PubMed] [Google Scholar]
- Mercuri E, Talim B, Moghadaszadeh B, Petit N, Brockington M, Counsell S, et al. Clinical and imaging findings in six cases of congenital muscular dystrophy with rigid spine syndrome linked to chromosome 1p (RSMD1) Neuromuscul Disord. 2002;12:631–638. doi: 10.1016/s0960-8966(02)00023-8. [DOI] [PubMed] [Google Scholar]
- Kinali M, Arechavala-Gomeza V, Cirak S, Glover A, Guglieri M, Feng L, et al. Muscle histology vs MRI in Duchenne muscular dystrophy. Neurology. 2011;76:346–353. doi: 10.1212/WNL.0b013e318208811f. [DOI] [PMC free article] [PubMed] [Google Scholar]
Associated Data
This section collects any data citations, data availability statements, or supplementary materials included in this article.
Supplementary Materials
Follistatin gene therapy adverse events.
Follistatin DNA copy number.