

Abstract
The type 2 cannabinoid receptors (CB2R) have gained much attention recently due to their important regulatory role in a host of pathophysiological processes. However, the exact biological function of CB2R and how this function might change depending on disease progression remains unclear and could be better studied with highly sensitive and selective imaging tools for identifying the receptors. Here we report the first near infrared fluorescence imaging probe (NIR760-XLP6) that binds preferentially to CB2R over the type 1 cannabinoid receptors (CB1R). The selectivity of the probe was demonstrated by fluorescence microscopy using DBT-CB2 and DBT-CB1 cells. Furthermore, in mouse tumor models, NIR760-XLP6 showed significantly higher uptake in DBT-CB2 than that in DBT-CB1 tumors. These findings indicate that NIR760-XLP6 is a promising imaging tool for the study of CB2R regulation.
Keywords: cannabinoid, CB2 receptor, fluorescence imaging, cancer, near infrared
1. Introduction
The endogenous cannabinoids system includes cannabinoid receptors and their endogenous ligands that have been studied extensively due to its implication in many biological process such as the control of membrane potential,[1] metabolic regulation,[2] cell proliferation[3] and many other cell function in both the central nervous system and peripheral tissues.[4] These effects are mainly mediated via two subtypes of cannabinoid receptors: type 1 cannabinoid receptor (CB1R) and type 2 cannabinoid receptor (CB2R).[5] Both receptors are G protein-coupled, membrane-bound proteins that regulate multiple signaling cascades, including adenylyl cyclase and mitogen protein kinases.[6] CB1R is primarily found in the central nerve system, and CB2R is mainly present in immune cells, although recent studies indicate that CB1R also express in a number of peripheral tissues and CB2R may also exists in the central nervous system.[7] A large amount of efforts have been invested to study CB2R function and this target is now considered to hold major therapeutic promises. For example, studies have shown that agonists acting on CB2R may exhibit potential role in cancer treatment.[8-10] Other studies have highlighted the roles for CB2R in inflammatory and neuropathic pain models.[11] Some neuroprotective roles of inflammation in nervous system have also been associated with CB2R that could lead to the prevention of select neurodegenerative diseases.[12] However, the precise expression pattern of CB2R and the number of receptors that need to be activated to regulate these disease processes remains unclear.[13] Therefore, there is an urgent need to develop reliable imaging tools to answer these important questions about CB2R.
As a low-cost imaging method with high sensitivity and resolution, fluorescence imaging is widely used to study receptors at the cellular and molecular levels.[14-16] For in vivo imaging studies, near infrared (NIR) light (650-900 nm) is usually adopted, owing to the low tissue absorption and negligible tissue autofluorescence in the NIR region.[14] However, it is difficult to develop CB2R-targeted fluorescent probes because conjugating a relatively large fluorescent dye to a CB2R ligand could obliterate its binding to CB2R.[17] In fact, even attaching a small linker to a CB2R ligand often leads to the loss of binding.[18] We recently overcame the difficulty and introduced NIR dyes to strategic positions of a pyrazole and quinolone structure respectively.[19-23] The specificity of these probes was demonstrated by blocking studies both in vitro and in vivo. Despite the recent progress made on developing CB2R-targeted fluorescent probes, one key issue of CB2R imaging is their selectivity. Because both CB1R and CB2R are expressed by the same cells in certain physiological and pathophysiological conditions,[24, 25] and these receptors share high degrees of homology in their binding sites, it is critical to develop probes that preferably bind to CB2R over CB1R. Moreover, CB2R-targeted imaging probes with significantly lower CB1R binding affinity are unlikely to elicit undesired psychotropic effects linked to CB1R activation.[14-16] So far, no selective CB2R fluorescent probe has been reported. This is not surprising because in addition to the difficulty in developing CB2R-targeted fluorescent probe as discussed above, a CB2R-selective fluorescent probe has to overcome the challenge of recognizing CB2R from CB1R which share significant sequence homology (CB1R and CB2R share an overall 44% amino acid homology and a 68% amino acid homology within the transmembrane domains).[26] Here we report the first NIR fluorescence imaging probe, NIR760-XLP6, which shows preferable binding to CB2R over CB1R both in vitro and in vivo.
2. Materials and Methods
All animal experiments were performed in accordance with the guidelines for the Care and Use of Laboratory Animals of the Medical Research Council of University of Pittsburgh.
2.1 Materials
All solvents and reagents were used as obtained from Sigma Aldrich (St. Louis, MO) and Thermo Fisher Scientific (Pittsburgh, PA), unless otherwise stated. 3-Bormo-5-aminopyrazole from Ark Pharm, Inc. (Libertyville, IL). 0.1% Triton X-100 in PBS, SR-141716A, indocyanine green (ICG), and DAPI from Sigma-Aldrich (St. Louis, MO). 4% paraformaldehyde in PBS from Affymetrix (Santa Clara, CA). Doxorubucin from A Chemtek Inc. (Worcester, MA). CellTiter-Glo® Luminescent Cell Viability Assay kit from Promega (Madison, WI). RNAzol Reagent, and Platinum Taq DNA polymerase from Invitrogen (Carlsbad, CA). Primers for CB2R, CB1R and GAPDH (housekeeping gene) from Integrated DNA Technologies (Coralville, IA). ProLong® Gold antifade reagent from Life Technologies (Carlsbad, CA). DRAQ-5 from Cell Signaling Technology (Beverly, MA). Transfected mouse delayed brain tumor (DBT) cell line that expresses CB2R (DBT-CB2) or CB1R (DBT-CB1). 6 - 8 week old female nu/nu mice were obtained from The Jackson Laboratory (Bar Harbor, ME).
2.2. Measurements and analysis
1H and 13C NMR spectra were recorded at 25 °C on the Brucker Avance III 400 MHz. Unless otherwise specified, chemical shifts δ were expressed in parts per million (ppm) based on the residual solvent signal in DMSO-d6 (δ 2.50 ppm) or tetramethylsilane (TMS) in CDCl3 (δ 0.00 ppm), and coupling constants J are given in Hz. Coupling patterns are abbreviated as s (singlet), d (doublet), t (triplet), q (quartet), quin (quintet), ABq (AB quartet), and m (multiplet). Electrospray mass spectra were recorded on a Waters LCT Premier mass spectrometer in positive ion mode. Reverse phase HPLC was performed using Waters HPLC system equipped with Waters-1525 solvent delivery systems and Waters 2998 UV detector. Separation was achieved on a semi-preparative Phenomenex (Torrance, CA) Jupiter® 5μm C18 300Å column (5 micron, 250 × 10.00 mm, Part Number: 00G-4053-N0) at a flow rate maintained at 4.0 mL/min. A solvent system composed of water containing 0.1% TFA as solvent A and acetonitrile containing 0.1% TFA as solvent B was used over the stated gradient. The column effluent was monitored with a UV/Vis detector set at 760 nm.
2.3. Synthesis of NIR760-XLP6
Compound 1 was prepared according to literature[27] from 3-bormo-5-aminopyrazole. The NIR760 dye was prepared using the previously described procedure.[21, 28]
2.3.1. Synthesis of 2
Under Argon atmosphere, a mixture of pyrazolopyrimidine derivative 1 (1.4 g, 5.0 mmol) and anhydrous potassium carbonate (2.8 g, 20 mmol) in anhydrous DMF (40 mL) was heated at 100 °C. After 1 h, 1-bromopentane (1.5 g, 10 mmol) was added and the mixture was stirred at 100 °C for 23 h. After being cooled down to room temperature, the solution was evaporated to dryness in vacuo. The residue was triturated with cold water (50 mL) and filtered. The white precipitate formed was washed with cold water (50 mL) and dried in vacuo. The crude product was purified by column chromatography using a gradient eluent of ethyl acetate/hexanes = 2 : 1 to 4 : 1 to give the titled compound 2 as a white solid (1.3 g, 74%); 1H-NMR (400 MHz, CDCl3, TMS): δ 0.93 (t, 3H, J = 7.0 Hz), 1.38 (7H, m), 1.89 (quin, 2H, J = 7.5 Hz), 4.00 (t, 2H, J = 7.4 Hz), 4.38 (q, 2H, J = 7.1 Hz), 6.19 (s, 1H), 8.29 (s, 1H). 13C-NMR (100 MHz, CDCl3, TMS): δ 13.8, 14.3, 22.1, 27.9, 28.5, 54.9, 61.5, 93.9, 101.3, 133.6, 142.2, 146.8, 151.4, 163.7. MS (ESI): m/z = 356.062, calcd. for C14H19N3O3Br m/z (M+H)+ = 356.061.
2.3.2. Synthesis of 3
To a solution of pyrazolopyrimidine derivative 2 (1.1 g, 3.0 mmol) in methanol (10 mL) was added 10% sodium hydroxide aqueous solution (10 mL). The resulting solution was stirred at 25 °C for 1 h followed by addition of 10% hydrochloric acid aqueous solution to adjust the pH to 4. The precipitate formed was collected by filtration, washed with water (10 mL) and dried in vacuo to give the titled compound 3 as a white solid (0.91 g, 92%). The product was used in the next step without further purification; 1H-NMR (400 MHz, DMSO-d6): δ 0.85 (t, 3H, J = 6.9 Hz), 1.22-1.34 (m, 4H), 1.74 (quin, 2H, J = 7.3 Hz), 4.17 (t, 2H, J = 7.3 Hz), 6.93 (s, 1H), 8.76 (s, 1H). 13C-NMR (100 MHz, DMSO-d6): δ 13.9, 21.8, 27.6, 27.8, 53.9, 94.8, 99.3, 133.2, 143.1, 148.7, 153.8, 164.3. MS (ESI): m/z = 328.030, calcd. for C12H15N3O3Br m/z (M+H)+ = 328.029.
2.3.3. Synthesis of 4 (XLP4)
Under Argon atmosphere, a stirring solution of carboxylic acid 3 (0.50 g, 1.5 mmol) in anhydrous DMF (10 mL) was added N, N-diisopropylethylamine (0.80 mL, 4.6 mmol). The stirring mixture was kept at 0 °C for 10 min before HBTU (0.87 g, 2.3 mmol) was introduced. The solution was stirred for an additional 2 h at room temperature followed by addition of 1-adamantylamine (0.35 g, 2.3 mmol). The resulting mixture was stirred for 18 h and the solvent was subsequently evaporated under reduced pressure. The residue was dissolved in ethyl acetate (50 mL) and washed with saturated sodium bicarbonate aqueous solution (25 mL), water (25 mL) and brine (25 mL). The organic layer was dried over sodium sulfate and concentrated in vacuo. The residue was purified by column chromatography using ethyl acetate/hexanes = 1: 3 as the eluent to give the titled compound 4 (XLP4) as a white solid (0.65 g, 93%); 1H-NMR (400 MHz, CDCl3, TMS): δ 0.92 (t, 3H, J = 6.9 Hz), 1.30-1.41 (m, 4H), 1.72 (br t, 6H, J = 14.5 Hz), 1.88 (quin, 2H, J = 7.3 Hz), 2.09-2.15 (br m, 9H), 3.97 (t, 2H, J = 7.4 Hz), 6.20 (s, 1H), 8.49 (s, 1H), 8.78 (br s, 1H). 13C-NMR (100 MHz, CDCl3, TMS): 13.9, 22.3, 28.0, 28.6, 29.7, 36.6, 41.8, 52.4, 55.1, 93.4, 103.8, 134.5, 142.8, 145.3, 155.5, 161.2. MS (ESI): m/z = 461.146, calcd. for C22H30N4O2Br m/z (M+H)+ = 461.155.
2.3.4. Synthesis of 5
To a solution of bromo-pyrazolopyrimidine derivative 4 (50 mg, 0.11 mmol), 4-carboxyphenylboronic acid (40 mg, 0.24 mmol), potassium carbonate (44 mg, 0.33 mmol) in a mixture of 1,4-dioxane (1.5 mL) and water (0.5 mL) was added Pd(PPh3)4 (6.3 mg, 5.0 mmol). The resulting mixture was microwaved at 150 °C for 20 min in a sealed vessel and subsequently filtered through a pad of celite. The filtrate was concentrated in reduced pressure. The residue was diluted in ethyl acetate (20 mL) and washed with 1% hydrochloric acid (20 mL). The aqueous layer was extracted with ethyl acetate (20 mL × 3). The combined organic layers were dried over sodium sulfate and concentrated under reduced pressure. The residue was purified by column chromatography using dichloromethane/methanol = 20 : 1 as the eluent to give the titled compound 5 as a white solid (44 mg, 81%); 1H-NMR (400 MHz, CDCl3, TMS): δ 0.93 (t, 3H, J = 7.0 Hz), 1.25 (br s, 4H), 1.35-1.44 (m, 4H), 1.74 (br t, 6H, J = 14.5 Hz), 1.95 (quin, 2H, J = 7.3 Hz), 2.10-2.16 (br m, 9H), 4.09 (t, 2H, J = 7.2 Hz), 6.53(s, 1H), 8.15 (ABq, 4H, ΔνAB = 20.0 Hz, JAB = 8.6 Hz), 8.59 (s, 1H), 8.98 (br s, 1H). 13C-NMR (100 MHz, CDCl3, TMS): δ 13.8, 22.2, 28.0, 28.6, 29.5, 36.5, 41.7, 52.2, 87.8, 103.5, 126.8, 128.5, 130.2, 130.7, 136.5, 143.0, 145.4, 147.0, 156.7, 161.6. MS (ESI): m/z = 503.270, calcd. for C29H35N4O4 m/z (M+H)+ = 503.265.
2.3.5. Synthesis of 6 (XLP6)
Under Argon atmosphere, a solution of benzoic acid derivative 5 (20 mg, 40 μmol) in anhydrous DMF (10 mL) was added N, N-diisopropylethylamine (21 μL, 0.12 mmol) and kept at 0 °C for 10 min before addition of HBTU (23 mg, 60 mmol). The mixture was stirred for 2 h at room temperature. The resulting solution was added into a solution of 1,6-diaminohexane (46 mg, 0.40 mmol) in anhydrous DMF (20 mL) over 15 min. The mixture was continuously stirred for 18 h before the solvent was removed in reduced pressure. The residue was diluted with ethyl acetate (20 mL) and washed with water (10 mL) and brine (10 mL). The aqueous layer was extracted with ethyl acetate (10 mL × 4). The combined organic layers were dried over sodium sulfate and concentrated under reduced pressure. The residue was purified by column chromatography using a gradient eluent of dichloromethane/methanol/ammonia = 100 : 5 : 1 to 100 : 15 : 1 to give the titled compound 6 (XLP6) as a yellow paste (16 mg, 67%); 1H-NMR (400 MHz, CDCl3, TMS): δ 0.88 (t, 3H, J = 6.8 Hz), 1.22-1.43 (m, 8H), 1.54 (m, 2H), 1.60-1.78 (m, 8H), 1.86 (br m, 3H), 2.02-2.16 (br m, 8H), 2.92 (t, 2H, J = 6.5 Hz), 3.34 (q, 2H, J = 6.1 Hz), 4.04 (t, 2H, J = 7.3 Hz), 5.35 (br s, 2H), 6.51 (s, 1H), 7.39 (br s, 1H), 7.83 (ABq, 4H, ΔνAB = 30.6 Hz, JAB = 7.9 Hz), 8.38 (s, 1H), 8.80 (s, 1H). 13C-NMR (100 MHz, CDCl3, TMS): δ 13.8, 22.2, 25.9, 26.2, 28.0, 28.5, 29.1, 29.5, 29.7, 36.4, 39.9, 40.7, 41.7, 52.1, 55.0, 88.3, 103.0, 126.6, 127.6, 134.0, 135.4, 142.8, 145.4, 154.6, 156.68, 161.4, 167.5. MS (ESI): m/z = 601.385, calcd. for C35H49N6O3 m/z (M+H)+ = 601.386.
2.3.6. Synthesis of NIR760-XLP6
The following reaction and purification should preferably be carried out in the absence of light. Under Argon atmosphere, a solution of purified NIR760 dye (20 mg, 21 μmol) in anhydrous DMF (1.0 mL) was added N, N-diisopropylethylamine (11 μL, 39 mmol) and stirred at 0 °C for 10 min before the addition of HBTU (12 mg, 31 mmol) and HOBt (5.3 mg, 31 μmol). The mixture was stirred for 1 h at room temperature. The resulting solution was added a solution of amine derivative 6 (8.0 mg, 13 mmol) in anhydrous DMF (0.50 mL). The mixture was continuously stirred for 18 h before the solvent was removed in reduced pressure. The residue was purified by semi-preparative reverse phase HPLC, using gradient eluents from 60% A to 5% A over 28 min, hold at 5% A for additional 10 min, and finally return to 60% A in 5 min. The low boiling solvent of the collected fractions (retention time = 8.9 min) was removed using rotary evaporation at 30 °C and the remaining solution was lyophilized to give the titled compound NIR760-XLP6 as a dark green powder (9.0 mg, 45%); 1H-NMR (400 MHz, DMSO-d6): δ 0.86 (t, 3H, J = 6.5 Hz), 1.09 (s, 12 H), 1.32 (m, 4H), 1.42 (m, 4H), 1.55-1.72 (m, 10H), 1.83 (quin, 2H, J = 7.2 Hz), 1.96 (m, 6H), 2.56 (t, 4H, J = 7.0 Hz), 2.72 (m, 4H), 3.28-3.43 (m, 5 H), 4.26 (m, 6H), 6.42 (d, 2H, J = 13.8 Hz), 7.04 (d, 2H, J = 13.8 Hz), 7.25-7.44 (m, 5H), 7.52-7.67 (m, 4H), 8.02 (ABq, 4H, ΔνAB = 27.9 Hz, JAB = 8.12 Hz), 8.13 (d, 2H, J = 7.8 Hz), 8.61-8.74 (m, 3H), 8.86 (s, 1H). 13C-NMR (100 MHz, DMSO-d6): 13.8, 21.7, 23.2, 24.20, 24.23, 26.4, 26.5, 27.0, 27.6, 27.8, 28.9, 29.1, 29.4, 36.0, 41.3, 42.7, 47.9, 48.1, 50.9, 53.9, 89.1, 98.6, 101.0, 101.7, 110.0, 110.09, 110.12, 119.6, 126.0, 126.1, 127.4, 127.8, 128.3, 129.2, 129.6, 130.7, 131.5, 133.6, 133.9, 134.0, 135.1, 135.90, 135.93, 136.4, 136.8, 140.0, 142.2, 143.2, 144.82, 144.84, 144.86, 144.90, 146.4, 147.0, 149.2, 153.5, 156.4, 161.3, 165.2, 165.5, 171.3. MS (ESI): m/z = 780.133, calcd. for C79H100N8O17S4 m/z (M+5H+CH3OH)2+ = 780.304.
2.4. Saturation binding assay of NIR760-XLP6
Intact cell saturation binding assay was carried out to determine the binding affinity to CB2R. Briefly, DBT-CB2 cells were seeded onto 96 well optical bottom black plates and incubated for 24 h. Cells were fixed with 4% paraformaldehyde in PBS for 10 min at 25 °C. Cells were then permeabilized with 0.1% Triton X-100 in PBS for 10 min at 25 °C. Next, cells were pre-incubated with blocking agent XLP4 (10 μM) or vehicle for 30 min, and then incubated with an increasing concentration of NIR760-XLP6 (5.0 nM to 0.90 μM) for 30 min. Cells were rinsed once with PBS to remove remaining probes in the medium. Fluorescence (excitation/emission = 740/790 nm) was recorded with a Synergy™ H4 Hybrid Multi-Mode Microplate Reader (BioTek, Winooski, VT). The specific binding was obtained by the subtraction of non-specific binding (with blocking agent) from total binding (without blocking agent). The dissociation constant (Kd) and receptor density (Bmax) were estimated from the non-linear fitting of specific binding versus NIR760-XLP6 concentration using Prism software (GraphPad, San Diego, CA). To determine that binding affinity of NIR760-XLP6 to CB1R, DBT-CB1 cells were treated similarly using SR-141716A (1.0 mM) as the blocking agent and increasing concentration of NIR760-XLP6 (10 μM to 0.20 mM).
2.5. Viability assay of NIR760-XLP6
The cell viability assay was performed using DBT-CB2 cells. The cells were treated with various concentrations of NIR760-XLP6 ranging from 0 to 50 μM, with indocyanine green (ICG) serving as the negative control and Doxorubucin as the positive control. Subsequently, the cells were incubated at 37 °C under a humidified atmosphere of 5% CO2 for 24 h. After the incubation, cell viability was assessed by the CellTiter-Glo® Luminescent Cell Viability Assay kit according to the manufacturer supplied standard protocols. The CellTiter-Glo® Luminescent Cell Viability assay measures the number of viable cells based on the quantitation of the ATP present. The luminescence signal was detected at 528 nm.
2.6. Reverse Transcription Polymerase Chain Reaction (RT-PCR)
DBT-CB2 or DBT-CB1 cells were seeded onto 3.5 mm dishes and cultured at 37 °C for 24 h. Total RNA was extracted from DBT-CB2 or DBT-CB1 cells using RNAzol Reagent. First-strand cDNA was synthesized from total RNA using the SuperScript III first-strand synthesis system for RT-PCR (Invitrogen, Carlsbad, CA). For RT-PCR assays, the sequences of primers used for CB2R were 5′-tcctatcatttacgccctgc-3′ (sense) and 5′-ggctcctaggtggttttcacatcagcctc-3′ (antisense); for CB1R were 5′-cacaagcacgccaataacaca-3′ (sense) and 5′-acagtgctcttgatgcagctttc-3′ (antisense); and for GAPDH were 5′-tgaacgggaagctcactggcat-3′ (sense) and 5′-tgcctgcttcaccaccttcttg-3′ (antisense). Amplifications were run using Platinum Taq DNA polymerase and consisted of 30 cycles of 30 s at 94 °C, 30 s at 55 °C, and 30 s at 72 °C.
2.7. Cell fluorescent imaging of NIR760-XLP6
DBT-CB2 or DBT-CB1 cells were seeded into 8-well chamber slide. Four groups of samples are prepared as follows: (1) DBT-CB2 cells were incubated with 5.0 μM of NIR760-XLP6 at 37 °C for 30 min; (2) DBT-CB1 cells were incubated with 5.0 μM of NIR760-XLP6 at 37 °C for 30 min; (3) DBT-CB2 cells were incubated with 10 μM of XLP4 at 37 °C for 30 min, followed by 5.0 μM of NIR760-XLP6 at 37 °C for 30 min; and (4) DBT-CB2 cells were incubated with 5.0 μM of NIR760 at 37 °C for 30 min. After the incubation, cells were washed three times with PBS, and fixed with 4% paraformaldehyde in PBS for 20 min at 25 °C. Cells were then permeabilized with 0.1% Triton X-100 in PBS. The cell nucleus was stained with 1.0 μg/mL DAPI for 15 min at 25 °C. Cells were mounted with ProLong® Gold antifade reagent and then imaged using the Zeiss Axio Observer fluorescent microscope equipped with the ApoTome 2 imaging system (Carl Zeiss Microimaging Gmbh, Jena, Germany). Fluorescence images were captured with an NIR-sensitive camera with an ICG filter (excitation/emission: 750-800/820-875 nm). Nuclear images were obtained with a DAPI filter (excitation/emission: 335-383/420-470 nm). Differential interference contrast (DIC) images were obtained through Trans light DIC.
2.8. Quantitative binding assay of NIR760-XLP6
1 × 10⁵ (per well) DBT-CB2 or DBT-CB1 cells were seeded onto 96-well optical black plates. The cells were subsequently incubated at 37 °C under a humidified atmosphere of 5% CO2 for 24 h. Cells were divided into four groups: (1) DBT-CB2 cells incubated with 5.0 μM of NIR760-XLP6 at 37 °C for 30 min; (2) DBT-CB1 cells incubated with 5.0 μM of NIR760-XLP6 at 37 °C for 30 min; (3) DBT-CB2 cells incubated with 10 μM of XLP4 at 37 °C for 30 min, followed by 5.0 μM of NIR760-XLP6 at 37 °C for 30 min; and (4) DBT-CB2 cells incubated with 5.0 μM of NIR760 at 37 °C for 30 min. A Synergy™ H4 Hybrid Multi-Mode Microplate Reader was used to read fluorescence at 740/790 nm (excitation/emission). After the initial reading, cells were rinsed with cell culture medium twice and the fluorescence emission was measured again. The fluorescence emissions recorded were normalized by dividing each point by the initial reading and then corrected with cell number (with data expressed in terms of relative fluorescence units, RFU). The cell numbers were obtained as follow: cells were fixed in 4% paraformaldehyde in PBS for 10 min at 25 °C, permeabilized with 0.1% Triton X-100 in PBS for 5 min at 25 °C and rinsed twice with PBS. DRAQ-5 (1 : 2500) was then added at 25 °C and cells were rinsed three times with PBS after 5 min. Fluorescence at 650/690 nm (excitation/emission) was recorded for the comparison of cell number.
2.9. In vivo optical imaging of NIR760-XLP6
A total of twelve mice were divided into four groups. Subcutaneous tumors were developed by injecting 1×10⁶ DBT-CB2 cells (n = 9) or 1×10⁶ DBT-CB1 cells (n = 3) into the right flank of 6 - 8 week old female nu/nu mice. Experiments with tumor-bearing mice were performed 10 days after the injection of tumor cells. Nude mice were anesthetized with a 2.5% isoflurane/oxygen gas mixture. All mice were injected with imaging agents in 100 μL saline via tail vein as follows: (1) three DBT-CB2 tumor bearing mice with 10 nmol of NIR760-XLP6; (2) three DBT-CB1 tumor bearing mice with 10 nmol of NIR760-XLP6; (3) three DBT-CB2 tumor bearing mice with 100 nmol of XLP4 followed by 10 nmol NIR760-XLP6 after 1 h; (4) three DBT-CB2 tumor bearing mice with 10 nmol of NIR760.
Optical imaging was performed with a charge-coupled device camera–based bioluminescence imaging system IVIS Lumina XR (PerkinElmer, Waltham, MA) using the following parameters: excitation filter, 745 nm; emission filter, 800 nm; exposure time, 1 sec; binning, small; field of view, 12; f/stop, 2; open filter. The images were captured at pre-injection, 1 h, 3 h, 6 h, 9 h, 24 h, 48 h, and 72 h post-injection. Signal was displayed as Radiant Efficiency ([photons/sec/cm2/sr]/[μW/cm2]). Images were analyzed by using Living Image 4.4 software (Caliper Life Sciences, Hopkinton, MA). For the data analysis of tumor contrast, region-of-interest (ROI) of the tumor site at the right flank of the animal (T) and normal tissue at the left flank (N) were drawn. Tumor contrast enhancement (T/N) profiles were obtained by dividing fluorescence intensity at T by that at N as shown in Table SI-2.
2.10. Ex vivo imaging and biodistribution
After the last time point of in vivo optical imaging, all mice were euthanized. Tumors and selected organs (blood, heart, lung, liver, spleen, pancreas, kidneys, muscle from left leg, and brain) were excised and imaged under IVIS Lumina XR system.
The biodistribution of NIR760-XLP6 and NIR760 in the corresponding mice groups was evaluated by drawing ROI along the excised tumors and organs. Fluorescence signal ratios of target (tumor or organ) over normal (muscle) are shown in Table SI-3.
2.11. Data Processing and Statistics
All of the data given are the mean ± SEM (standard error of the mean) of n independent measurements. For in vitro binding study and ex vivo biodistribution study, statistical analyses were performed using one-way ANOVA method, with p values <0.05 considered statistically significant. For in vivo imaging studies, statistical analyses were performed using repeated measures ANOVA (all data from 0 – 72 h were utilized), with p values <0.05 considered statistically significant.
3. Results and Discussion
3.1. Design and synthesis of NIR760-XLP6
Scheme 1 depicts the synthetic pathway of NIR760-XLP6, which consists of a NIR fluorescent dye NIR760 and a new functional CB2R targeting ligand termed as XLP6. We recently reported NIR760 as a highly fluorescent dye with absorption and emission close to 800 nm, the most optimal wavelength for deep tissue imaging.[21] The ligand XLP6 was designed based on the pyrazolo[1,5-α]pyrimidine structure, which was recently reported to have high CB2R binding affinity and selectivity.[29] A unique feature of pyrazolopyrimidine molecules is that chemical modification of the moieties at the C2 position does not change their binding affinity and specificity at CB2R to a great extent. [29] Such an observation is rare in structure-activity relationship (SAR) studies of CB2R ligands and provides a unique opportunity for introducing functional groups at the desired strategic position. This is supported by the molecular modeling study, which indicates that the para-position of the phenyl ring may be exposed to an empty space of the binding pocket when the molecule binds to CB2R. To synthesize the functional analog of the pyrazolopyrimidine molecules, we started from 3-bormo-5-aminopyrazole using the reported procedure.[27] The bromo group at C-2 position not only eliminates the potential selectivity challenges between two carboxylic acids during amide coupling with 1-adamantylamine but also allows easy transformation to para-benzoic acid moiety using Suzuki coupling. Next, we introduced terminal amino group to XLP6, which allows for universal coupling to signaling moieties.
Scheme 1. Synthesis of NIR760-XLP6.

Reagents and conditions: (a) Diethyl ethoxymethylenemalonate, acetic acid, 120 °C, 3 h. (b) 1-Bromopentane, K2C03, DMF, 100 °C, 23 h. (c) 10% NaOH(aq), MeOH, 25 °C, 1 h, then pH = 4. (d) 1-Adamantylamine, DIEA, HBTU, DMF, 25 °C, 18 h. (e) 4-Carboxyphenylboronic acid, K2C03, Pd(PPh3)4, 1,4-dioxane, water, microwave, 20 min. (f) DIEA, HBTU, DMF, 2 h, 0 °C, then 1,6-diaminohexane, 25 °C, 18 h. (g) NIR760, DIEA, HBTU, HOBt, DMF, 25 °C, 18 h.
To synthesize NIR760-XLP6, pyrazolo[1,5-α]pyrimidine derivative 1 was prepared from 3-bormo-5-aminopyrazole according to literature.[27] Next, the secondary amine was successfully alkylated with 1-bromopentane to give compound 2. Carboxylic acid derivative 3 was obtained through a base hydrolysis of 2 and was subsequently coupled with 1-adamantylamine to produce the CB2R recognizing ligand as compound 4 (XLP4). A microwave assisted Suzuki coupling[30] between 4 and 4-carboxyphenylboronic acid using Pd(PPh3)4 as the catalyst provided benzoic acid derivative 5. Next, a hexanediamine linker was introduced via amide coupling to give ligand XLP6. Finally, another amide coupling reaction between XLP6 and NIR760 (synthesized according to our previous report[21]) yielded NIR760-XLP6. The structures were fully characterized by 1H NMR, 13C NMR and MS analysis (Figure SI-1 and Figure SI-2 in the Supporting Information)
3.2. Photophysical properties of NIR760-XLP6
The absorption and emission spectra of NIR760-XLP6 are shown in Figure 1 and compared with those of NIR760. The attachment of XLP6 to NIR760 resulted in a redshift of the maximum absorption from 760 to 766 nm. The molar extinction coefficient of NIR760-XLP6 is similar to that of NIR760 at 2.0 × 10⁵ and 2.1 × 10⁵ M-1cm-1, respectively. The fluorescence emission of NIR760-XLP6 also exhibits a redshift to 785 nm with a quantum yield of 11.6% in water, as compared to NIR760 at 780 nm with a quantum yield of 12.0%. (Table SI-1 in the Supporting Information).[31]
Figure 1.
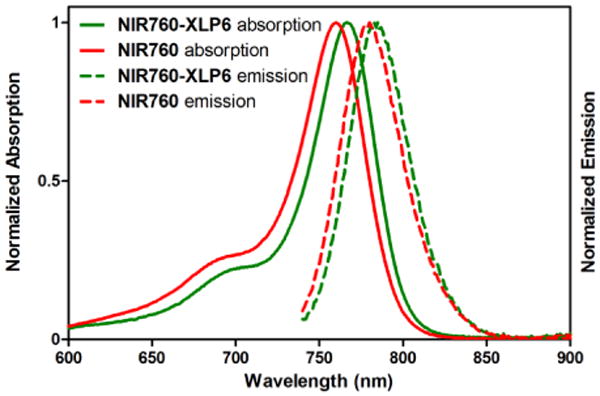
Normalized UV-vis absorption (solid lines) and emission (dotted lines) spectra of NIR760-XLP6 (green) and NIR760 (red) in water at a concentration of 1 × 10⁻⁶ M (λex = 725 nm).
3.3. Saturation binding study of NIR760-XLP6
The binding affinity of NIR760-XLP6 with DBT-CB2 cells was tested at endogenous levels.[32] To saturate receptor-binding sites and account for non-specific binding, a large excess of XLP4 was added to a parallel set of DBT-CB2 cells. We found that NIR760-XLP6 bound to CB2R with a nanomolar affinity (Kd = 169.1 ± 66.09 nM) (Figure SI-3 in the Supporting Information). In contrast, NIR760-XLP6 does not bind to DBT-CB1 cells, as the binding affinity was incalculable (Kd > 10000 nM, a CB1R ligand, SR141716A, was used as the blocking agent).
During the study, noticeable amount of non-specific binding of NIR760-XLP6 was observed. Unfortunately, this is a common challenge in the development of CB2R fluorescent probes. Introduction of a bulky fluorophore often leads to compromised ligand binding property.[17] Possible improvements of CB2R fluorescent probes design to address this issue include using smaller fluorescent dyes or developing advanced probe development strategies such as bioorthogonal chemistryCytotoxicity study of NIR760-XLP6
To examine the cytotoxicity of NIR760-XLP6, we used Doxorubicin, a commonly used chemotherapy drug, as the positive control and ICG, the only FDA approved NIR fluorescent dye, as the negative control. NIR760-XLP6 showed comparable low cytotoxicity with ICG whereas Doxorubicin showed high cytotoxicity at high concentrations (Figure SI-4 in the Supporting Information).
3.4. RT-PCR
The cannabinoid receptor expression in DBT-CB2 and DBT-CB1 cells were confirmed using RT-PCR. As expected, CB2R positive band at 165 bp and CB1R positive band at 65 bp were detected in DBT-CB2 and DBT-CB1 cells respectively (Figure SI-5 in the Supporting Information).
3.5. In vitro binding studies of NIR760-XLP6
We next studied the selectivity and specificity of NIR760-XLP6 with in vitro fluorescence imaging using DBT-CB2 and DBT-CB1 cells (see Figure 2a).[32] The two DBT cells were treated with NIR760-XLP6 and imaged using NIR fluorescence microscopy. We found that DBT-CB2 cells showed remarkably higher fluorescence signal than DBT-CB1 cells, indicating preferable binding of NIR760-XLP6 to CB2R over CB1R. Next, DBT-CB2 cells were pretreated with XLP4 as the blocking agent followed by NIR760-XLP6 treatment for specificity study. Compared to unchallenged cells, XLP4 significantly reduced the uptake of NIR760-XLP6 in DBT-CB2 cells. Furthermore, DBT-CB2 cells treated with non-targeted NIR760 failed to show significant fluorescence signal. These data suggest specific binding of NIR760-XLP6 to the target CB2R.
Figure 2.
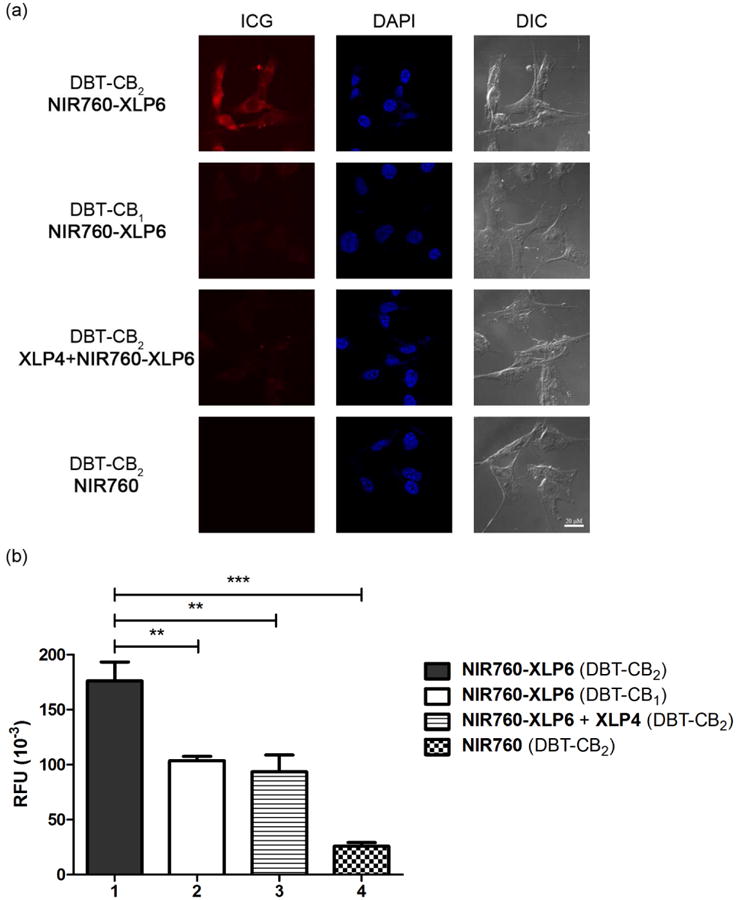
NIR760-XLP6 preferentially and specifically binds to CB2R over CB1R. (a) Fluorescence microscopy imaging of DBT-CB2 and DBT-CB1 cells. From left to right: NIR fluorescence (ICG filter, red), nuclear staining (DAPI filter, blue), differential interference contrast (DIC). Scale bar: 20 μm. (b) Cellular uptake of fluorescent probes is represented as relative fluorescence units (RFU) as quantified using a multiplate reader. Cells were divided into four groups as follow: (1) DBT-CB2 cells treated with NIR760-XLP6, (2) DBT-CB1 cells treated with NIR760-XLP6, (3) DBT-CB2 cells treated with XLP4 followed by NIR760-XLP6, and (4) DBT-CB2 cells treated with NIR760. Each data point represents the mean ± SEM based on triplicate samples.
To corroborate these finds, as well as quantitatively evaluate the selectivity and specificity of NIR760-XLP6 binding towards CB2R, we carried out intact cell uptake study using a multi-mode microplate reader as the second independent method. The results are shown in Figure 2b (in relative fluorescence units, RFU). NIR760-XLP6 treated DBT-CB2 cells showed approximately 40% higher fluorescence signal than that of DBT-CB1 cells (RFU: 176.3 ± 17.2 vs 103.5 ± 4.2, **p < 0.01, respectively). Blocking agent XLP4 effectively reduced the fluorescence signal of NIR760-XLP6 in DBT-CB2 cells (RFU: 93.7 ± 15.2 vs 176.3 ± 17.2, **p < 0.01, respectively). In addition, significantly lower fluorescent signal was observed when the DBT-CB2 cells were treated with non-targeted NIR760 dye instead of NIR760-XLP6 (RFU: 25.8 ± 3.4 vs 176.3 ± 17.2, ***p < 0.001, respectively). These results indicate that NIR760-XLP6 binds to CB2R both preferably and specifically.
3.6. In vivo optical imaging studies of NIR760-XLP6
To test the preferable targeting of NIR760-XLP6 to CB2R over CB1R in vivo, we imaged the probe uptake in tumor mouse model system. In vivo imaging experiments commenced approximately 10 days post-inoculation of DBT-CB2 and DBT-CB1 cells subcutaneously into the right flank of 6 - 8 week old female nu/nu mice. A total of twelve mice was divided into four groups to determine the time-resolved accumulation (n = 3 for each group): (1) DBT-CB2 tumor bearing mice injected with NIR760-XLP6 (10 nmol); (2) DBT-CB1 tumor bearing mice injected with NIR760-XLP6 (10 nmol); (3) DBT-CB2 tumor bearing mice injected with XLP4 (100 nmol) followed by NIR760-XLP6 (10 nmol) after 1 h; and (4) DBT-CB2 tumor bearing mice injected with free dye NIR760 (10 nmol). The resulting sizes and overall tumor growth of each set of DBT tumors showed no significant difference (data not shown). For time-resolved accumulation, images were captured at pre-injection, 1, 3, 6, 9, 24, 48, and 72 h post injection. One representative mouse from each group is shown and all images are time-dependent fluorescence images overlaid on the corresponding white light images (Figure 3a). To quantitatively compare the imaging contrast in the tumor region among the four groups of animals, region-of-interests (ROIs) at the tumor and normal tissue area in the left flank were selected. The fluorescence signal intensity of the tumor area (T) was normalized to that of the normal area (N) and plotted against time points to evaluate time-dependent tumor contrast enhancement (T/N) profiles (Figure 3b and Table SI-2 in the Supporting Information).
Figure 3.
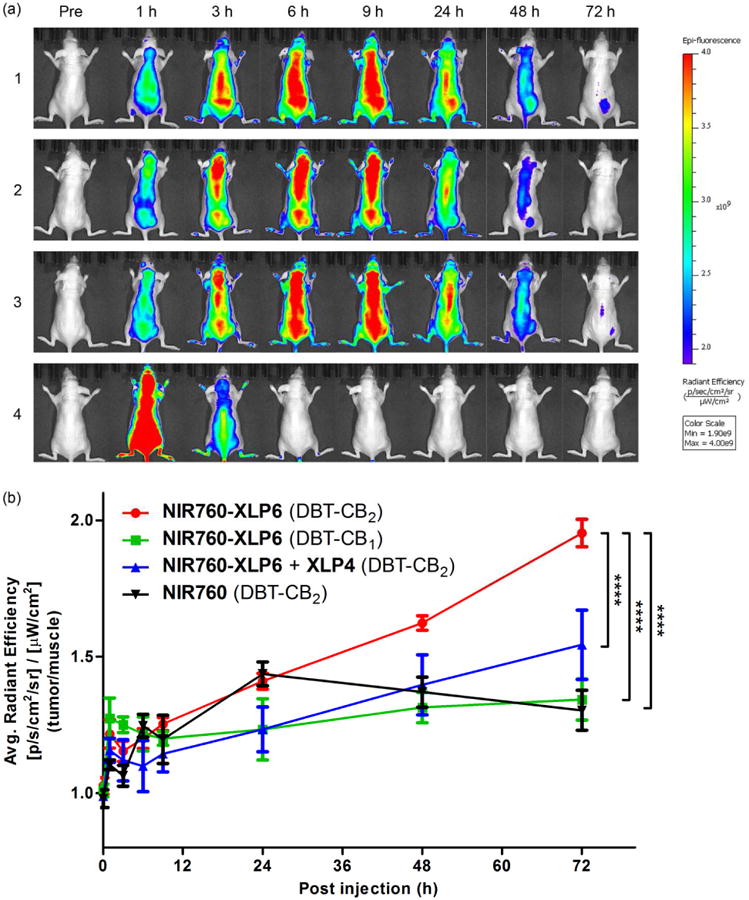
In vivo tumor optical imaging of NIR760-XLP6. (a) Mice images, at pre-injection, 1h, 3 h, 6 h, 9 h, 24 h, 48 h, and 72 h post-injection. All images are displayed at the same scale. (b) Tumor contrast enhancement (T/N signal ratio) profiles. All mice were divided into four groups as follow: (1, red ●) three DBT-CB2 tumor-bearing mice injected with NIR760-XLP6; (2, green ■) three DBT-CB1 tumor-bearing mice injected with NIR760-XLP6; (3, blue ▲) three DBT-CB2 tumor-bearing mice injected with XLP4 followed by NIR760-XLP6; and (4, black ▼) three DBT-CB2 tumor-bearing mice injected with NIR760. Each data point represents the mean ± SEM based on triplicate samples.
Upon injection, NIR760-XLP6 dispersed rapidly in mice during the first 9 h and then underwent a delayed clearance after 24 h. Higher T/N ratios were observed in DBT-CB2 tumor group than in the DBT-CB1 tumor group at 48 h (1.6 ± 0.0 vs 1.3 ± 0.1, ***p < 0.001, respectively) and 72 h (2.0 ± 0.1 vs 1.3 ± 0.1, ****p < 0.0001, respectively) post-injection. In compare with the NIR760-XLP6 treatment only DBT-CB2 tumor group, pretreatment of XLP4 reduced the T/N ratio at 48 h (1.6 ± 0.0 vs 1.4 ± 0.1, *p < 0.05, respectively) and 72 h (2.0 ± 0.1 vs 1.5 ± 0.1, ****p < 0.0001, respectively) post-injection. In contrast, NIR760 exhibited rapid biodistribution within 1 h post-injection followed by quick tissue clearance afterwards. The T/N ratio of free dye NIR760 was lower than that of NIR760-XLP6 at 48 h (1.4 ± 0.1 vs 1.6 ± 0.0, **p < 0.01, respectively) and 72 h (1.3 ± 0.1 vs 2.0 ± 0.1, ****p < 0.0001, respectively) post-injection. It is noteworthy that, after 6 h post-injection, the overall fluorescence intensity observed in this free dye group was more than one order of magnitude lower than that of the other groups (Figure SI-6 in the Supporting Information).
3.7. Ex vivo imaging and biodistribution study
To study the biodistribution and further evaluate the binding selectivity of NIR760-XLP6, all mice were euthanized after the last imaging time point. Tumor and selected organs (blood, heart, lung, liver, spleen, pancreas, kidneys, muscle from left leg, and brain) were excised and imaged (see Figure 4a). To assess the uptake of the NIR760-XLP6, ROIs along the excised tumors and organs were drawn and the corresponding fluorescence intensities were normalized to that of leg muscle. The target/normal signal ratio data were summarized in Figure 4b. Tumor contrast as high as 7.9 was observed in the DBT-CB2 tumor mice injected with NIR760-XLP6, which is 2-fold higher than that in the DBT-CB1 tumor mice (7.9 ± 0.8 vs 3.8 ± 0.7, **p < 0.01, respectively). Besides, certain organs, including lung, liver and kidney, also showed high target/normal ratios. However, no significant difference of target/normal ratios between DBT-CB2 and DBT-CB1 tumor mice was observed in these organs (Figure 4b and Table SI-3 of the Supporting Information). Furthermore, the DBT-CB2 tumor mice with XLP4 pretreatment revealed lower tumor contrast than that of non-blocking group (5.6 ± 0.7 vs 7.9 ± 0.8, *p < 0.05, respectively). Additionally, the NIR760 group showed significantly lower tumor contrast than NIR760-XLP6 injected DBT-CB2 tumor group (1.8 ± 0.4 vs 7.9 ± 0.8, ***p < 0.001, respectively). These results are consistent with those from in vitro and in vivo imaging studies, and provide further evidence on the preferable and specific binding of NIR760-XLP6 to CB2R over CB1R.
Figure 4.
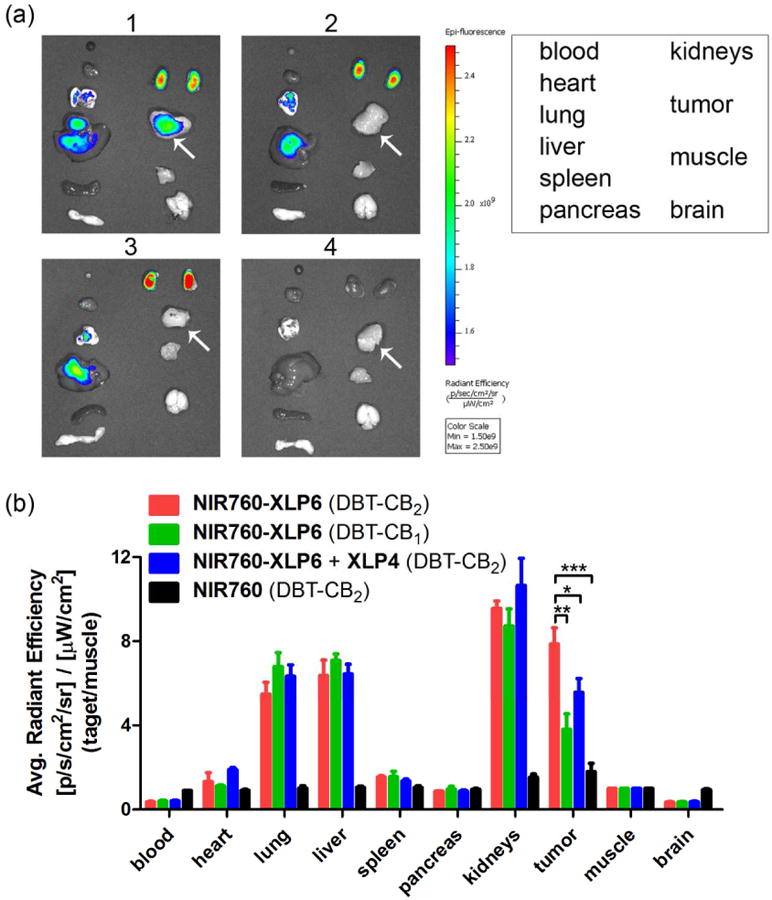
Ex vivo optical imaging and biodistribution study of NIR760-XLP6. (a) Ex vivo imaging of excised tumor and organs at 72 h post-injection from DBT-CB2 or DBT-CB1 tumor-bearing mice. The white arrow points to the tumor. (b) Graphical quantification of target/normal signal ratio. All mice were divided into four groups as follow: (1, red) Three DBT-CB2 tumor-bearing mice injected with NIR760-XLP6; (2, green) Three DBT-CB1 tumor-bearing mice injected with NIR760-XLP6; (3, blue) Three DBT-CB2 tumor-bearing mice injected with XLP4 followed by NIR760-XLP6; and (4, black) Three DBT-CB2 tumor-bearing mice injected with NIR760. Each data point represents the mean ± SEM based on triplicate samples.
4. Conclusion
In conclusion, we successfully developed a novel NIR fluorescent molecular probe, NIR760-XLP6, which preferentially binds to CB2R over CB1R both in vitro and in vivo. To the best of our knowledge, NIR760-XLP6 is the first optical imaging tool suitable for visualization of CB2R over CB1R preferentially. We envision that such a molecular probe will have great potential in studying the role of CB2R in various diseases and physiological conditions.
Supplementary Material
Figure SI-1. 1H NMR spectrum (400 MHz, DMSO-d6) of NIR760-XLP6.
Figure SI-2. 13C NMR spectrum (100 MHz, DMSO-d6) of NIR760-XLP6.
Figure SI-3. Saturation binding assay of NIR760-XLP6 in DBT-CB2 cells.
Figure SI-4. Cytotoxicity of NIR760-XLP6.
Figure SI-5. Expression of CB2R and CB1R in DBT cells.
Figure SI-6. In vivo overall tumor uptake of NIR760-XLP6.
Table SI-1: Photophysical properties of NIR760-XLP6 and NIR760 (free dye).
Table SI-2: T/N signal ratio at different time points.
Table SI-3: Ex vivo target/normal signal ratio.
Acknowledgments
This work was supported by a startup fund provided by the Department of Radiology, University of Pittsburgh. This project used the UPCI imaging facilities supported, in part, by award P30CA047904.
Footnotes
Publisher's Disclaimer: This is a PDF file of an unedited manuscript that has been accepted for publication. As a service to our customers we are providing this early version of the manuscript. The manuscript will undergo copyediting, typesetting, and review of the resulting proof before it is published in its final citable form. Please note that during the production process errors may be discovered which could affect the content, and all legal disclaimers that apply to the journal pertain.
References
- 1.Manzanares J, Julian MD, Carrascosa A. Role of the Cannabinoid System in Pain Control and Therapeutic Implications for the Management of Acute and Chronic Pain Episodes. Curr Neuropharmacol. 2006;4:239–57. doi: 10.2174/157015906778019527. [DOI] [PMC free article] [PubMed] [Google Scholar]
- 2.Cervino C, Pasquali R, Pagotto U. Cannabinoid Receptor Antagonists and the Metabolic Syndrome: Novel Promising Therapeutical Approaches. Mini-Rev Med Chem. 2007;7:21–30. doi: 10.2174/138955707779317812. [DOI] [PubMed] [Google Scholar]
- 3.Lopez-Rodriguez ML, Viso A, Ortega-Gutierrez S, Diaz-Laviadac I. Involvement of Cannabinoids in Cellular Proliferation. Mini-Rev Med Chem. 2005;5:97–106. doi: 10.2174/1389557053402819. [DOI] [PubMed] [Google Scholar]
- 4.Drysdale AJ, Platt B. Cannabinoids: Mechanisms and Therapeutic Applications in the CNS. Curr Med Chem. 2003;10:2719–32. doi: 10.2174/0929867033456387. [DOI] [PubMed] [Google Scholar]
- 5.Jonsson KO, Holt S, Fowler CJ. The Endocannabinoid System: Current Pharmacological Research and Therapeutic Possibilities. Basic Clin Pharmacol Toxicol. 2006;98:124–34. doi: 10.1111/j.1742-7843.2006.pto_376.x. [DOI] [PubMed] [Google Scholar]
- 6.Demuth DG, Molleman A. Cannabinoid signalling. Life Sci. 2006;78:549–63. doi: 10.1016/j.lfs.2005.05.055. [DOI] [PubMed] [Google Scholar]
- 7.Scotter EL, Abood ME, Glass M. The endocannabinoid system as a target for the treatment of neurodegenerative disease. Br J Pharmacol. 2010;160:480–98. doi: 10.1111/j.1476-5381.2010.00735.x. [DOI] [PMC free article] [PubMed] [Google Scholar]
- 8.Caffarel MM, Andradas C, Pérez-Gómez E, Guzmán M, Sánchez C. Cannabinoids: A new hope for breast cancer therapy? Cancer Treat Rev. 2012;38:911–8. doi: 10.1016/j.ctrv.2012.06.005. [DOI] [PubMed] [Google Scholar]
- 9.Pisanti S, Malfitano AM, Grimaldi C, Santoro A, Gazzerro P, Laezza C, et al. Use of cannabinoid receptor agonists in cancer therapy as palliative and curative agents. Best Pract Res Clin Endocrinol Metab. 2009;23:117–31. doi: 10.1016/j.beem.2009.02.001. [DOI] [PubMed] [Google Scholar]
- 10.Vidinsky B, Gal P, Pilatova M, Vidova Z, Solar P, Varinska L, et al. Anti-proliferative and anti-angiogenic effects of CB2R agonist (JWH-133) in non-small lung cancer cells (A549) and human umbilical vein endothelial cells: an in vitro investigation. Folia Biol (Praha) 2012;58:75–80. [PubMed] [Google Scholar]
- 11.Whiteside GT, Lee GP, Valenzano KJ. The Role of the Cannabinoid CB2 Receptor in Pain Transmission and Therapeutic Potential of Small Molecule CB2 Receptor Agonists. Curr Med Chem. 2007;14:917–36. doi: 10.2174/092986707780363023. [DOI] [PubMed] [Google Scholar]
- 12.Atwood BK, Mackie K. CB2: a cannabinoid receptor with an identity crisis. Br J Pharmacol. 2010;160:467–79. doi: 10.1111/j.1476-5381.2010.00729.x. [DOI] [PMC free article] [PubMed] [Google Scholar]
- 13.Micale V, Mazzola C, Drago F. Endocannabinoids and neurodegenerative diseases. Pharmacol Res. 2007;56:382–92. doi: 10.1016/j.phrs.2007.09.008. [DOI] [PubMed] [Google Scholar]
- 14.Bai M, Bornhop DJ. Recent Advances in Receptor-Targeted Fluorescent Probes for In Vivo Cancer Imaging. Curr Med Chem. 2012;19:4742–58. doi: 10.2174/092986712803341467. [DOI] [PubMed] [Google Scholar]
- 15.Yang P, Wang L, Xie XQ. Latest advances in novel cannabinoid CB2 ligands for drug abuse and their therapeutic potential. Future Med Chem. 2012;4:187–204. doi: 10.4155/fmc.11.179. [DOI] [PMC free article] [PubMed] [Google Scholar]
- 16.Martín-Couce L, Martín-Fontecha M, Palomares Ó, Mestre L, Cordomí A, Hernangomez M, et al. Chemical Probes for the Recognition of Cannabinoid Receptors in Native Systems. Angew Chem Int Ed. 2012;51:6896–9. doi: 10.1002/anie.201200467. [DOI] [PubMed] [Google Scholar]
- 17.Yates AS, Doughty SW, Kendall DA, Kellam B. Chemical modification of the naphthoyl 3-position of JWH-015: In search of a fluorescent probe to the cannabinoid CB2 receptor. Bioorg Med Chem Lett. 2005;15:3758–62. doi: 10.1016/j.bmcl.2005.05.049. [DOI] [PubMed] [Google Scholar]
- 18.Sexton M, Woodruff G, Horne Eric A, Lin Yi H, Muccioli Giulio G, Bai M, et al. NIR-mbc94, a Fluorescent Ligand that Binds to Endogenous CB2 Receptors and Is Amenable to High-Throughput Screening. Chem Biol. 2011;18:563–8. doi: 10.1016/j.chembiol.2011.02.016. [DOI] [PMC free article] [PubMed] [Google Scholar]
- 19.Bai M, Sexton M, Stella N, Bornhop DJ. MBC94, a Conjugable Ligand for Cannabinoid CB2 Receptor Imaging. Bioconjugate Chem. 2008;19:988–92. doi: 10.1021/bc700419e. [DOI] [PMC free article] [PubMed] [Google Scholar]
- 20.Burston JJ, Sagar DR, Shao P, Bai M, King E, Brailsford L, et al. Cannabinoid CB2 Receptors Regulate Central Sensitization and Pain Responses Associated with Osteoarthritis of the Knee Joint. PLoS ONE. 2013;8:e80440. doi: 10.1371/journal.pone.0080440. [DOI] [PMC free article] [PubMed] [Google Scholar]
- 21.Zhang S, Shao P, Bai M. In Vivo Type 2 Cannabinoid Receptor-Targeted Tumor Optical Imaging Using a Near Infrared Fluorescent Probe. Bioconjugate Chem. 2013;24:1907–16. doi: 10.1021/bc400328m. [DOI] [PMC free article] [PubMed] [Google Scholar]
- 22.Wu Z, Shao P, Zhang S, Bai M. Targeted zwitterionic near infrared fluorescent probe for improved imaging of type 2 cannabinoid receptors. J Biomed Opt. 2014;19:036006. doi: 10.1117/1.JBO.19.3.036006. [DOI] [PMC free article] [PubMed] [Google Scholar]
- 23.Wu Z, Shao P, Zhang S, Ling X, Bai M. Molecular imaging of human tumor cells that naturally overexpress type 2 cannabinoid receptors using a quinolone-based near-infrared fluorescent probe. J Biomed Opt. 2014;19:076016. doi: 10.1117/1.JBO.19.7.076016. [DOI] [PubMed] [Google Scholar]
- 24.Benito C, Romero JP, Tolon RM, Clemente D, Docagne F, Hillard CJ, et al. Cannabinoid CB1 and CB2 receptors and fatty acid amide hydrolase are specific markers of plaque cell subtypes in human multiple sclerosis. J Neurosci. 2007;27:2396–402. doi: 10.1523/JNEUROSCI.4814-06.2007. [DOI] [PMC free article] [PubMed] [Google Scholar]
- 25.Han KH, Lim S, Ryu J, Lee CW, Kim Y, Kang JH, et al. CB1 and CB2 cannabinoid receptors differentially regulate the production of reactive oxygen species by macrophages. Cardiovasc Res. 2009;84:378–86. doi: 10.1093/cvr/cvp240. [DOI] [PubMed] [Google Scholar]
- 26.Munro S, Thomas KL, Abu-Shaar M. Molecular characterization of a peripheral receptor for cannabinoids. Nature. 1993;365:61–5. doi: 10.1038/365061a0. [DOI] [PubMed] [Google Scholar]
- 27.Moy FJ, Lee A, Gavrin LK, Xu ZB, Sievers A, Kieras E, et al. Novel Synthesis and Structural Characterization of a High-Affinity Paramagnetic Kinase Probe for the Identification of Non-ATP Site Binders by Nuclear Magnetic Resonance. J Med Chem. 2009;53:1238–49. doi: 10.1021/jm901525b. [DOI] [PubMed] [Google Scholar]
- 28.Lee H, Mason JC, Achilefu S. Heptamethine Cyanine Dyes with a Robust C-C Bond at the Central Position of the Chromophore. J Org Chem. 2006;71:7862–5. doi: 10.1021/jo061284u. [DOI] [PubMed] [Google Scholar]
- 29.Aghazadeh Tabrizi M, Baraldi PG, Saponaro G, Moorman AR, Romagnoli R, Preti D, et al. Discovery of 7-Oxopyrazolo[1,5-a]pyrimidine-6-carboxamides as Potent and Selective CB2 Cannabinoid Receptor Inverse Agonists. J Med Chem. 2013;56:4482–96. doi: 10.1021/jm400182t. [DOI] [PubMed] [Google Scholar]
- 30.Dallinger D, Kappe CO. Microwave-Assisted Synthesis in Water as Solvent. Chem Rev. 2007;107:2563–91. doi: 10.1021/cr0509410. [DOI] [PubMed] [Google Scholar]
- 31.Lee H, Berezin MY, Guo K, Kao J, Achilefu S. Near-Infrared Fluorescent pH-Sensitive Probes via Unexpected Barbituric Acid Mediated Synthesis. Org Lett. 2008;11:29–32. doi: 10.1021/ol802363x. [DOI] [PMC free article] [PubMed] [Google Scholar]
- 32.Cudaback E, Marrs W, Moeller T, Stella N. The Expression Level of CB1 and CB2 Receptors Determines Their Efficacy at Inducing Apoptosis in Astrocytomas. PLoS ONE. 2010;5:e8702. doi: 10.1371/journal.pone.0008702. [DOI] [PMC free article] [PubMed] [Google Scholar]
Associated Data
This section collects any data citations, data availability statements, or supplementary materials included in this article.
Supplementary Materials
Figure SI-1. 1H NMR spectrum (400 MHz, DMSO-d6) of NIR760-XLP6.
Figure SI-2. 13C NMR spectrum (100 MHz, DMSO-d6) of NIR760-XLP6.
Figure SI-3. Saturation binding assay of NIR760-XLP6 in DBT-CB2 cells.
Figure SI-4. Cytotoxicity of NIR760-XLP6.
Figure SI-5. Expression of CB2R and CB1R in DBT cells.
Figure SI-6. In vivo overall tumor uptake of NIR760-XLP6.
Table SI-1: Photophysical properties of NIR760-XLP6 and NIR760 (free dye).
Table SI-2: T/N signal ratio at different time points.
Table SI-3: Ex vivo target/normal signal ratio.