Abstract
Human higher cognition is attributed to the evolutionary expansion and elaboration of the human cerebral cortex. However, the genetic mechanisms contributing to these developmental changes are poorly understood. We used comparative epigenetic profiling of human, rhesus macaque and mouse corticogenesis to identify promoters and enhancers that have gained activity in humans. These gains are significantly enriched in modules of co-expressed genes in the cortex that function in neuronal proliferation, migration, and cortical map organization. Gain-enriched modules also showed correlated gene expression patterns and similar transcription factor binding site enrichments in promoters and enhancers, suggesting they are connected by common regulatory mechanisms. Our results reveal coordinated patterns of potential regulatory changes associated with conserved developmental processes during corticogenesis, providing insight into human cortical evolution.
The massive expansion and functional elaboration of the neocortex underlies the advanced cognitive abilities of humans (1). Although the overall process of corticogenesis is broadly conserved across mammals, humans exhibit differences that emerge within the first 12 weeks of gestation. Among these are an increased duration of neurogenesis, increases in the number and diversity of progenitors, modification of neuronal migration, and introduction of new connections among functional areas (2, 3). The genetic changes responsible for these evolutionary novelties are largely unknown.
Changes in gene regulation are hypothesized to be a major source of evolutionary innovation during development (1, 3–4). Critical events in corticogenesis, including the specification of cortical areas and differentiation of cortical layers, rely on the precise control of gene expression (4). The evolution of uniquely human cortical features required changes in many of these early developmental processes, which may have been driven by modifications in the gene regulatory programs that govern them. However, identifying such regulatory changes and linking them to relevant biological processes has proven to be challenging. Previous efforts have relied on comparative genomics, or on gene expression comparisons at later developmental and adult stages (5–7). Further progress has been hindered by the lack of genome-wide maps of regulatory function during corticogenesis.
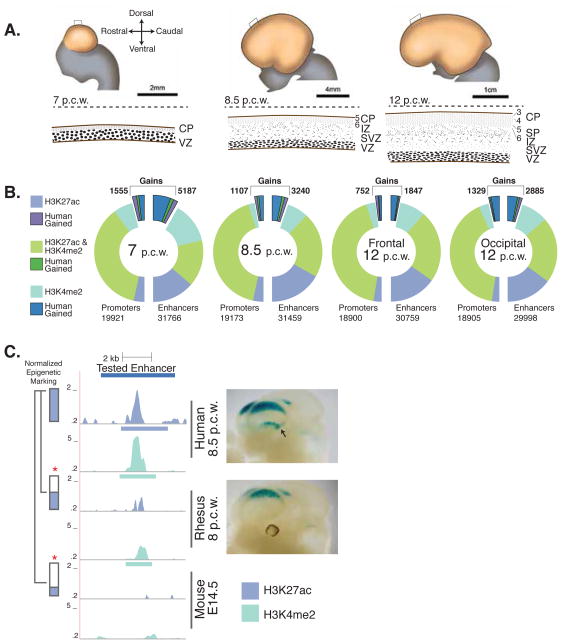
Genome-wide profiling of post-translational histone modifications associated with regulatory functions has been used to compare regulatory element activities across species (8–12). Here we profiled H3K27ac and H3K4me2 to map active promoters and enhancers during human, rhesus macaque and mouse corticogenesis, and to identify increases in their activity in humans. We examined biological replicates of whole human cortex at 7 post conception weeks (p.c.w.) and 8.5 p.c.w., and primitive frontal and occipital tissues from 12 p.c.w (Fig. 1A). These stages span the appearance of the transient embryonic zones that generate cortical neurons from the deep to the superficial layers, when uniquely human features of the cortex begin to emerge (13–15). Homologous rhesus and mouse time points were selected on the basis of cross-species studies of cortical development (13–16). The mouse cortex develops over the course of a week (E11.5 to E17.5), adhering to the same general developmental processes observed in primates during this homologous time frame (16).
Figure 1. Comparative epigenetic analysis of corticogenesis in human, rhesus and mouse.
A) Top. Stages of human cortical development from 7–12 post conception weeks (p.c.w). The location of the cross-section shown below each whole cortex illustration is indicated by a box. Bottom. Schematized cross sections of the developing cortex. Progenitors in the ventricular zone (VZ) produce neurons that are amplified in number in the growing subventricular zone (SVZ), and then migrate through the intermediate zone (IZ) to their final destination in the cortical plate (CP). Cortical layers (e.g., L5, L6) present at each time point are shown. B) Number of promoters and enhancers at each human time point that are reproducibly marked by H3K27ac, H3K4me2, or both, with the number of human gains highlighted in bold. C) Left. Human lineage epigenetic gain at a known human forebrain enhancer. The levels of H3K27ac (blue) and H3K4me2 (teal) at the orthologous locations in human, rhesus and mouse are shown. Right. LacZ reporter gene expression driven by the human (top) and orthologous rhesus (bottom) enhancers in E11.5 transgenic mouse embryos. The ventral expression domain specific to human is indicated by an arrow (see also Fig. S7).
We identified 22,139 promoters (34% of unique genes in Gencode version 10) and 52,317 enhancers active in the human cortex during at least one developmental stage (Fig. 1B). H3K27ac and H3K4me2 are highly concordant at promoters, with 85% of sites marked by both histone modifications. Histone modification signatures were less concordant at enhancers, with 45% of all sites marked by both H3K27ac and H3K4me2. This is consistent with studies suggesting H3K27ac and H3K4me2 identify both overlapping and distinct sets of enhancers (11). We identified 16,473 enhancers most strongly marked by H3K27ac in the cortex relative to seven other human tissues (Fig. S1A) (17). These enhancers are significantly enriched near genes associated with cortical development, such as positive regulation of neurogenesis (binomial test p≤1×10−53) and neural precursor cell proliferation (binomial test p≤1×10⁻²⁹ (Fig. S1B) (18). Both marks also significantly enrich for enhancers active in the developing cortex versus other tissues (Fisher’s exact test p≤1×10⁻¹⁵), identifying over 80% of known forebrain enhancers (Fig. S2A–F) (17,19,20). We also identified 74,189 promoters and enhancers active in rhesus and 74,809 in mouse, generating a dense map of regulatory function during corticogenesis across species.
In principal component analysis (PCA), H3K27ac signals clustered first by embryonic tissue type, then by evolutionary distance (Fig. S3A) (17). H3K27ac signals in human and mouse cortex were also more similar by PCA than signatures from homologous human and mouse adult tissues or embryonic stem cells (Fig. S3B) (17). Spearman correlation analysis of H3K27ac and H3K4me2 cortex signals supported strong replicate reproducibility in all datasets, as well as higher correlations between rhesus and human cortex compared to mouse (Fig. S4A,B).
To identify promoters and enhancers showing quantitative epigenetic gains in human versus both rhesus and mouse, we compared the level of H3K27ac or H3K4me2 signal in replicating human peaks to the signals at corresponding orthologous sites in the other two species (9, 17) (Fig. S5). Human gains were called on the basis of an increase in H3K27ac or H3K4me2 signal compared to all rhesus and mouse datasets for each mark (17). We note that we may be overestimating gains at 7 p.c.w., due to the lack of an early developmental stage in rhesus. However, this concern is mitigated by our inclusion of a comparable mouse time point and our requirement that each human site exhibit an epigenetic gain compared to all mouse and rhesus time points and tissues. In total, 8,996 non-overlapping enhancers and 2,855 promoters show epigenetic gains in human (Fig. 1B). To assess the robustness of these gains, we examined human gains relative to mouse at 77 sites by ChIP-qPCR using additional biological replicates (Fig. S6A, B). 67 of these sites (87%) showed a gain in human, supporting the reproducibility of the epigenetic gain calls from our genome-wide analysis (17). We then explored this high-confidence set of gains to obtain insight into their origins and relevance to human cortical evolution.
We first considered whether epigenetic gains could be attributed to human-specific sequence changes. 48 highly conserved noncoding regions displaying accelerated evolution in humans exhibit increased H3K27ac or H3K4me2 in human cortex (Table S1) (5, 6). However, gains in general do not show increased rates of human-specific sequence change, suggesting that the majority of our gains cannot be identified by sequence acceleration alone (Table S1).
In light of this result, we examined epigenetic gains at known human enhancers active in embryonic forebrain to determine if gains reveal changes in regulatory function (19) (Table S1). In a proof-of-principle experiment, we compared the activities of a human forebrain enhancer exhibiting a gain and its rhesus ortholog using a mouse embryonic transgenic enhancer assay (20). The human enhancer drove reproducible reporter gene expression in two telencephalon domains: a wide caudal-dorsal domain and a caudal-ventral stripe (Fig. 1C). The rhesus ortholog drove qualitatively weaker reporter gene expression in a similar caudal-dorsal domain, but did not drive reproducible activity in the human caudal-ventral domain. Upon sectioning, we determined that the dorsal domain was restricted to the neocortex, while the human ventral domain corresponded to the caudal ganglionic eminence (Fig. S7C).
We also searched for genomic regions with a high density of enhancers or promoters exhibiting gains. We used previously defined maps of long-range genomic interactions to demarcate putative regulatory domains maintained across tissues and species (17, 21). This analysis revealed genes within topologically delimited domains that are “hotspots” of epigenetic gains (Fig. S8A–D, Table S2). We identified 301 genes within a gain-enriched hotspot that included at least one gene with a promoter gain, notably TGFβR3, COL13A1, EPHA2, and LMX1B.
To obtain global insights into biological pathways associated with human lineage epigenetic gains, we integrated gains with gene co-expression network analyses (22). We generated a co-expression network using public RNA-seq data from multiple neocortical areas spanning 8–15 p.c.w., which includes the periods of corticogenesis in which we mapped H3K27ac and H3K4me2 signatures (Figs. 2A, S9A, Table S3; www.brainspan.org) (23). This network consists of 96 modules, each of which is a set of genes showing highly correlated expression across multiple neocortical regions and developmental stages. Genes in each module may be co-regulated and may participate in related biological processes. Hub genes are defined as genes with connectivity values in the top 5% for each module, suggesting they include important regulators that drive correlated gene expression. Epigenetic gains at promoters were directly assigned to their target genes, while gains at enhancers were assigned on the basis of their proximity to annotated genes (17, 18).
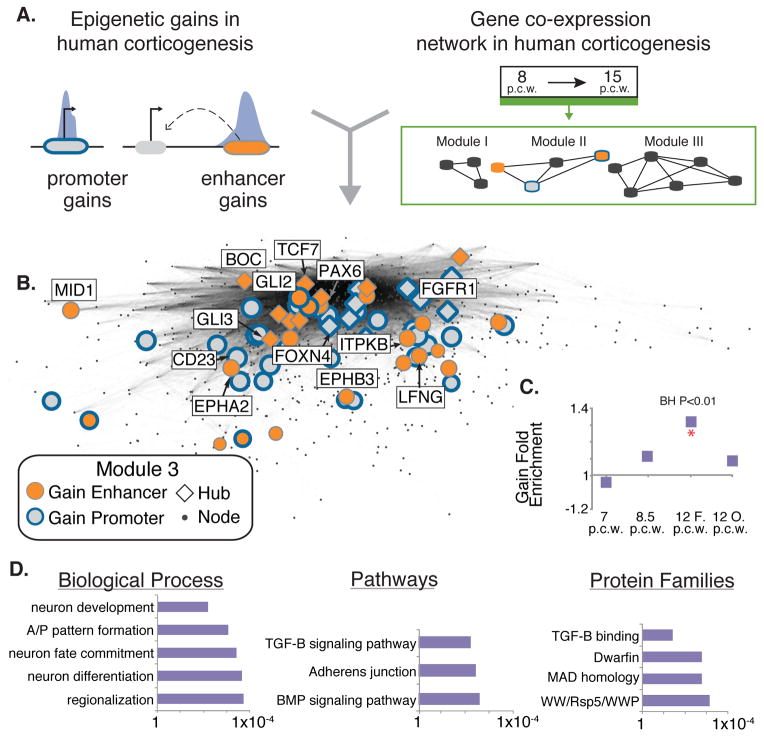
Figure 2. Identifying modules of co-expressed genes enriched for epigenetic gains in human corticogenesis.
A) Schematic illustrating integration of epigenetic gains into co-expression networks. B) A co-expression module enriched for H3K27ac enhancer gains. Genes associated with gains are highlighted, and genes representative of the biological enrichments associated with the module are labeled. The module was rendered using multidimensional scaling (17). C) Fold enrichment of H3K27ac enhancer gains at each human time point in this module (* = BH corrected permutation P value < 0.01). D) Gene Ontology enrichments for genes associated with gains in this module. P values were calculated using a binomial test in DAVID (17).
We used permutation analysis to identify modules significantly enriched in human lineage gains at enhancers or promoters (Fig. S9B–C) (17). Seventeen modules are enriched for H3K27ac or H3K4me2 gains in at least one human developmental stage. Overall, gains are consistently enriched in modules containing genes associated with biological processes crucial for cortical development (Table S4). For example, Module 3 (Fig. 2B) is enriched for human lineage H3K27ac enhancer gains that are associated with genes implicated in neuronal progenitor proliferation. Gene Ontology categories showing significant enrichment include neuronal differentiation (binomial test p= 2.13×10⁻⁴) and neuron fate commitment (binomial test p= 3.67×10⁻⁴) (Fig. 2D). Epigenetic gains in this module are associated with genes critical for cortical development, including PAX6, GLI3, and FGFR1. Each of these is a hub gene, consistent with their known contributions to fundamental processes in corticogenesis. Notably, PAX6 controls cortical cell number by regulating cell cycle exit of neural progenitor cells, and Pax6 null mice have a depleted progenitor pool and reduced cortical neuron number (24). Heightened signaling through FGFR1 during rat corticogenesis increases neuron number by over 80% (25).
Module 15 is enriched in human H3K27ac and H3K4me2 promoter gains (Benjamini-Hochberg permutation p=.003) (Fig. S10A) associated with cortical patterning ontologies, such as regionalization (binomial test p=7.53×10⁻⁴) and forebrain development (binomial test p=1.63×10⁻⁵) (Fig. S10B). Homeobox genes are notably enriched among genes associated with gains in this module (binomial test p=1.18×10⁻⁸).
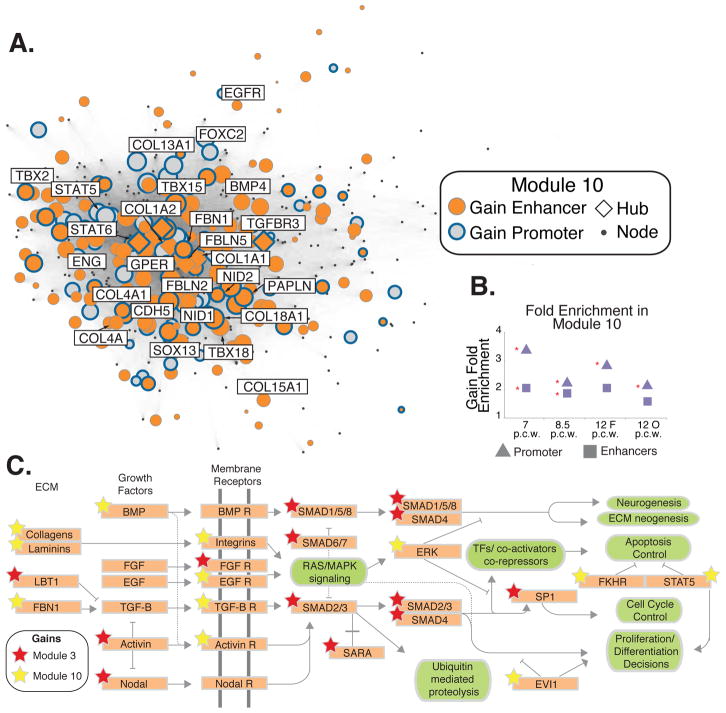
Module 10 shows the strongest enrichment of human lineage H3K27ac and H3K4me2 promoter and enhancer gains in the network (Fig. 3A–B). Genes implicated in extracellular matrix (ECM) functions are significantly overrepresented among gain-associated genes in this module (binomial test p=2.26×10⁻⁷) (Table S5). The ECM contributes to the maintenance of human progenitor cell self-renewal and neuronal migration (26). Module 10 gain-associated genes are also enriched for TGFβ and FGF pathway members (binomial test p=2.42×10⁻³). Notably, both Module 10 and Module 3 include gain-associated genes belonging to the TGFβ and FGF pathways (Fig. 3C). The association of gains with biologically related genes across multiple enriched modules suggests there may be regulatory coordination and potential transcription factor (TF) crosstalk among these modules.
Figure 3. Enrichment of epigenetic gains in Module 10.
A) Epigenetic gains mapped onto Module 10; genes associated with gains are highlighted as in Figure 2B. B). Fold enrichment of H3K27ac promoter or enhancer gains at each human time point in this module (* = BH permutation P value <0.01). C) Genes in the related FGF, TGFβ, BMP, and ECM signaling pathways are associated with gains from Module 10 (yellow stars) and Module 3 (red stars). Genes or gene families are highlighted in orange; associated biological processes are in green. The pathway shown is derived from KEGG pathway annotations.
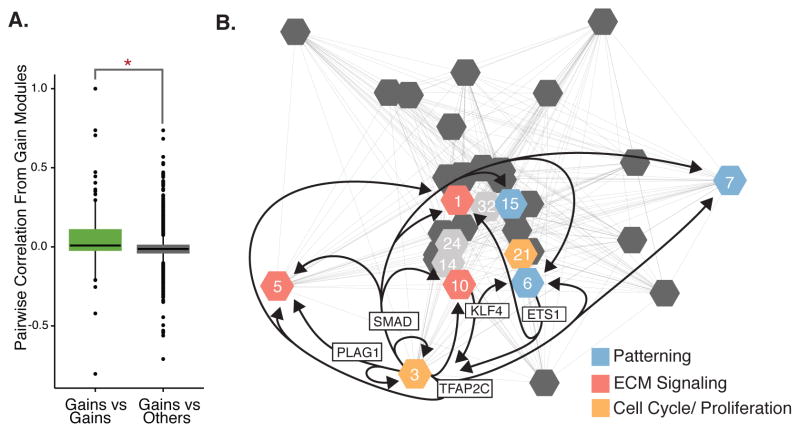
Consistent with this hypothesis, gain-enriched modules exhibited significantly higher gene expression correlations with each other than with other modules in the network (Wilcoxon p< 1×10⁻¹⁵) (Fig. 4A). Moreover, gain-associated genes in enriched modules converge on related biological functions (Fig. 4B). To identify regulatory signatures underlying the correlation of these modules, we predicted transcription factor binding sites in all active promoters and enhancers in our dataset, including human lineage gains. We then identified enriched TF motifs in enhancers or promoters assigned to each module. Many motifs were enriched in promoters and enhancers assigned to the same module as the transcription factor itself. Surprisingly, we also identified TF motifs enriched across multiple modules. For example, SMAD binding motifs were enriched in active promoters in Module 10, although SMAD transcription factors are not included in this module (BH permutation test p= 7.92×10⁻³); Table S5). The observed transcription factor binding site enrichment patterns suggest regulatory cross-talk among gain-enriched modules that may contribute to their highly correlated expression.
Figure 4. Modules enriched for epigenetic gains converge on common biological processes.
A) Gain enriched modules exhibit significantly higher gene expression correlation values with each other than with modules not enriched for gains (* = Wilcoxon rank sum test P value < 1.1×10⁻¹⁵). B) Eigengene expression correlations among the top 35 modules (as ranked by number of genes). Modules enriched in gains are numbered. Ontologies associated with gains in each module are highlighted. Arrows connect modules that include each transcription factor shown with modules that are enriched for that factor’s binding motif.
In summary, our results reveal a striking convergence of human lineage epigenetic gains on common biological processes and regulatory pathways in corticogenesis. Epigenetic gains are enriched in modules important for neuronal proliferation, cortical patterning, and the ECM. Moreover, gain-associated genes in each module are enriched for similar conserved biological functions as all genes in the entire module (Table S4). These findings suggest many human lineage regulatory changes operate within, and have potentially modified, older regulatory mechanisms and developmental processes essential for building the mammalian cortex.
The epigenetic changes associated with these conserved biological pathways also predominantly occur at sequences with ancestral regulatory activity. The majority of human lineage gains involve potential modification of promoters or enhancers marked by H3K27ac in rhesus or mouse cortex (Fig. S11) (10). A smaller proportion of gains may arise from co-option of ancestral regulatory sequences active in non-cortical tissues. Human gains not marked in any of the 2 rhesus or 20 mouse tissues we examined may include de novo regulatory functions arising on the human lineage. We note that epigenetic gains may be due to genetic changes in human that directly altered regulatory functions, or may reflect coordinated changes in cellular composition in the human cortex compared to rhesus and mouse. Distinguishing between these two modalities of evolutionary change will require functional analysis of the sequences underlying epigenetic gains using mouse transgenic assays and humanized mouse models. Such studies would also provide insight into the biological relevance of the molecular changes described here.
The convergence of human regulatory innovations on developmentally related functions is also consistent with the biological complexity of the cortex. Neocortical development requires the orchestration of spatially and temporally distinct, but biologically interconnected mechanisms. In the context of this interdependency, it has been postulated that human cortical evolution involved coordinated changes in multiple processes during corticogenesis (3). For example, changes in progenitor proliferation likely required concomitant changes in patterning and connectivity to generate novel cortical functions (1). The inventory of human lineage regulatory changes we identified provides the means to evaluate this hypothesis and dissect the genetic mechanisms underlying the evolution of the human cortex.
Supplementary Material
Acknowledgments
This work was supported by National Institutes of Health grants GM094780 (to J.P.N.), DA023999 (to P.R.), NS014841 (to P.R), F32 GM106628 (to D.E.), a Brown Coxe Fellowship in the Medical Sciences (to J.Y.), and an NSF Graduate Research Fellowship (to S.K.R.). Human tissue was provided by the Joint MRC / Wellcome Trust (grant # 099175/Z/12/Z) Human Developmental Biology Resource (http://hdbr.org). We thank S. Mane, K. Bilguvar, S. Umlauf, and A. Lopez at the Yale Center for Genome Analysis for sequencing data; the members of the BrainSpan consortium for providing human brain transcriptome data to the research community; N. Carriero and R. Bjornson at the Yale University Biomedical Performance Computing Center for computing support; T. Nottoli and C. Pease at the Yale Animal Genomics Service for generating transgenic mice; and S. Wilson and M. Horn for veterinary care of nonhuman primates. All ChIP-seq data is available through the Gene Expression Omnibus (GEO) under accession number GSE63649.
Footnotes
Materials and Methods
References (27–44)
References and Notes
- 1.Geschwind DH, Rakic P. Neuron. 2013;80:633–647. doi: 10.1016/j.neuron.2013.10.045. [DOI] [PMC free article] [PubMed] [Google Scholar]
- 2.Schwartz ML, Rakic P, Goldman-Rakic PS. Proc Natl Acad Sci USA. 1991;88:1354–1358. doi: 10.1073/pnas.88.4.1354. [DOI] [PMC free article] [PubMed] [Google Scholar]
- 3.Rakic P. Nat Rev Neurosci. 2009;10:724–735. doi: 10.1038/nrn2719. [DOI] [PMC free article] [PubMed] [Google Scholar]
- 4.Rakic P, Ayoub AE, Breunig JJ, Dominguez MH. Trends Neurosci. 2009;32:291–301. doi: 10.1016/j.tins.2009.01.007. [DOI] [PMC free article] [PubMed] [Google Scholar]
- 5.Prabhakar S, Noonan JP, Paabo S, Rubin EM. Science. 2006;314:786–786. doi: 10.1126/science.1130738. [DOI] [PubMed] [Google Scholar]
- 6.Capra JA, Erwin GD, McKinsey G, Rubenstein JLR, Pollard KS. Philosophical Transactions of the Royal Society: Biological Sciences. 2013;368:20130025–20130025. doi: 10.1098/rstb.2013.0025. [DOI] [PMC free article] [PubMed] [Google Scholar]
- 7.Konopka G, et al. Neuron. 2012;75:601–617. doi: 10.1016/j.neuron.2012.05.034. [DOI] [PMC free article] [PubMed] [Google Scholar]
- 8.Cotney J, et al. Genome Research. 2012;22:1069–1080. doi: 10.1101/gr.129817.111. [DOI] [PMC free article] [PubMed] [Google Scholar]
- 9.Cotney J, et al. Cell. 2013;154:185–196. doi: 10.1016/j.cell.2013.05.056. [DOI] [PMC free article] [PubMed] [Google Scholar]
- 10.Rada-Iglesias A, et al. Nature. 2011;470:279–283. doi: 10.1038/nature09692. [DOI] [PMC free article] [PubMed] [Google Scholar]
- 11.Ernst J, et al. Nature. 2011;473:43–49. doi: 10.1038/nature09906. [DOI] [PMC free article] [PubMed] [Google Scholar]
- 12.Mikkelsen TS, et al. Cell. 2010;143:156–169. doi: 10.1016/j.cell.2010.09.006. [DOI] [PMC free article] [PubMed] [Google Scholar]
- 13.Rakic P. Science. 1974;183:425–427. doi: 10.1126/science.183.4123.425. [DOI] [PubMed] [Google Scholar]
- 14.Rakic P. Science. 1988;241:170–176. doi: 10.1126/science.3291116. [DOI] [PubMed] [Google Scholar]
- 15.Rakic P, Sidman RL. Journal of Neuropathology & Experimental Neurology. 1968;27:240. [PubMed] [Google Scholar]
- 16.Takahashi T, Goto T, Miyama S, Nowakowski RS, Caviness VS. J Neurosci. 1999;19:10357–10371. doi: 10.1523/JNEUROSCI.19-23-10357.1999. [DOI] [PMC free article] [PubMed] [Google Scholar]
- 17.Supplementary Methods.
- 18.Mclean CY, et al. Nature Biotechnology. 2010;28:1630–1639. doi: 10.1038/nbt.1630. [DOI] [PMC free article] [PubMed] [Google Scholar]
- 19.Visel A, Minovitsky S, Dubchak I, Pennacchio LA. Nucleic Acids Research. 2007;35:D88–92. doi: 10.1093/nar/gkl822. [DOI] [PMC free article] [PubMed] [Google Scholar]
- 20.Visel A, et al. Cell. 2013;152:895–908. doi: 10.1016/j.cell.2012.12.041. [DOI] [PMC free article] [PubMed] [Google Scholar]
- 21.Dixon JR, et al. Nature. 2012;485:376–380. doi: 10.1038/nature11082. [DOI] [PMC free article] [PubMed] [Google Scholar]
- 22.Langfelder P, Horvath S. BMC Bioinformatics. 2008;9:559. doi: 10.1186/1471-2105-9-559. [DOI] [PMC free article] [PubMed] [Google Scholar]
- 23.BrainSpan. Atlas of the developing human brain. ( www.brainspan.org)
- 24.Faedo A, Bulfone A, Hevner RF, West JD, Price DJ. Developmental Bio. 2007;302:50–65. doi: 10.1016/j.ydbio.2006.08.035. [DOI] [PMC free article] [PubMed] [Google Scholar]
- 25.Vaccarino FM, Schwartz ML, Raballo R, Nilsen J. Nature Neuro. 1999;2:246–253. doi: 10.1038/6350. [DOI] [PubMed] [Google Scholar]
- 26.Pearlman AL, Sheppard AM. Progress in Brain Research. 1996;108:119–134. [PubMed] [Google Scholar]
Associated Data
This section collects any data citations, data availability statements, or supplementary materials included in this article.


