

Abstract
Under the Hospital Value-Based Purchasing Program of the Centers for Medicare & Medicaid Services patient satisfaction accounts for 30% of the measures of and payments for quality of care. Understanding what drives satisfaction data, how it is obtained, converted into scores, and formulated into rankings, is increasingly critical for imaging departments.
Measuring and interpreting patient satisfaction has been challenging, particularly with respect to objective metrics and standardization. Departments may have used institution-specific questionnaires to derive pointers for continued quality improvement, but lack of standardization of these instruments made benchmarking difficult and subjective. In general, patient satisfaction tended to be regarded as desirable, although not critical to radiology services, with the exception perhaps of highly brand-conscious practices. Implementation of recent government health care policy of basing pay to hospitals for inpatient care on the quality of care instead of just the quantity of service provided, however, has changed the influence factor of patient satisfaction and given it direct impact on the income of healthcare facilities. Because quality of care ratings now determine government payouts, and patient satisfaction surveys now significantly decide assessment of care, patient satisfaction is of critical importance to every practice. With the recent healthcare reform, patients’ satisfaction is at the forefront of topics in medical centers and suddenly new changes in determining comparative quality, payments, and rankings of services have become essential objectives even on a public forum.
Effective October 2012, the Centers for Medicare & Medicaid Services (CMS) began moving the predominantly fee-for-service healthcare reimbursement to a system of pay-for-performance, known as a Hospital Value-Based Purchasing Program [1, 2]. The program is funded by a 1% withhold from participating hospitals’ Medicare inpatient payments. The 1% withhold, an estimated $1 billion, [3] in fiscal year (FY) 2013 will gradually rise to 2% by FY 2017.
Participating hospitals have opportunities to recover their withhold and to compete for additional incentive payments from CMS. Withholdings are redistributed as financial incentives based on performance ranking among participating hospitals. A hospital’s performance score is composed of 70% clinical quality indicators, such as readmission rate, speed and appropriate management of acute myocardial infarction, and antibiotic use; the remaining 30% reflects patient satisfaction metrics, including provider communication, pain management, and overall impression. The profound impact of 1–2% reimbursement cuts on hospitals, whose total and operating margins averaged only 7% and 5.5% in 2011 [4], coupled with the substantial patient satisfaction component within the performance metric, highlights the critical need to optimize patients’ experience.
Within the hospital system, Radiology Departments play a major role in influencing patient satisfaction. Their high through-put, diverse mix of patient populations, disease entities, procedure-related discomfort including claustrophobia, and examination types ranging from routine imaging to emergency exams pose unique challenges. The objectives of this article are to help the reader
explore the potential impact of satisfaction ratings on institutions and individuals,
explain how patient satisfaction is rated and ranked,
identify drivers that affect the ratings and rankings, and
probe the resulting challenges unique to radiology departments.
The underlying principles will be discussed and illustrated with examples from nationally benchmarked data obtained in the MRI Division of the Radiology Department of The Ohio State University Medical Center (OSUMC) before and after team training in patient-supportive communication skills (Comfort Talk®). An IRB-approved clinical trial at the site allowed extensive access to and analyses of patient satisfaction data that otherwise may be difficult to obtain for practicing radiologists and enabled greater understanding of the algorithms and intricacies of these measurements with their considerable impact on hospital finances and branding.
Trial Background Information
The data used as examples were obtained in the OSUMC Campus MRI Center which examines about 1,400 per month, operates three closed MRI scanners: a General Electric 1.5 Tesla Signa HDx (General Electric Healthcare, Waukesha, WI); a Siemens 3 Tesla Verio; and a Siemens 1.5 Espree (Siemens AG, Munich, Germany) and is staffed with 22 technologists. All MRI staff were invited to participate in the training on a voluntary basis with a commitment to attend two weekend sessions of eight hours each. Participants were not paid for their time, but received 16 hours A+ Continued Education Credits approved by the American Society of Radiologic Technologists (ASRT), and optionally could obtain an additional 9 hours A+ ASRT approved credits for successfully completing the self-directed learning activity: studying the training book and correctly answering 80 of 100 post-test questions. Ten of 23 staff members, two male and eight females, were trained. The group consisted of one nurse and nine MRI technologists including one MRI supervisor and one manager. The course was delivered on two Saturdays, five weeks apart.
Training focused on rapport, relaxation, and reframing and used an interactive, participatory approach along the Kolb Learning cycle [5]: It included experiential components, reflective analysis, review of pertinent literature and research data, and the immediate practice of the newly learned skills, which provided a new experience to be reentered into the learning cycle. Day #1 training emphasized establishment of instant rapport, rapid tension diffusion, greater awareness of word choices, avoidance of negatively-valenced suggestions, introduction to hypnoidal language, basic management of anxiety and pain, and use of a self-hypnotic relaxation script, previously validated for distress management in the Radiology department. The main goal of the script was to facilitate familiarization and adoption of appropriate vocabulary. Reading of the script would typically take 90 seconds for a regular patient and up to three minutes for a patient who is claustrophobic, in pain, and/or highly anxious. Day #2 training focused on advanced management of claustrophobia and distress, further elaboration of site-specific use of language based on trainees’ examples, and on overcoming resistance to change. The live training sessions were followed by a total of six days of on-site trainer interaction, accessibility to a web-based post-training support module, and three follow-up site visits in the ensuing 8 months.
To further cement use of suitable site- and situation-specific verbiage that was elaborated in class and evolved during the practice and follow-up, a module on the training support website enabled both trainees and their untrained colleagues to refer to suggested-verbiage “cards,” accessible on hospital-based computers, and personal tablets, cell phones, and computers. The cards were based on the verbiage and preferences the trainees had worked out in class and during clinical practice.
Adoption of behaviors was confirmed with a Group Objective Structured Clinical Evaluation (GOSCE) in which behavior of all group members (trained and untrained) was captured in a semi-quantitative way with an instrument was adopted from a checklist originally developed to assess both individual providers of a patient-comforting method in clinical trials and radiology residents [6, 7].
On-site communication training was announced in November 2011 and conducted in February and early March 2012. To account for possible effects of the announcement alone on personnel behavior, seasonal variability in patient perception, type and acuity of examinations, and monthly variations in return rates of surveys, eight months’ data prior to training were pooled (March to October 2011) and compared with the post-training data derived from the same months in 2012. Data were provided from OSUMC’s central Data Management of the Patient Experience which as capturing patient satisfaction data for the Campus MRI location by Press Ganey Surveys since FY2010. These data, the hospital had chosen to collect for assessment, form the basis for the following Press Ganey specific graphs and examples.
Survey Measures for Patient Satisfaction
CMS uses the Hospital Consumer Assessment of Healthcare Providers and Services (HCAHPS) survey for inpatient experiences. Questions address staff’s expressions of concern for comfort, friendliness, attentiveness to and respect for patients, and acknowledgement of and extent of actions taken to control pain etc.
The current HCAPHS survey, which affects CMS payments, is geared to survey an inpatient’s entire hospital visit experience across multiple disciplines and interaction points. It is likely only a question of time until other payers follow suit, outpatient treatment is included, and institutions begin to adjust departmental and individual pay according to rankings. Several vendors of satisfaction surveys have entered the field offering instruments and benchmarking for special areas in the hospital, such as Radiology and Imaging services, and/or outpatient visits. Their goal is to assist the participating institutions in getting a head start in process improvement. These commercial assessment and questionnaire services typically follow the elements contained in HCAPHS.
Typically, randomly chosen patients are mailed a questionnaire with a postpaid return envelope or are queried by an independent interviewer by telephone with a standard set of questions. Other options are mailings with telephone follow-up (also known as Mixed mode), and Active Interactive Voice Response (IVR). Which approach is the best for an institution depends on the preferred mode of communication of the majority of patients served, their availability and willingness to conduct phone interviews, as well as considerations of distribution cost (e.g. postage vs calling center). Since verbal inquiry may lead to higher ratings, the mode of survey is integrated in the ranking process. Data are then aggregated on a quarterly basis to create a rolling 4-quarter data file for each hospital. The most recent four quarters of data are used in public reporting [8].
Participating hospitals are instructed not to coach their patients or insinuate answers for the surveys. Interviewing patients or giving them surveys in the hospital is not permitted and could lead to fines.
Hospital Consumer Assessment of Healthcare Providers and Services (HCAHPS)
The HCAHPS survey (Table 1) asks patients to answer 22 questions (Q) related to ten topics [2]. Most relevant to the Radiology experience are the following questions on frequencies of specific occurrences that patients rate as “never,” “sometimes,” “usually,” or “always”:
Table 1. HCAHPS Patient Satisfaction Survey Questions.
Unless stated otherwise, answers are in terms of frequencies: Never/Sometimes/Usually/Always
| YOUR CARE FROM NURSES |
| Q1. During this hospital stay how often did nurses treat you with courtesy and respect? |
| Q2. During this hospital stay how often did nurses listen carefully to you? |
| Q3. During this hospital stay how often did nurses explain things in a way you could understand? |
| Q4. During this hospital stay, after you pressed the call button, how often did you get help as soon as you wanted it? |
| YOUR CARE FROM DOCTORS |
| Q5. During this hospital stay how often did doctors treat you with courtesy and respect? |
| Q6. During this hospital stay how often did doctors listen carefully to you? |
| Q7. During this hospital stay how often did doctors explain things in a way you could understand? |
| THE HOSPITAL ENVIRONMENT |
| Q8. During this hospital stay, how often were your room and bathroom kept clean? |
| Q9. During this hospital stay, how often was the area around your room quiet at night? |
| YOUR EXPERIENCES IN THIS HOSPITAL |
| Q10. During this hospital stay, did you need help from nurses or other hospital staff in getting to the bathroom or in using a bedpan? (yes/no; if no go to question 12) |
| Q11. How often did you get help in getting to the bathroom or in using the bedpan as soon as you wanted? |
| Q12. During this hospital stay, did you need medicine for pain? (yes/no; if no go to question 15) |
| Q13. During this hospital stay, how often was your pain well controlled? |
| Q14. During this hospital stay, how often did the hospital staff do everything they could to help you with your pain?” |
| Q15. During this hospital stay, were you given any medicine that you had not taken before? (yes/no; if no go to question 15) |
| Q16. Before giving you any new medicine, how often did hospital staff tell you what the medicine was for? |
| Q17. Before giving you any new medicine, how often did hospital staff describe possible side effects in a way that you could understand? |
| WHEN YOU LEFT THE HOSPITAL |
| Q18. After you left the hospital, did you go directly to your own home, to someone els’s home, or to another health facility? |
| Q19. During this hospital stay, did doctors, nurses, or other hospital staff talk with you about whether you would have the help you needed when you left the hospital? |
| Q20. During this hospital stay, did you get information in writing about what symptoms or health problems to look out after you left the hospital? |
| OVERALL RATING OF HOSPITAL |
| Q21. Using any number from 0 to 10, where 0 is the worst hospital possible and 10 is the best hospital possible, what number would you rate this hospital during your stay? |
| Q22. Would you recommend this hospital to your friends and family (Definitely no/Probably no/Probably yes/Definitely yes) |
“During this hospital stay…
how often did nurses treat you with courtesy and respect? (Q1)
how often did nurses listen carefully to you? (Q2)
how often did nurses explain things in a way you could understand? (Q3)”
Q 5–Q7 are identical to Q1–Q3 with the exception that “nurses” is replaced by “doctors.” Of note is that behavior of technologists or other medical technical staff is not addressed in the current version of the questionnaire.
Q 13 and Q14 query how often was pain was well controlled and how often the hospital staff did everything they could to help you with the patient’s pain.
The remaining questions pertain to the inpatient experience such as Q4 addressing how often patients got help when they wanted it after they pressed the call button (Q4). The Hospital Environment is evaluated by Q8 addressing cleanliness of the room and bathroom and Q9 assessing room quietness during the night. Q10-Q17 enlist feedback on the Hospital Experience of being helped appropriately and having been given adequate explanations. Q18-Q20 seek information about the experience after having left the hospital. Two overall assessments conclude the experience component of the survey: Q21, which asks patients to rate the hospital on a scale of 0–10 with 0=Worst hospital possible and 10=Best Hospital Possible and Q22 questions whether patients would recommend the hospital to friends and family. Personal questions then seek additional information on patients’ gender and ethnicity, health and educational status, as well as language preferences.
CMS publishes a “top box” scoring system which reports the percentage of patients who respond in terms of “Always” or the highest possible ranking category. The comparison to the regional and national average can be viewed publically under www.hospitalcompare.hhs.gov and serves as guide for patients. As one quickly notices when looking at the satisfaction data on this site, is the majority of places are separated by regional or national averages by only few percentage points.
Payments are determined based on an “attainment” or “improvement” score as well as “consistency.” The attainment score is calculated as the hospitals’ performance in the scoring year compared to the national benchmark (mean performance score for the top 10% performers) and national threshold (50th percentile for all) for each measure. If current performance is between the threshold and benchmark, one to 9 points can be gained; performance above the benchmarks earns 10 points, below the 50% percentile gets zero points. For improvement, scores have to be 0 – 9 points higher than the year before on a scale using as endpoints the prior year’s result and the national benchmark. Consistency earns between 0 and 20 points which are awarded based on how many of a hospital’s scores exceed threshold.
Press Ganey Survey
Press Ganey Associates Inc., is the survey provider with the broadest market penetration, and its approach can be used as representative of what to expect. Press Ganey offers, through use of its scoring reports, to enable organizations to drive HCAPHS improvements at all levels of the organization through correlations between their scores and top box scores, understand subgroup performance relative of peers, and use correlations to estimate the strength between each question of their survey and the Rate The Hospital Score by HCAHPS which is one of the most critical. This approach not only allows administrators to assess impact of professional areas such as Radiology or Surgery on overall ratings, but also of professional subgroups such as attending physicians, residents, fellows, nurses, technologists), and even individuals associated with a given patient visit and rating.
Press Ganey modeled an outpatient survey based on the HCAHPS key questions for use in Radiology Departments and their imaging divisions. It consists of a 2-page Outpatient Services Survey that can be printed on hospital letterhead and is sent out with a postpaid return envelope to randomly selected patients.
The survey questions in Table 2 are based on the 2004 template of Press Ganey Associates Inc. (South Bend, IN), in which patients rate their experience as 1 (very poor), 2 (poor), 3 (fair), 4 (good), and 5 (very good) by filling in circles below these descriptot/number combinations. Twentyone questions address the following domains: Registration (4), Facility (3), Test or Treatment (7), Personal Issues (4), and Overall Assessment (3). Patients can also include comments.
Table 2. Survey Questions and Training Outcomes.
In the Press Ganey Outpatient Survey patients rate their answers in response to the questions in the blank cells in the right column between 1 (very poor) and 5 (very good). Once their ratings are translated into scores between 0 and 100, the scores are, without further patient input, electronically averaged as summary or roll-up score for the domain. Raw scores, percentile ranks, and number or responses (# Resp) are given for the period before and after training.
| March – October 2011 | March – October 2012 | ||||||
|---|---|---|---|---|---|---|---|
| Domain | Question Text | Mean Score | Percentile | # Resp | Mean Score | Percentile | # Resp |
| Overall Assessment | Likelihood of recommending | 87.5 | 1 | 42 | 93.5 | 38 | 62 |
| Overall rating of care | 90.5 | 4 | 42 | 93.1 | 25 | 62 | |
| Staff worked together to provide care | 90.5 | 7 | 42 | 95.6 | 87 | 62 | |
| OVERALL ASSESSMENT ROLL-UP | 89.5 | 3 | 42 | 94.1 | 53 | 62 | |
| Test or Treatment | Explanations given by staff | 91.7 | 18 | 42 | 96.8 | 98 | 62 |
| Friendliness of staff | 91.7 | 1 | 42 | 96.8 | 84 | 62 | |
| Instructions in preparation for test or treatment | 89.3 | 8 | 35 | 91.9 | 44 | 59 | |
| Skill of technologists, therapists, nurses | 91.5 | 4 | 41 | 93.6 | 20 | 59 | |
| Staff concern for comfort | 89.3 | 1 | 42 | 96 | 92 | 62 | |
| Staff’s concern fro questions/worries | 89.6 | 5 | 41 | 92.3 | 27 | 62 | |
| Waiting time in test & treatment area | 72.0 | 1 | 41 | 78.6 | 1 | 62 | |
| TEST OR TREATMENT ROLL-UP | 87.9 | 1 | 42 | 92.3 | 16 | 62 | |
Conversions of Ratings into Rankings
The following examples are based on Press Ganey surveys we had the opportunity to explore during a clinical trial at OSUMC assessing effects of communication training on patient satisfaction in the MRI division of the campus radiology department. At the time of the study the same survey was used by 907 other institutions that served as basis for the benchmarking.
The conversion principle is as follows: Responses for each survey question on the 1=very poor to 5=very good scale are translated into raw scores between 0 and 100 per questions. With further patient input a summary score, or roll-up, is mathematically averaged for each domain; e.g. the roll-up for Test and Treatment averages the raw scores of the 7 questions contained under its subheading (see 2). Raw scores are then translated into national percentile ranks. High percentile ranks indicate high patient satisfaction ratings. For example, a 90th-percentile ranking indicates that, in terms of patient satisfaction, an institution performs better than 90% of the sample (in this case 908 enrolled institutions.) In analogy, a 90th percentile in terms of CMS rankings defines the low end of top 10% of performers which form the pool from which the national CMS benchmark is determined.
Each question and roll-up has a different conversion function from Raw Scores into Percentile Rankings (Fig. 1). Common to all, however, is a hockey-stick type curve with a very steep function for the higher Rankings. Fig. 1 demonstrates how very small changes in Raw Scores can lead to considerable changes in Rankings. Considering that CMS uses the top 10% of performers as national benchmark, doesn’t award points below the 50th percentile of its own ranking scheme, and that all enrolled hospitals have a vested interest in doing well, a similarly steep hockey stick shaped curve can also be expected for CMS data with use of top box assessments.
Figure 1.

Conversion of Raw Scores into Percentile Rankings.
Note how small changes in Raw Scores are associated with major changes in Percentile Rankings at the steep end of the hockey stick.
When monitoring quality improvement, reliance on satisfaction Raw Scores can be deceiving as well as challenging. An averaged Raw Score of 92.2 may look impressive: it requires that the overwhelming majority of patients gave the best possible rating of “very good” (i.e. raw score of 100). Benchmarked against 908 hospitals, however, a Raw Score of 92.2 translated only into the 2nd percentile for “Friendliness of Staff”, the 24th percentile for “Explanations by Staff”, and the 14th percentile for the Test and Treatment Roll-up. Interpreting such satisfaction outcome metrics to caregivers will be critical to maintain a positive work environment. One may speculate that expressing to personnel that a Raw Score of 92.2 out of a possible maximum 100 needs serious improvement can be demoralizing. On the other hand, the same Raw Score of 92.2 translated into the 77th percentile for the “Waiting Time in the Treatment Area” illustrating the wide spread of the individual functions which can have major effects on roll-ups as shown later in the manuscript.
Conversions from Raw Scores into Percentile Ranking depend on performance of all competitors at any given time. Considering that most institutions will strive to improve their rankings, one can expect the hockey stick part of the curve to become even steeper. How much grade inflation will come into play is another question. There is a possibility that the public, made sufficiently aware of the impact of ratings on the financial viability of their hospital, may adapt their assessments, particularly in underserved areas with few options of care and already strained institutional finances, just to assure continued viability and availability of their institution.
Effects of Waiting Times and Conversion Algorithms
Summary scores—roll-ups—ultimately determine CMS payments. The potential overwhelming impact of single questions or domains on overall rankings depending on the conversion algorithm can be illustrated with the example of Waiting Time for Test and Treatments. When examining the effect of communication training on percentile Rankings in Fig. 2, one can appreciate the considerable increase in Rankings in 6 of the queried areas with the exception of Waiting Time, which, of course, did not change through communication training. Because Press Ganey averages the Raw Scores and not the Percentile Ranks of the subdomains and then translate those average Raw Scores into Percentiles instead of averaging Percentiles of the subdomains, the overall “Test and Treatment” percentile came out to increase from the 1st to the 16th percentile from the pre- to post-training period. In contrast, an average of the seven individual percentiles of the subdomains as basis for a percentile-based roll-up would have revealed a change from the 5th to 48th percentile. These relatively low pre- and post-scores were entirely driven by the overwhelming impact of the effect of Waiting Time, which places institutions with emergency rooms and inpatients needing emergency exams at a disadvantage from the onset. As Fig. 1 clearly shows, this single parameter, that has the least steep hockey stick, quickly dilutes the excellent Rankings of all the other even steeper hockey stick questions by shoving them downward along the curve driven by institutions with shorter waiting times.
Figure 2.
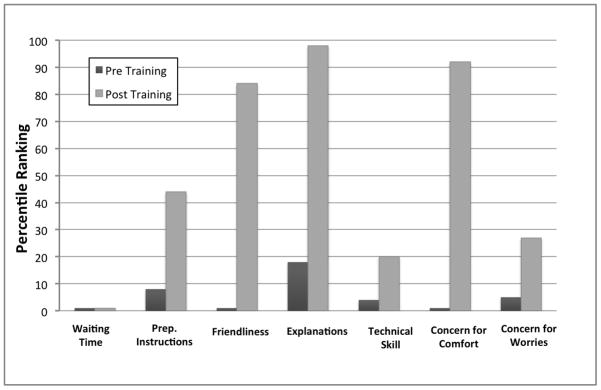
Effect of Communication Training on Rankings.
Depiction of changes in patient satisfaction rankings for the Test and Treatment domain from 8 months prior to the training initiation to 8 months post training, based on benchmarking among 908 institutions.
Drivers of Satisfaction Scores
The relatively low percentile Rankings for high Raw Scores implies that very small changes in raw scores can have a profound overall impact on ranking on the steep end of this hockey-stick-shaped curve. This effect can be further magnified through the algorithm used for calculating the scores (e.g. averaging before or after percentile conversion), as exemplified with the effect of the “Waiting Time.” This can also mean that scores may be markedly lowered by a very few disgruntled patients (or even just one), who enter low ratings, and/or patients, who were satisfied but not sufficiently so to bother sending in their favorable review. When comparing the fraction of patients who returned their questionnaire from the 8 months prior to communication training to the 8-month period after training, return rates increased on average by 47%. One thus may speculate that extra effort in communication will pay off by greater willingness of patients to provide positive feedback.
Table 2 shows the varying effect of communication training on improvement of Rankings. Even though the survey was specifically designated to encompass the patients’ outpatient experience in MRI, some data contamination due to contact points outside the department occurred. This may complicate matters when the main focus is on quality improvement in a single area, and careful study of patient comments becomes necessary for full understanding. The analysis of “how well staff worked together to provide care” seemed to be the most related to the MRI experience based on the patients’ comments on the survey form, which often complemented individual team members for extra efforts or referred specifically to MRI-based events. Having helped the staff to better manage tension (incl. among themselves) and develop their own language and behaviors during the communication training may also have contributed to perception of greater team collaboration. The “overall ratings of care received” however, seems to have been misunderstood at least by the several patients who left statements commenting about their brain surgery or treating physician, with some spill-over into the “likelihood of recommending the facility to others.” It may be helpful to avoid this pitfall by making sure clear instructions are provided to patients about filling out their surveys. It will be particularly important to indicate that assessment affects only the care received in the subunit queried and for the visit specified in the accompanying explanations on how to fill out the survey.
The same may apply to elements that are “not applicable” with the option to indicate such on the survey by checking a respective box (which was not available on the surveys). For example, if a patient didn’t have a complaint or express concerns, it is unclear how he or she might have dealt the question of the Press Ganey survey addressing the response to complaints/concerns. Also, since the team members at OSUMC were instructed to not elicit negative suggestions such as worries in the patients and instead to create positive expectations, one can only speculate how a patient who voiced neither worries nor questions would have answered in the absence of a “non-applicable” option. The recommendation would be to lobby for inclusion of such categories in the surveys used.
Along with improved perception of communication-related skills of the staff (see Fig. 2), patients rated “technologists’ skill” higher despite no change in the equipment, imaging protocols or personnel. This suggests a small positive halo effect from the communication domain on the perception of technical quality. Conversely one may speculate that the opposite may also be true e.g. patients who did not receive excellent communication may perceive the technical performance also as less stellar than provided.
Implications
Information on viable strategies to improve patient satisfaction and outcome validation has been limited. Formal communication and interpersonal skill training for physician trainees,— by extension for physicians—has been largely driven through directives from the Accreditation Council for Graduate Medical Education (ACGME) [9]. The emphasis on patient satisfaction, however, makes the need for training much more comprehensive to include the personnel at the front lines of the medical encounter. For nursing, hourly rounding visits for inpatients, and scripting have been implemented with mixed success [10–12]. Effectiveness of these measures largely depends on how well it can be integrated in the site-specific workflow and philosophies, and on whether a meaningful, authentic exchange can ensue between caregiver and patient [13, 14]. An imaging department presents an excellent test environment to study interventions to enhance patient satisfaction: The imaging environment is highly complex, and workflow and time schedule constraints are extensive. There is a wide spectrum of patients referred from multiple clinical specialties at various acuities, ranging from routine outpatient examinations to emergency imaging studies for critically ill patients. Furthermore, to achieve high patient satisfaction, costly interventions, such as increases in infrastructure and/or personnel, will become less affordable in the current resource-strained healthcare environment.
The ability to communicate compassion has been found to be a fundamental component for a positive patient care experience and the strongest predictor of patient willingness to recommend and return to an institution [15, 16]. Compassion, however, can be challenging to define and perform on command; even a feeling of strong empathy by the provider does not necessarily translate into an appropriate expression of caring or improve outcome [17, 18]. Reliance on evidence-based training practices and identifiable, teachable personnel behaviors with documented patient outcomes thus become imperative. Sole statements that staff enjoyed learning new skills or feels more comfortable in dealing with stressful situations without documented assessments by patients will no longer suffice in a climate where reputation and payment to institutions are at stake.
Creating and maintaining an environment where personnel can behave “naturally” while applying newly learned communication skills in a satisfying and personalized manner to each patient becomes critically important. To achieve this, behavioral changes must be adopted internally by the caregivers in order to avoid a feeling of “theater” or pure “scripting”, which may not mesh well with their natural style and concept of care. Otherwise stressful encounters can result in having just that one or two disgruntled patients return “poor” (or even just “fair”) evaluations, which, depending on the total number of returns, might derail an entire month’s or quarter’s ratings.
Conclusion
Research results conclude that training providers to make simple modifications in their language and behavior during patient care can significantly impact the patients’ satisfaction, which, in turn, can impact both quality of care ratings and the bottom line of the hospitals. It is simple and cost-effective way to potentiate the clinical translation of compassion into improvement of patient’s satisfaction and financial reward, a national trend that no one in the game can afford to ignore.
Acknowledgments
Funding Information: NIH/NCCAM 1R43 AT006296 (PI E. Lang)
We greatly appreciate the expert help and support by Carley Hartings, MPH during the conduct of the clinical trial.
The project described was supported by Award Number R43AT006296 from the National Institute of Health/National Center For Complementary & Alternative Medicine. The content is solely the responsibility of the authors and does not necessarily represent the official views of the National Center For Complementary & Alternative Medicine or the National Institutes of Health. The funding was in form of Small Business Innovation in Research Grant awarded to principal investigator E. Lang, owner of Hypnlagesics, LLC and to OSUMC as institutional subcontractor. All study data and information control excluded E. Lang, and was controlled solely by the authors at OSUMC.
Footnotes
Clinical Trial Registration: NCT01563198
Contributor Information
Elvira V. Lang, Email: Amna.Ajam@osumc.edu.
William T.C. Yuh, Email: William.Yuh@osumc.edu.
Ronda Kelly, Email: Ronda.Kelly@osumc.edu.
Luke Macadam, Email: Luke.Macadam@osumc.edu.
Richard Potts, Email: Richard.Potts@osumc.edu.
Nina A. Mayr, Email: Nina.Mayr@osumc.edu.
References
- 1.Centers for Medicare and Medicaid Services. Roadmap for implementing value driven healthcare in the traditional Medicare Fee-for-Service Program. 2009 [cited December 5, 2012]. [1–28]. Available from: http://www.cms.hhs.gov/QualityInitiativesGenInfo/downloads/VBPRoadmap_OEA_1-16_508.pdf.
- 2.Centers for Medicare and Medicaid Services. Hospital Value-Based Purchasing Program (VBP) Washington, DC: Medicare Learning Network; 2011. [updated November 2012January 20, 2013]. ICN 907664:[1–4]. Available from: http://www.cms.gov/Hospital-Value-Based-Purchasing. [Google Scholar]
- 3.Rau J. [7 January 2013];Medicare lists hospital quality bonuses: Kaiser Health News. 2012 Dec 22; Available from: http://www.medpagetoday.com/PublicHealthPolicy/Medicare/36590.
- 4.American Hospital Association. Trends in hospital financing. 2012 Available from: http://www.aha.org/research/reports/tw/chartbook/ch4.shtml.
- 5.Kolb DA. Experiential learning: Experience as the source of learning and development. Upper Saddle River, NJ: Prentice Hall; 1983. pp. 1–242. [Google Scholar]
- 6.Lang EV, Benotsch EG, Fick LJ, Lutgendorf S, Berbaum ML, Berbaum KS, et al. Adjunctive non-pharmacologic analgesia for invasive medical procedures: a randomized trial. Lancet. 2000;355:1486–90. doi: 10.1016/S0140-6736(00)02162-0. [DOI] [PubMed] [Google Scholar]
- 7.Lang EV, Sood A, Anderson B, Kettenmann E, Armstrong E. Interpersonal and communication skills training for radiology residents using a Rotating Peer Supervision Model (Microteaching) Acad Radiol. 2005;12:901–8. doi: 10.1016/j.acra.2005.03.064. [DOI] [PubMed] [Google Scholar]
- 8.Centers for Medicare and Medicaid Services. The HCAHPS survey - Frequentyl asked questions. 2013 Apr 30; Available from: http://www.cms.gov/Medicare/Quality-Initiatives-Patient-Assessment-Instruments/HospitalQualityInits/downloads/HospitalHCAHPSFactSheet201007.pdf.
- 9.Accreditation Council for Graduate Medical Education. Outcome Project. Chicago, IL: ACGME; 2001. [DOI] [PubMed] [Google Scholar]
- 10.Gardner G, Woollett K, Daly N, Richardson B. Measuring the effect of patient comfort rounds on practice environment and patient satisfaction: a pilot study. J Nurs Pract. 2009;15:287–93. doi: 10.1111/j.1440-172X.2009.01753.x. [DOI] [PubMed] [Google Scholar]
- 11.Krepper R, Vallejo B, Smith C, Lindy C, Fullmer C, Messimer S, et al. Evaluation of a Standardized Hourly Rounding Process (SHaRP) J Healthc Qual. 2012 doi: 10.1111/j.1945-1474.2012.00222.x. epub 2012/12/15. [DOI] [PubMed] [Google Scholar]
- 12.Meade CM, Bursell AL, Ketelsen L. Effects of nursing rounds: on patients’ call light use, satisfaction, and safety. Am J Nurs. 2006;106:58–70. doi: 10.1097/00000446-200609000-00029. quiz -1. [DOI] [PubMed] [Google Scholar]
- 13.Rondinelli J, Ecker M, Crawford C, Seelinger C, Omery A. Hourly rounding implementation: a multisite description of structures, processes, and outcomes. J Nurs Admin. 2012;42:326–32. doi: 10.1097/NNA.0b013e31824ccd43. [DOI] [PubMed] [Google Scholar]
- 14.Tea C, Ellison M, Feghali F. Proactive patient rounding to increase customer service and satisfaction on an orthopaedic unit. Ortho Nurs. 2008;27:233–40. doi: 10.1097/01.NOR.0000330305.45361.45. quiz 41–2. [DOI] [PubMed] [Google Scholar]
- 15.Burroughs TE, Davies AR, Cira JC, Dunagan WC. Understanding patient willingness to recommend and return: a strategy for prioritizing improvement opportunities. Jt Comm J Qual Improv. 1999;25:271–87. doi: 10.1016/s1070-3241(16)30444-8. [DOI] [PubMed] [Google Scholar]
- 16.Otani K, Waterman B, Faulkner KM, Boslaugh S, Dunagan WC. How patient reactions to hospital care attributes affect the evaluation of overall quality of care, willingness to recommend, and willingness to return. J Healthc Manag. 2010;55:25–37. discussion 8. [PubMed] [Google Scholar]
- 17.Coulehan JL, Platt FW, Egener B, Frankel R, Lin CT, Lown B, et al. “Let me see if I have this right..”: words that help build empathy. Ann Intern Med. 2001;135:221–7. doi: 10.7326/0003-4819-135-3-200108070-00022. [DOI] [PubMed] [Google Scholar]
- 18.Lang EV, Berbaum KS, Pauker SG, Faintuch S, Salazar GM, Lutgendorf S, et al. Beneficial effects of hypnosis and adverse effects of empathic attention during percutaneous tumor treatment: When being nice does not suffice. J Vasc Interv Radiol. 2008;19:897–905. doi: 10.1016/j.jvir.2008.01.027. [DOI] [PMC free article] [PubMed] [Google Scholar]