

Abstract
Mouse models are used commonly to study viral infection and define viral and host determinants of infection and disease morbidity. Conventional studies of viral infection in mice rely upon euthanizing cohorts of animals at multiple time points to identify sites of infection, quantify viral titers, and determine host immune responses. This experimental paradigm precludes longitudinal studies of infection and response to treatment in the same animal and assumes that progression of infection and pharmacodynamics of therapeutic agents are identical in all mice. To enable repetitive, quantitative studies of viral infection in mouse models, we and others are using non-invasive bioluminescence imaging to track viral infection, dissemination, and effects of host immune mediators on disease. In this chapter, we detail experimental protocols for bioluminescence imaging of viral infections in living mice.
Keywords: luciferase, optical imaging, vaccinia, herpes simplex virus, mouse model
1. Introduction
Studies of viral-host interactions in mouse or other small animal models of disease conventionally rely upon euthanizing groups of animals at multiple time points to localize sites of infection, establish systemic dissemination, and quantify viral titers in these sites. This approach precludes longitudinal studies of viral replication and disease progression in the same mouse and instead assumes that infection proceeds identically in all animals. As a result, animal-to-animal variations in extent of viral replication locally and systemically will be missed. These differences may reveal new aspects of pathogenesis, including new routes and kinetics of dissemination, and control for technical variables in an experiment, such as inoculation of virus in an unintended anatomic site. Viral spread to unexpected anatomic sites will be missed if only a standard subset of organs are assayed, thereby limiting knowledge about the full extent of disease. In addition, conventional studies of viral pathogenesis are expensive and time-consuming because of the need to have sufficient animals at each time point to generate statistically significant data. These limitations of conventional experimental approaches to study viral infection highlight the need for new, alternative strategies to investigate pathogenesis in vivo.
To overcome limitations of conventional techniques, we and others have developed bioluminescence imaging as powerful new method to study viral infection in small animal models. In this chapter, we describe protocols to image and quantify viral infection in living mice.
2. Materials
2.1. Luciferase enzymes and substrates
Firefly (Photinus pyralis), Renilla (Renilla reniformis), and/or Gaussia (Gaussia princeps) luciferases with codons optimized for expression in mammalian cells (Promega, New England Biolabs).
D-Luciferin substrate for firefly luciferase (Promega) prepared as 15 mg/ml stock in phosphate buffered saline (PBS) and then sterile filtered through a 0.22 μm filter. Store aliquots of D-luciferin at −20°C.
Native coelenterazine substrate (Fluka) for Renilla and Gaussia luciferases prepared as a 1 mg/ml stock in methanol. Store aliquots of D-luciferin at −20°C.
2.2. Recombinant viruses
Viruses and viral nucleic acid templates for regulating expression of a luciferase enzyme from a promoter of interest and inserting this reporter cassette into the viral genome. Specific reagents necessary for preparing recombinant reporter viruses differ for various pathogens and are beyond the scope of this protocol.
2.3. Bioluminescence imaging equipment
CCD camera with light-tight imaging box, on-line isoflurane anesthesia, and computer software for data acquisition and analysis (IVIS systems, Caliper).
30g, 300 μl syringes for injecting luciferin or coelenterazine into mice (Precision Sure-Dose insulin syringe).
Electric clippers to remove fur from mice (Pocket Pro 9961-602, Wahl).
3. Methods
Preparation and validation of recombinant viruses expressing firefly luciferase are key components of the protocol. To establish reporter viruses for bioluminescence imaging, it is necessary to integrate a luciferase enzyme into the viral genome under control of a defined promoter. Stronger promoters that drive higher levels of expression of luciferase are preferable to increase sensitivity for detecting viruses in vivo. The relatively large genome of DNA viruses typically can accommodate insertion of a luciferase enzyme without affecting expression of neighboring genes or significantly attenuating the resultant virus (1, 2). It is more challenging to insert optical imaging reporters into the smaller genomes of RNA viruses. Recombinant Sindbis viruses expressing firefly luciferase have been used successfully for bioluminescence imaging in mice, although reporter viruses were attenuated significantly in vivo as measured by lethality in two different strains of mice (3). Pierson et al used a DNA-based transfection approach to generate West Nile viruses expressing a green fluorescent protein (GFP) reporter (4). These viruses had reduced growth in cultured cells and frequently lost expression of the reporter, emphasizing the challenges in developing recombinant RNA viruses for imaging.
3.1. Considerations for luciferase reporter enzyme
Luciferase enzymes. Several different luciferase enzymes, including firefly (Photinus pyralis), Renilla, and Gaussia, have been used for imaging studies in small animals (Table 1). Firefly luciferase has several advantages for imaging relative to Renilla and Gaussia. First, bioluminescence from firefly luciferase has an emission peak of 612 nm at 37°C (5), which is in the red and far red part of the visible spectrum. By comparison, native forms of Renilla and Gaussia luciferases emit blue light with peak emission at 480 nm (6, 7), and light from the most red-shifted mutant of Renilla luciferase peaks at 535 nm (8). Longer wavelengths of visible light (red and far red) transmit preferentially through tissues, so bioluminescence from Renilla and Gaussia luciferases is attenuated to a substantially greater extent than firefly luciferase.
Substrates. D-luciferin, the substrate for firefly luciferase, has favorable pharmacologic properties for in vivo imaging. After intraperitoneal injection, D-luciferin distributes widely throughout the animal and penetrates blood-tissue barriers such as the brain and placenta. As a result, it is possible to image firefly luciferase reporters in the brain and in fetal tissues (9, 10). Coelenterazine, the substrate for Renilla and Gaussia luciferases, must be injected intravenously, which is a potential limitation for repetitive imaging studies. Coelenterazine has higher background signals because of oxidation in serum (11), and this substrate is excluded from some tissues by drug transport proteins (12). Firefly luciferase produces sustained, relatively constant bioluminescence peaking approximately 10 minutes after intraperitoneal injection of D-luciferin (13). The steady level of bioluminescence facilitates longer periods of image acquisition and reduces experimental errors from timing of imaging studies (see below). Renilla and Gaussia luciferases have flash kinetics, resulting in a rapid burst of bioluminescence that decays rapidly (6, 7),. Therefore, even small differences in the amount of time between injecting substrate and imaging among animals can produce relatively large experimental errors. Collectively, these properties of enzyme and substrate have made firefly luciferase the enzyme used most commonly for imaging studies of viral infection and other biologic processes.
Table 1.
Luciferase enzymes
| Luciferase | Peak emission at 37°C (nm) |
Substrate | Size (amino acids) |
|---|---|---|---|
| Firefly (Photinus Pyralis) | 612 | D-luciferin | 550 |
| Renilla reniformis | 480 | Coelenterazine | 310 |
| Mutant Renilla reniformis
(RLuc8.6-535) |
535 | Coelenterazine | 310 |
| Gaussia princeps | 480 | Coelenterazine | 185 |
3.2. Validation of viral replication and bioluminescence in cell culture
Replication in cell culture. As a first step toward determining to what extent the luciferase reporter attenuates viral replication, perform growth experiments with wild-type and reporter viruses in a cell line known to be susceptible to the pathogen of interest. Experiments may be performed with low (≈ 0.01) or high (≈ 5 – 10) multiplicities of infection (MOI) to assess multi- and single-step viral growth. Replication and wild-type and reporter viruses may be quantified by standard methods for the pathogen of interest, such as an assay to determine plaque forming units.
Correlation of bioluminescence with viral titers. To establish that increases in bioluminescence correlate with greater amounts of reporter virus, quantify changes in luciferase activity and viral titers over time. Plate susceptible cells in a format appropriate for standard viral replication assays, such as 6-well plates, and infect with low or high MOI for each reporter virus to be tested. At defined time points (such as 4, 8, 12, 24, and 48 hours post-infection), measure luciferase activity in intact cells (see below) and then harvest cells for viral plaque assays or other appropriate measures of viral titers. Include a mock-infected well as a control for background bioluminescence, which is particularly important for Renilla and Gaussia luciferases.
Bioluminescence imaging in intact cells. For viruses expressing firefly luciferase, add D-luciferin directly to culture medium at a final concentration of 150 μg/ml and rock plate to disperse the substrate. Incubate cells with D-luciferin for 5 minutes at 37°C in a CO2 incubator before imaging. For Renilla and Gaussia luciferases, it is preferable to remove medium with serum from cells before adding coelenterazine because this substrate oxidizes in serum, increasing background bioluminescence. Add coelenterazine to a final concentration of 1 μg/ml and then image the plate immediately. Place the plate on the stage of the bioluminescence imaging instrument and set the field-of-view to position B for a single tissue culture plate. Acquire a bioluminescence image with no emission filter. Image acquisition times and resolution are semi-empiric with lower resolution and longer imaging times needed for lower levels of bioluminescence. As a starting point, we suggest a 1 minute acquisition on medium resolution. For low levels of bioluminescence, longer imaging times and high sensitivity settings are needed. If the initial image exceeds the counting capacity of the detector (saturated image), a shorter exposure and/or high resolution settings are required for accurate data.
Quantification of bioluminescence imaging data for cultured cells. Data are quantified by region of interest analysis using software with the imaging instrument. For cell culture plates, standard grids are available with matrices consistent with multi-well tissue culture plates, such as 3 × 2 grids for a 6-well plate. Position the region of interest over the appropriate wells and quantify bioluminescence as photons, which corrects for differences in imaging times and resolution. Subtract photons present in mock-infected wells to determine amounts of bioluminescence from reporter virus at various time points. For viruses that express luciferase constitutively, amounts of bioluminescence are expected to increase with increasing titers of virus.
3.3. Bioluminescence imaging in living mice
Infect mice with desired amounts of reporter virus at anatomic sites or routes appropriate for the pathogen of interest. For initial validation experiments, we suggest infecting a parallel set of mice with wild-type virus. This approach allows direct comparisons of disease progression, as determined by parameters such as weight loss, temperature, and/or mortality, in mice infected with wild-type and luciferase reporter viruses (Note 1).
For strains of mice with dark fur (SV129, C57Bl/6), we shave animals with electric clippers at the start of an imaging experiment. We anesthetize mice with 2% isoflurane gas delivered via nose cone for shaving. Dark fur attenuates and scatters light, substantially reducing sensitivity for detecting bioluminescence from reporter viruses (Note 2).
We typically image mice daily over the course of infection, beginning on the first day after viral inoculation. Within this time period, bioluminescence has decreased to background levels for all luciferase enzymes. It is possible to image more frequently, although ≈ 6 hours are required for bioluminescence from firefly luciferase to return to background. Persistent bioluminescence indicates that substrate (D-luciferin or coelenterazine) still is present in the animal. Amounts of injected substrate do not saturate luciferase enzymes in vivo, so bioluminescence per luciferase molecule increases with higher amounts of substrate (13) and reduces reproducibility of quantitative imaging data obtained by injecting a standard amount of substrate per mouse.
Imaging procedure for firefly luciferase. Inject mice intraperitoneally (IP) with 150 mg/kg of D-luciferin stock solution in PBS using a 30g needle (Note 3). Using a standard amount of D-luciferin per animal is essential for generating reproducible imaging data. Five minutes after injection, anesthetize mice with 2% isoflurane gas. Place mice in instrument to begin imaging 10 minutes after injection (Note 4).
Imaging procedure for Renilla and Gaussia luciferases. Dilute coelenterazine stock to 4 mg/kg in PBS and inject intravenously via tail vein (Note 5). Anesthetize mice with isoflurane immediately after injection and begin imaging at the earliest reproducible time point, typically 3 minutes after injection.
Mouse positioning. We typically image groups of 3 mice at a time using FOV C on the IVIS system. More or fewer mice may be imaged at a time using larger or smaller fields of view, respectively. Position mice under the CCD camera port in the bioluminescence imaging instrument. We place animals on a piece of disposable black construction paper to reduce the potential for contaminating the equipment with viruses. It is important to determine that the paper (or other padding materials) does not produce detectable light, which will confound imaging experiments. Mice are positioned with the probable anatomic sites of infection positioned closer to the CCD camera. For example, to focus on viral infection in the brain, mice are placed prone on the imaging platform to orient this organ closer to the camera. Depending on the route of infection and sites of viral spread, it may be necessary to acquire images from multiple projections. Multiple imaging projections can improve the ability to assign sites of bioluminescence to specific organs and tissues, based on distribution of light and relative brightness when an organ is positioned closer or farther from the camera.
Image acquisition. Parameters of image acquisition are the final variables for bioluminescence imaging studies. Imaging times may range from 1 second to 10 minutes or more, depending on the amount of bioluminescence produced. In general, we use the longest image acquisition time possible without saturating the detection limits of the CCD camera because these data give the best counting statistics for data analysis. The imaging field of view (FOV) affects the resolution of the image and overall sensitivity for detecting bioluminescence. Smaller FOV settings improve resolution and sensitivity with the trade off of imaging fewer animals at once. A smaller FOV also may place animals near the edge of the camera field, which may decrease detection of light. We use a 13 cm FOV (FOV C on an IVIS instrument) for most animal imaging experiments because this allows 3 mice to be centered under the camera and imaged at the same time. This same FOV is maintained throughout an experiment. BLI instruments also allow investigators to select image resolution based on the matrix for picture elements (pixels) in a given FOV. For example, a 256 × 256 matrix increases sensitivity for detecting bioluminescence while diminishing spatial resolution because individual pixels are larger. The opposite is true for a 1024 × 1024 matrix. This parameter must be optimized based on the relative amounts of bioluminescence produced in various sites of infection versus the desired spatial resolution (Note 6).
Data quantification. As described for cell culture studies, bioluminescence imaging data are quantified using region of interest (ROI) analysis software programs provided with these instruments (Fig 1). Such programs allow investigators to manually define ROI for defined anatomic sites in each animal and quantify bioluminescence output. For example, we define standard ROIs for head, chest, and abdomen regions in our vaccinia model of infection. These ROIs correspond with sites of intranasal inoculation, viral replication in the lung, and systemic dissemination to abdominal organs including liver. We also define a specific ROI for bioluminescence in the spleen on images obtained with the left side of the animal facing the CCD camera to measure trafficking on infected immune cells to this organ. Bioluminescence imaging data are quantified as numbers of photons emitted per unit time from a defined area (photon flux). This quantification scheme corrects for differences in image acquisition time which may be necessary throughout the experiment. We and others have shown a direct correlation between bioluminescence in a defined organ and viral titers as measured by plaque assay (9) (1). It is important to note that BLI provides relative quantification of bioluminescence in an anatomic site rather than absolute determinations of the concentration of luciferase enzyme. This difference is due to variable attenuation of light by pigmentation in different organs and depth within an animal. For a defined anatomic site, an investigator may conclude that greater amounts of bioluminescence correspond to increased viral replication, and it is possible to generate a standard curve for bioluminescence versus viral titers. However, the same amount of light emitted from a different region will not necessarily correlate with the same amount of virus. For example, light emitted from 1 × 10⁴ pfu of our recombinant HSV-1 reporter virus will be substantially higher in the eye than the liver. BLI data for viral replication are most reliable over time when standard ROIs are used to compare amounts of bioluminescence in a specific anatomic site.
Validation of imaging data. To correlate photons with viral titers in a defined organ or other anatomic site, we quantify bioluminescence in an organ of interest and then directly measure viral titers in the excised organ. For example, we have used this method to establish a direct correlation between lung bioluminescence and viral titers following intranasal inoculation of a recombinant vaccinia virus expressing firefly luciferase (Fig 2) (1).
Fig 1. Region of interest analysis for bioluminescence imaging data.

Bioluminescence image of C57BL/6 mice infected intranasally with 1 × 10⁵ pfu recombinant vaccinia virus that expresses firefly luciferase from a hybrid early/late gene promoter. Bioluminescence image parameters were 1 second acquisition time, 13 cm FOV, and 1024 × 1024 matrix. Relative amounts of bioluminescence are depicted on a pseudocolor scale with red representing the highest and blue the lowest intensity. The bioluminescence image is superimposed on a gray-scale photograph of the infected mouse. ROI boxes are shown around the head, chest, and abdomen. Photons in each ROI are listed.
Fig 2. Direct correlation between bioluminescence and viral titers.
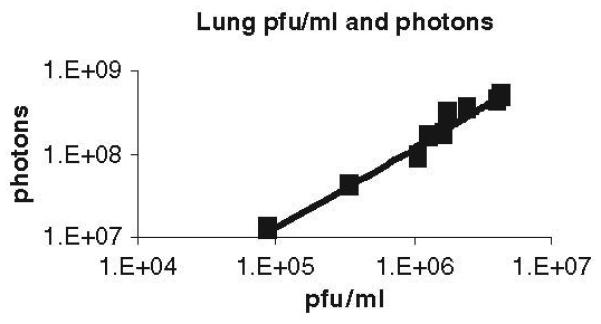
C57BL/6 mice were infected with 1 × 10⁵ pfu vaccinia reporter virus intranasally. Bioluminescence in the chest, which corresponds predominantly to infection in lungs, was measured on day 6 post-infection. Viral titers in excised organs then were quantified by standard plaque assay. The graph may be used as a standard curve to determine viral titers in the lung based on bioluminescence imaging data.
3.4. Biosafety
Isoflurane gas that leaks into the environment is a waste product that poses potential health hazards. Waste gases must be scavenged with charcoal canisters or other traps as directed by local OSEH guidelines.
In most institutions, bioluminescence imaging instrumentation is part of a core facility used by multiple investigators, some of whom may be using immunocompromised mice for in vivo imaging studies. Therefore, it is imperative that BLI equipment and adjacent work areas not be contaminated with viruses, which typically are BSL-2 pathogens. While imaging infected animals, we wear protective clothing, including gown, mask, hair cover, gloves, and shoe covers. When feasible, we recommend that two researchers work together during BLI studies of viral infection. One person is responsible for handling infected animals, while the other person operates the computer system. This strategy greatly reduces the potential for contamination of difficult to clean surfaces, such as computer keyboards and monitors. After imaging is completed, all work areas and surfaces in the instrument are disinfected with an appropriate antiseptic spray (Note 7). In all cases, investigators using viral pathogens should work with local biosafety and animal approval committees to establish standard protocols for bioluminescence imaging of infectious agents.
Bioluminescence imaging protocol notes
Attenuation of the recombinant imaging virus does not necessarily diminish its utility for studies of pathogenesis, particularly if the attenuation is mild and can be overcome with larger infectious doses.
For studies involving very weak bioluminescence imaging signals in darkly pigmented mice, removing all hair with a depiliatory agent, such as Nair, can further enhance sensitivity for luciferase activity. This procedure is more time consuming, and the animal must be rinsed thoroughly with water to remove the agent after hair removal to avoid chemical burns. We do not typically treat mice with a depiliatory agent prior to bioluminescence imaging studies.
Standard dosing of D-luciferin is 150 mg/kg. Larger amounts will increase amounts of light with the trade off of greater costs for experiments.
Maintain a constant time period (typically 10 minutes) between injecting D-luciferin and beginning imaging to reduce variations caused by pharmacology of luciferin biodistribution and excretion.
Coelenterazine substrate for Renilla and Gaussia luciferases is injected intravascularly via tail vein or direct intracardiac routes. Injected amounts are 0.7 – 7.7 mg/kg. Imaging begins at 3 minutes after injection because of flash kinetics of these luciferases.
Optimize image acquisition time, FOV, and resolution as needed for optimal sensitivity and resolution.
Decontaminate imaging and anesthesia equipment with antiseptic solution approved by the local animal studies committee. Do not use this solution on the camera itself.
Acknowledgements
Infectious disease imaging research in the authors’ laboratory is supported by R21AI066192 and NIH R24CA083099 for the University of Michigan Small Animal Imaging Resource.
References
- 1.Luker K, Hutchens M, Schultz T, Pekosz A, Luker G. Bioluminescence imaging of vaccinia virus: effects of interferon on viral replication and spread. Virology. 2005;341:284–300. doi: 10.1016/j.virol.2005.06.049. [DOI] [PubMed] [Google Scholar]
- 2.Hutchens M, Luker K, Sottile P, Sonstein J, Lukacs N, Nunez G, Curtis J, Luker G. TLR3 increases disease morbidity and mortality from vaccinia infection. J Immunol. 2008;180:483–491. doi: 10.4049/jimmunol.180.1.483. [DOI] [PMC free article] [PubMed] [Google Scholar]
- 3.Cook S, Griffin D. Luciferase imaging of a neurotropic viral infection in intact animals. J Virol. 2003;77:5333–5338. doi: 10.1128/JVI.77.9.5333-5338.2003. [DOI] [PMC free article] [PubMed] [Google Scholar]
- 4.Pierson T, Diamond M, Ahmed A, Valentine L, Davis C, Samuel M, Hanna S, Puffer B, Doms R. An infectious West Nile virus that expresses a GFP reporter gene. Virology. 2005;334:28–40. doi: 10.1016/j.virol.2005.01.021. [DOI] [PubMed] [Google Scholar]
- 5.Zhao H, Doyle T, Coquoz O, Kalish F, Rice B, Contag C. Emission spectra of bioluminescent reporters and interaction with mammalian tissue determine the sensitivity of detection in vivo. J Biomed Optics. 2005;10:41210. doi: 10.1117/1.2032388. [DOI] [PubMed] [Google Scholar]
- 6.Bhaumik S, Gambhir S. Optical imaging of Renilla luciferase reporter gene expression in living mice. Proc Natl Acad Sci USA. 2002;99:377–382. doi: 10.1073/pnas.012611099. [DOI] [PMC free article] [PubMed] [Google Scholar]
- 7.Tannous B, Kim D, Fernandez J, Weissleder R, Breakefield X. Codon-optimized Gaussia luciferase cDNA for mammalian gene expression in culture and in vivo. Mol Ther. 2005;11:435–443. doi: 10.1016/j.ymthe.2004.10.016. [DOI] [PubMed] [Google Scholar]
- 8.Loening A, Wu A, Gambhir S. Red-shifted Renilla reniformis luciferase variants for imaging in living subjects. Nat Methods. 2007;4:641–643. doi: 10.1038/nmeth1070. [DOI] [PubMed] [Google Scholar]
- 9.Luker G, Bardill J, Prior J, Pica C, Piwnica-Worms D, Leib D. Noninvasive bioluminescence imaging of herpes simplex virus type 1 infection and therapy in living mice. J Virol. 2002;76:12149–12161. doi: 10.1128/JVI.76.23.12149-12161.2002. [DOI] [PMC free article] [PubMed] [Google Scholar]
- 10.Saxena M, Aton F, Hildebolt C, Prior J, Abraham U, Piwnica-Worms D, Herzog E. Bioluminescence imaging of period1 gene expression in utero. Mol Imaging. 2007;6:68–72. [PubMed] [Google Scholar]
- 11.Zhao H, Doyle T, Wong R, Cao Y, Stevenson D, Piwnica-Worms D, Contag C. Characterization of coelenterazine analogs for measurements of Renilla luciferase activity in live cells and living animals. Mol Imaging. 2004;3:43–54. doi: 10.1162/15353500200403181. [DOI] [PubMed] [Google Scholar]
- 12.Pichler A, Prior J, Piwnica-Worms D. Imaging reversal of multidrug resistance in living mice with bioluminescence: MDR1 P-glycoprotein transports coelenterazine. Proc Natl Acad Sci USA. 2004;101:1702–1707. doi: 10.1073/pnas.0304326101. [DOI] [PMC free article] [PubMed] [Google Scholar]
- 13.Paroo Z, Bollinger R, Braasch D, Richer E, Corey D, Antich P, Mason R. Validating bioluminescence imaging as a high-throughput, quantitative modality for assessing tumor burden. Mol imaging. 2004;3:117–124. doi: 10.1162/15353500200403172. [DOI] [PubMed] [Google Scholar]