

Abstract
The adipose tissue can make important contributions to immune function. Nevertheless, only a limited number of reports have investigated in lean hosts the immune response elicited in this tissue upon infection. Previous studies suggested that the intracellular protozoan Neospora caninum might affect adipose tissue physiology. Therefore, we investigated in mice challenged with this protozoan if immune cell populations within adipose tissue of different anatomical locations could be differently affected. Early in infection, parasites were detected in the adipose tissue and by 7 days of infection increased numbers of macrophages, regulatory T (Treg) cells and T-bet+ cells were observed in gonadal, mesenteric, omental and subcutaneous adipose tissue. Increased expression of interferon-γ was also detected in gonadal adipose tissue of infected mice. Two months after infection, parasite DNA was no longer detected in these tissues, but T helper type 1 (Th1) cell numbers remained above control levels in the infected mice. Moreover, the Th1/Treg cell ratio was higher than that of controls in the mesenteric and subcutaneous adipose tissue. Interestingly, chronically infected mice presented a marked increase of serum leptin, a molecule that plays a role in energy balance regulation as well as in promoting Th1-type immune responses. Altogether, we show that an apicomplexa parasitic infection influences immune cellular composition of adipose tissue throughout the body as well as adipokine production, still noticed at a chronic phase of infection when parasites were already cleared from that particular tissue. This strengthens the emerging view that infections can have long-term consequences for the physiology of adipose tissue.
Keywords: adipose tissue, leptin, macrophages, Neospora caninum, regulatory T cells
Introduction
The adipose tissue, viewed in the past merely as a lipid depot, is now recognized as an endocrine organ that significantly contributes to immune function.1 This has been widely explored in studies addressing adipose tissue inflammation, which is associated with obesity.2 However, only a limited number of studies have addressed in lean hosts the impact of infection in the adipose tissue immune cell composition and function.3–6 Adipose tissue can be separated into visceral adipose tissue (VAT) and subcutaneous adipose tissue (SAT). Distinct lymphoid structures have been identified in the different types of VAT, such as fat-associated lymphoid clusters in the mouse mesentery and milky spots in the omentum, which can contribute differently to the immune response.7 Moreover, differences were recently reported in the composition of the non-adipocyte cells isolated from adipose tissue, known as stromal vascular fraction (SVF), of different intra-abdominal fat depots.8 Despite these reported differences, the majority of studies addressing the immune response to infection in the adipose tissue focused on just one or two types of VAT.
Neospora caninum is a cyst-forming apicomplexa parasite closely related to Toxoplasma gondii. Neosporosis, the disease caused by N. caninum, was first recognized in domestic dogs in the 1980s and later on in cattle, the economically relevant host.9,10 In cattle, this parasitic disease assumes particular importance by causing repeated abortions, birth of sickly calves, or of apparently healthy but chronically infected animals,9,11 imposing a high economic burden in the dairy and beef industries.10 Neospora caninum seropositivity has been associated with a reduction in weight gain in beef cattle12 and decreased fat and milk production in dairy cattle.13,14 In addition, mice infected with N. caninum presented an up-regulation of genes mapped to the adipocytokine signalling pathway.15 Therefore, an influence of N. caninum infection in adipocyte metabolism can be hypothesized. In this work we investigated if adipose tissue from different anatomical locations (gonadal, mesenteric, omental, subcutaneous and intramuscular) could be differently affected in the course of infection by assessing different leucocyte cells recruited into that tissue or expanded therein. Our results showed marked immune cell alterations in the adipose tissue of N. caninum-infected mice that persist after local parasite elimination and also elevated serum leptin in chronically infected mice. This indicates that N. caninum infection may persistently affect the metabolic regulation of the host.
Material and methods
Mice
Female wild-type (WT) C57BL/6 mice (7–8 weeks old) were purchased from Charles River Laboratory (Wilmington, MA) and kept at the ICBAS animal facilities (Porto, Portugal) during the experiments. Female interleukin-12 (IL-12)/IL-23 p40-deficient (p40−/−) C57BL/6 mice were purchased from Jackson Laboratories (Bar Harbor, ME) and housed and bred also at ICBAS in individual ventilated cages. Hiding and nesting materials were provided. Procedures involving mice were performed according to the European Convention for the Protection of Vertebrate Animals used for Experimental and Other Scientific Purposes (ETS 123) and directive 2010/63/EU of the European parliament and of the council of 22 September 2010 on the protection of the animals used for scientific purposes, and Portuguese rules (DL 113/2013). Authorization to perform the experiments was issued by competent national board authority, Direcção-Geral de Alimentação e Veterinária (0420/000/000/2012).
Parasites
Neospora caninum tachyzoites (NcT) [Nc-1, ATCC® (50843)] were obtained from infected VERO cell cultures as previously described.16 The viability of the used inocula was confirmed in highly susceptible p40−/− C57BL/6 mice.17
Challenge infections
Neospora caninum infections were performed in 9- to 13-week-old WT C57BL/6 mice by the intraperitoneal route, by inoculation of 0·5 ml PBS containing 1 × 10⁷ tachyzoites. Mock-infected controls were similarly intraperitoneally (i.p.) injected with 0·5 ml of PBS. Alternatively, mice were intragastrically (i.g.) challenged with 1 × 10⁷ tachyzoites in 0·2 ml of PBS or similarly treated with PBS alone using a previously described protocol.18 The IL-12/IL-23 p40−/− mice, were also i.p. inoculated with 5 × 10⁵ NcT.
Collection of biological samples
Six hours, 7 days, 21 days and 2 months after infection, mice were anaesthetized with isoflurane for retro-orbital blood collection and killed by cervical dislocation. For flow cytometry analysis, gonadal adipose tissue (GAT) (VAT present in broad ligament of uterus and ovaries), mesenteric adipose tissue (MAT) (VAT between the two peritoneal layers of the mesentery), omental adipose tissue (OAT) (VAT associated to the greater omentum; in the dissection, pancreas was carefully avoided), inguinal subcutaneous adipose tissue (SAT) (carefully avoiding inguinal lymph nodes) and mesenteric lymph nodes (MLN) were removed and placed in Hanks' balanced salt solution supplemented with 4% BSA, 10 mm HEPES buffer (Sigma-Aldrich, St Louis, MO) for further analysis. In other sets of experiments, GAT, MAT, OAT, SAT, MLN, lungs, brain, liver and musculature of the posterior limbs were collected from all mice, portions were preserved in 3·7–4·1% buffered formalin (Panreac, Darmstadt, Germany) for histopathological and immunohistochemical analysis and others were stored at −80° for DNA extraction. For whole adipose tissue mRNA extraction, GAT, MAT, OAT and SAT were stored in TriReagent™ (Sigma).
Histopathological examination and immunohistochemistry
After fixation in 3·7–4·1% buffered formalin the organs/tissues were dehydrated, embedded in paraffin wax and four serial sections were cut from each block. One section was stained with haematoxylin & eosin and the others were used for immunohistochemistry analysis. For Foxp3 and N. caninum staining, sections were boiled in a pressure cooker in 10 mm citrate buffer, pH 6·0, for 2 min. Blocking of endogenous biotin activity was performed, in sections designated to Foxp3 staining, using the Avidin/Biotin Blocking kit (Vector Laboratories, Burlingame, CA), according to the manufacturer's instructions. Endogenous peroxidase activity was blocked in all sections by treatment with 0·3% hydrogen peroxide in methanol (Merck, Darmstadt, Germany) for 10 min. Sections were then incubated in a moist chamber for 20 min with normal rabbit serum (Dako, Glostrup, Denmark) diluted 1 : 5 in 10% BSA (Sigma), to eliminate non-specific staining. Excess serum was removed and the sections were incubated at room temperature, 1 hr 30 min with goat anti-N. caninum polyclonal serum (VMRD, Pullman, WA) diluted 1 : 2000, rat anti-mouse F4/80 (BM8), rat anti-mouse/rat Foxp3 (FJK-16s), or the isotype control Rat IgG2a k (all from eBioscience, San Diego, CA) diluted 1 : 100. Sections incubated with anti-N. caninum antibody were washed and incubated for 30 min at room temperature with the peroxidase-labelled rabbit anti-goat secondary antibody (Millipore, Billerica, MA) diluted 1 : 1500. The other sections were incubated for 30 min with a 1 : 200 dilution of biotin-labelled anti-rat secondary antibody (Dako) and then with the avidin–biotin peroxidase complex (Dako), for a further 30 min. The colour in all sections was developed by incubation with 3,3′-diaminobenzidine (Dako). After counterstaining tissue sections with Mayer's haematoxylin (Merck), slides were mounted in Entellan (Merck). A positive reaction was indicated by the presence of brown cytoplasmic staining. For F4/80 and Foxp3 analyses, 20 images of a section of GAT, MAT and SAT from each individual mice were obtained in a 200× magnification field. Due to the small dimension of OAT, 5–20 images were acquired. Only intramuscular adipose tissue (IMAT) was analysed in the images obtained from the musculature of the posterior limbs. The area of interest was determined by manually selecting it using image analysis software imagej 1.47v (National Institutes of Health, Bethesda, MD). The total number of Foxp3+ cells was counted in the images and divided by the total area analysed. As it was difficult to accurately count individual cells in the F4/80 staining, the percentage of stained area was instead determined using imagej, as previously described.19 Numbers of Foxp3+ cells were analysed in a total area of 4 mm2 for GAT, MAT and SAT, 0·6–4·9 mm2 for OAT and 0·01–0·4 mm2 for IMAT in each individual mouse. Percentage of F4/80-stained area was analysed in a total area of 4 mm2 for GAT, MAT and SAT, 0·2–4 mm2 for OAT and 0·03–0·5 mm2 for IMAT.
Isolation of stromal vascular fraction cells
For isolation of SVF cells we followed the methodology previously described20,21 with slight modifications. Briefly, collagenase type II (Sigma-Aldrich) prepared in Hanks' balanced salt solution supplemented with 4% BSA, 10 mm HEPES was added to the recovered adipose tissue samples to a final concentration of 1 mg/ml. Samples were placed in a water bath at 37°, up to 60 min with manual shaking every 10 min. As control, we also added collagenase type II to MLN that were incubated for 30 min in the water bath. Digested samples were homogenized to single-cell suspensions, passed through a 100-μm cell strainer (BD Biosciences Pharmingen, San Diego, CA) and centrifuged at 280 g for 10 min at 4°. Cells at the bottom, corresponding to the SVF were resuspended in Dulbecco's PBS, supplemented with 1% BSA, 2 mm EDTA, 10 mm HEPES buffer (all from Sigma-Aldrich).
Cell sorting of macrophages
For cell sorting of macrophages present in GAT, the procedure described above for isolation of SVF cells was used except the cells were recovered in PBS supplemented with 5 mm EDTA (Sigma), 25 mm HEPES (Sigma) and 2% fetal bovine serum (HyClone®, Thermo Scientific, Logan, UT) instead of Hanks' balanced salt solution. Cells were then incubated with anti-mouse CD16/CD32 (clone 93) for blocking Fc receptors, followed by incubation with APC eFluor 780 anti-mouse F4/80 (BM8) (all from eBioscience). Cells were then sorted in a FACS Aria sorter (BD Biosciences, San Jose, CA) according to expression of F4/80.
Cytospin staining
Cytospins of the above-mentioned SVF cells and F4/80+-sorted cells were prepared. The slides were methanol fixed, stained with Hemacolor® Solutions 2 and 3 (Merck, Darmstadt, Germany) and mounted in Entellan® (Merck). Isolated SVF cells of GAT were also cytocentrifuged and specifically stained with anti-mouse F4/80 (BM8) by the protocol described above for tissue sections.
Flow cytometric analysis
For dead cell exclusion all samples, except single-stained controls, were first incubated with eFluor® 450 Fixable Viability Dye (eBioscience, San Diego, CA) diluted 1 : 1000 in Dulbecco's PBS for 30 min at 4°. Before surface staining, cells were incubated with anti-mouse CD16/CD32 in Dulbecco's PBS, 1% BSA, 2 mm EDTA, 10 mm sodium azide for Fc receptor blocking. For macrophage analysis, SVF cells were surface stained with Alexa Fluor 488® anti-mouse CD206 (clone C068C2) (BioLegend, San Diego, CA), phycoerythrin (PE) -conjugated anti-mouse NK1.1 (clone PK136) and allophycocyanin (APC) -conjugated eFluor® 780 anti-mouse F4/80 (clone BM8) (all from eBioscience). For Foxp3 and T-bet expression analysis, SVF cells were surface stained with FITC anti-mouse CD4 (clone RM4-5), APC anti-mouse CD25 (clone PC61.5), APC-eFluor® 780 anti-mouse NK1.1 (clone PK136) (all from eBioscience), Brilliant Violet 510™ anti-mouse CD3 (clone 17A2) (BioLegend), fixed and permeabilized (Foxp3 fixation/permeabilization buffer, eBioscience), washed and pre-incubated with anti-mouse CD16/CD32 (clone 93) before intracellular staining with PE-Cy7 anti-mouse T-bet (clone eBio4b10) and PE anti-mouse/rat Foxp3 (clone FJK-16s) or the respective isotype control (all from eBioscience). Data acquisition was performed in a FACSCanto™ II system (BD Biosciences, San Jose, CA) using the facsdiva™ software (BD) and compensated and analysed in FlowJo version 9.7.5. (Tree Star Inc., Ashland, OR). A bioexponential transformation was applied to improve data visualization; 1 × 10⁶ SVF cells were stained per sample.
RNA isolation and real-time PCR analysis
Total RNA was extracted from 1 × 10⁶ SVF cells or from whole adipose tissue samples 7 days and 2 months after infection, respectively, using TriReagent™ (Sigma-Aldrich) according to the manufacturer's instructions. All RNA samples were recovered in 9 μl of nuclease-free H2O and quantified using Nanodrop ND-1000 apparatus (Thermo Scientific). Synthesis of cDNA was then performed from 0·3 to 11 μg of total RNA prepared as described above in a 10 μl final volume using a Maxima® First-Strand cDNA Synthesis kit for RT-quantitative PCR (Fermentas, Thermo Scientific), according to the manufacturer's instructions. The PCR programme run (25° for 10 min; 50° for 30 min; 85° for 5 min) was performed in a TProfessional Basic Thermocycler (Biometra GmbH, Goettingen, Germany). Real-time PCR was then used for the semi-quantification of arginase (Arg1), nitric oxide synthase 2, inducible (Nos2), interleukin-10 (Il10), interferon-γ (Ifng) and leptin (Lep) mRNA expression levels with the Kapa SYBR Fast qPCR Kit (Kapa Biosystems Inc, Wilmington, MA) in a Rotor-Gene 6000 (Corbett Life Science, Sydney, Australia). As reference genes we used hypoxanthine guanine phosphoribosyl transferase (Hprt), a widely used reference gene, and Non-POU-domain-containing, octamer binding protein (Nono), described as being the most suitable reference gene for normalization comparative to others when working with the cell line 3T3-L1.22 Since the SVF of adipose tissue also contains adipocyte progenitors, we introduce this reference gene in our analysis. For the quantification of mRNA expression levels, the reaction was performed in a final volume of 10 µl containing 0·2 µm of each specific primer:18,22–24 Nono forward: TGC TCC TGT GCC ACC TGG TAC TC, Nono reverse: CCG GAG CTG GAC GGT TGA ATG C; Hprt forward: ACA TTG TGG CCC TCT GTG TG, Hprt reverse: TTA TGT CCC CCG TTG ACT GA, Arg1 forward: CTC CAAG CCA AAG TCC TTA GAG; Arg1 reverse: AGG AGC TGT CAT TAG GGA CAT C; Nos2 forward: CCA AGC CCT CAC CTA CTT CC; Nos2 reverse: CTC TGA GGG CTG ACA CAA GG; Il10 forward: GCT CTT ACT GAC TGG CAT GAG; Il10 reverse: CGC AGC TCT AGG AGC ATG TG, Ifng forward: TGG CAA AAG GAT GGT GAC ATG, Ifng reverse: GAC TCC TTT TCC GCT TCC TGA, Lep forward: TCAAGCAGTGCCTATCCAGA, Lep reverse: AAGCCCAGGAATGAAGTCCA (all from Tib Molbiol, Berlin, Germany) and 1× Master Mix plus 1 µl of the newly synthesized cDNA. The PCR programme run was as follows: (i) denaturation at 95° for 5 min, and (ii) amplification in 35 cycles (95° for 10 seconds; 62° for 20 seconds). We analysed real-time PCR data by the comparative threshold cycle (CT) method.25 Individual relative gene expression values were calculated using the following formula: 2−(CT gene of interest − CT constitutive gene).25
PCR for detection of N. caninum
DNA from the brain, lung, liver and adipose tissue of infected and PBS-treated mice, or from NcT to use as positive standards, was extracted as previously described.18 Neospora caninum DNA was detected using primers and a TaqMan® probe designed for the Nc5 gene of N. caninum. Quantitative real-time PCR (qPCR) was performed in a Rotor-Gene 6000 (Corbett Life Science) device. Product amplification was performed with 1 µl of template DNA, corresponding to 500–2000 ng of DNA in a final volume of 10 µl containing 0·2 µm of each primer (forward primer, Neo S: GTT GCT CTG CTG ACG TGT CG; reverse primer Neo A: GCT ACC AAC TCC CTC GGT T), 0·3 µm of Taqman® probe Neo TM (6FAM-CCC GTT CAC ACA CTA TAG TCA CAA ACA AAA-BBQ) (all designed by Tib Molbiol) and 1× Rotor-Gene Probe PCR Master Mix (Qiagen, Hilden, Germany). The PCR programme run was as follows: (i) denaturation at 95° for 3 min, (ii) amplification in 60 cycles (denaturation at 95° for 5 seconds; combined annealing/extension 60°, 20 seconds, acquiring to Cycling A Green). DNA samples corresponding to 103–100 tachyzoites were included as external standards for creating a standard curve. Quantitative evaluation of fluorescence signals from the PCR products was performed with rotor-gene software (version 1.7.75).
Cytokine serum measurements
Serum leptin, adiponectin and insulin titres were quantified with ELISA kits (Merck Millipore, Billerica, MA) according to the manufacturer's instructions.
Statistical analysis
Statistical significance of results was determined by non-parametric Mann–Whitney U-test calculated with graphpad prism 6.0 software (GraphPad Software, Inc., La Jolla, CA). (*P ≤ 0·05; **P ≤ 0·01; ***P ≤ 0·001; ****P ≤ 0·0001.)
Results
The adipose tissue is readily but transiently colonized in mice challenged i.p. with N. caninum tachyzoites
Since the adipose tissue could be a site of parasite persistence, as previously shown,26 we assessed in mice challenged i.p. with N. caninum whether this parasite may infect and persist in that tissue. Antigens and cells from the peritoneal cavity are collected by the omentum.27 Accordingly, parasites could be detected as early as 6 hr upon the infectious challenge in OAT SVF cells displaying macrophage morphology (Fig.1a). Although less frequent, we also detected parasite-infected cells with similar morphology in the MAT and GAT SVF (Fig.1a). Seven days after infection, parasitic forms were not readily observed in the SVF by Giemsa staining. Nevertheless, N. caninum DNA was detected by qPCR in all adipose tissue samples analysed (Fig.1b) except for SAT where parasitic DNA was only detected in 1 out of 11 infected mice. At this time-point, cellular infiltrates, mainly consisting of mononuclear cells, were found in the adipose tissue of infected mice (see Supporting information, Fig. S1). These infiltrates were slight in SAT, moderate in GAT and MAT but very marked in OAT. In skeletal muscle sections, the cellular infiltrates seen in the adipose depots between the muscular fascicles were inconspicuous. Interestingly, parasite DNA was also detected in macrophages – defined here as cells with high autofluorescence (AFhigh) and staining brightly with the cell surface marker F4/80 (F4/80high) – sorted from the GAT of infected mice 7 days after the parasite challenge (n = 3). At this time point, parasitic forms were also detected by immunohistochemistry in GAT and OAT of 1/11 and 2/9 mice, respectively (Fig.1c). Parasitic forms were also detected in the lungs of 8/11 mice, a major target organ in the acute phase of N. caninum infection,28 and in the brain of 5/11 mice (Fig.1c). Parasitic DNA was detected in these two organs in all infected mice (Fig.1b). To determine if the adipose tissue could be a place of parasitic persistence in the infected mice, the presence of N. caninum was assessed in the different adipose tissue samples 2 months post-infection. However, no parasite DNA was detected in any of the analysed samples (GAT, MAT and SAT) as well as in the lungs and liver of the infected mice (n = 10). Nevertheless, it was detected in the brain of 6/10 infected mice, indicating chronic infection. Altogether, these results show that adipose tissue is readily colonized in mice infected i.p. with N. caninum and that the immune response is effective in preventing parasite persistence in that tissue.
Figure 1.
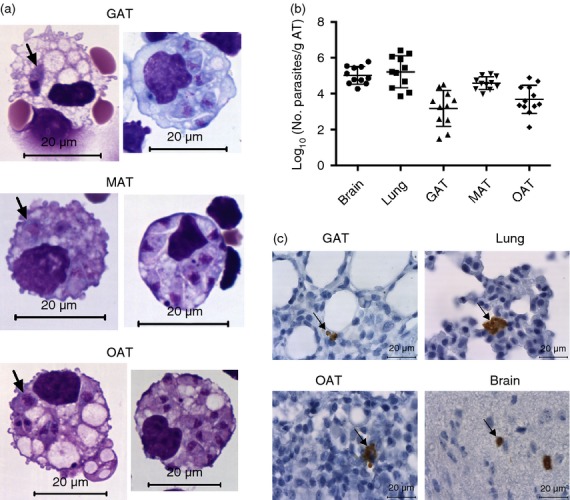
Parasitic burden in the adipose tissue of infected mice. (a) Hemacolor staining of stromal vascular fraction cells isolated from gonadal adipose tissue (GAT), mesenteric adipose tissue (MAT) and omental adipose tissue (OAT) of C57BL/6 wild-type (WT) mice 6 hr after intraperitoneal administration of 1 × 10⁷ Neospora caninum tachyzoites (NcT). Parasites are observed inside cells with macrophage-like morphology (indicated by arrows). (b) Parasitic load expressed as Log10 of the number of parasites per gram of tissue, determined by PCR analysis, of the indicated organs or adipose tissue of WT mice 7 days after NcT inoculation. Each symbol represents an individual mouse. Horizontal lines represent the mean values of the respective group (± SD). These are pooled results from three independent experiments. (c) Detection of N. caninum in the indicated tissues/organs of WT mice 7 days after NcT inoculation by immunohistochemistry analysis. Thin sections of the indicated organs/tissues were specifically stained (brown coloration, indicated by arrows) with a polyclonal serum goat anti-N. caninum and counterstained with haematoxylin.
Macrophages infiltrate the adipose tissue of N. caninum-infected mice
Macrophages can be found in the adipose tissue,2,23 differentiated into the pro-inflammatory M1 type, or into the M2 type, mainly associated with tissue remodelling and counterinflammatory responses.29 As these phagocytic cells are important mediators in the host immune response to N. caninum,30–32 their presence and distribution were comparatively analysed in adipose tissue of several anatomical locations in infected mice and sham-infected controls. By using immunohistochemistry we observed a marked increase in the F4/80-stained area in the VAT, SAT and IMAT of 7-day-infected mice, that was no longer detected by 2 months of infection (Fig.2a,b). The cell surface antigen F4/80, widely used as a marker for macrophages, is also expressed in lower amounts by other cells.33 Accordingly, we observed F4/80-expressing cells with morphology compatible with macrophages (Fig.2c) but also with polymorphonuclear cells, most likely eosinophils and neutrophils (Fig.2d) in the GAT of SVF-infected mice. Therefore, we used flow cytometry to better characterize macrophage populations in the different adipose tissues. As observed for splenic macrophages33 we also detected a high autofluorescence in GAT SVF cells displaying an F4/80high phenotype (Fig.3a). Sorted F4/80high AFhigh cells from GAT exhibited macrophage morphology while F4/80int cells were mainly polymorphonuclear cells (Fig.3b). Macrophages were therefore defined as F4/80high cells, as depicted in Fig.3(a). Interestingly, a population of F4/80high AFlow cells was also detected in the OAT. As this cell population presented a low side and forward light scatter profile (SSClow FSClow), consistent with lymphocytes, we excluded it in the macrophage analysis. The strong signal in the PE channel, detecting NK1.1 staining in F4/80high cells, was probably due to the elevated autofluorescence. Nevertheless, it may also have resulted from unspecific binding of the NK1.1-specific mAb clone, as previously suggested.33 To assess the presence of M2 macrophages in the adipose tissue, we used the CD206 marker as already reported by others,34 using the gating strategy shown in Fig.3(c). We observed an increase in the number of M2-type macrophages, defined as CD206+ F4/80+ cells, in the VAT and of CD206− F4/80+ cells, presumably M1 macrophages, in the VAT and SAT of the 7-day-infected mice (Fig.3d). As GAT was the one presenting the higher frequency of macrophages in the SVF we evaluated therein Arg1 and Nos2 gene expression, which is respectively associated with M2- and M1-type macrophages.29 As shown in Fig.4, higher Arg1 and Nos2 mRNA levels were found in the GAT of infected mice, in accordance with the flow cytometry analysis. Nevertheless, the frequency of M2-type macrophages was lower in these mice (Fig.3d). Interestingly, up-regulation of F4/80 was observed in GAT, MAT and SAT CD206+ cells and in GAT and SAT CD206− cells at this time-point (Fig.3d). Two months after infection, no differences were found between infected and control groups in the numbers of macrophages in the different types of adipose tissue (Fig.3e). A marginal decrease in the frequency of CD206+ cells with up-regulated F4/80 surface expression in the MAT of infected mice was observed (Fig.3e). Altogether, the above results show that the macrophage infiltration observed at early times after parasitic infection subsides with time.
Figure 2.
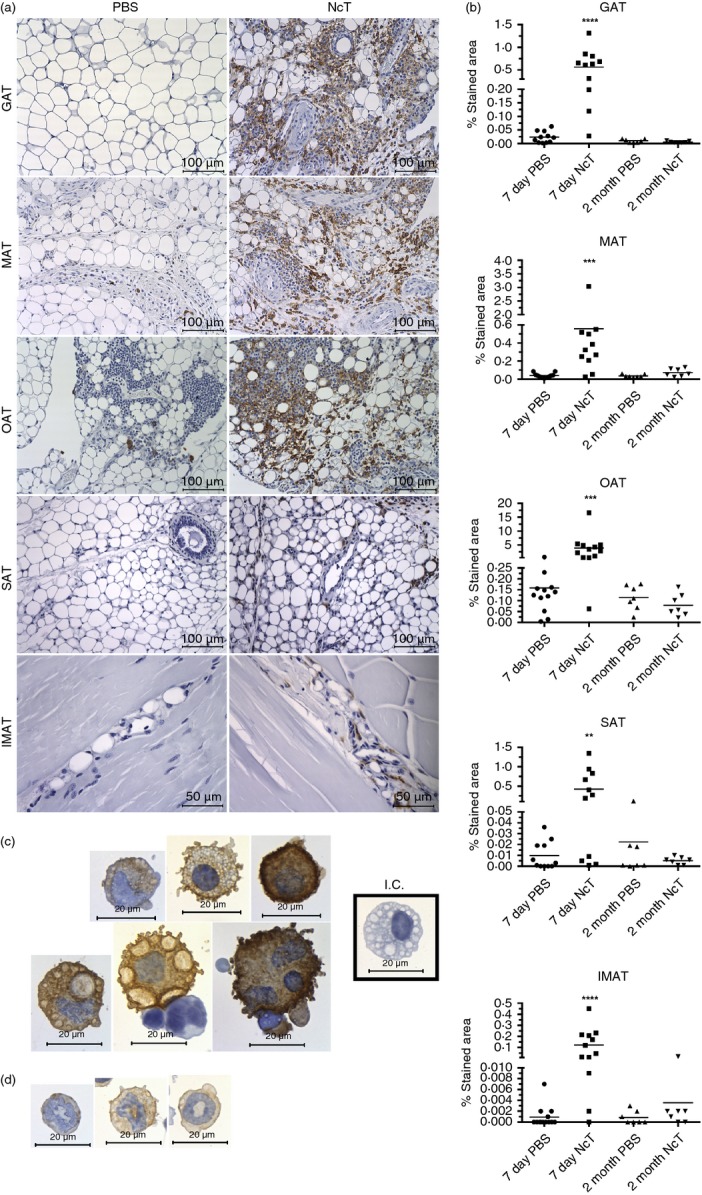
Increased F4/80-stained area in the adipose tissue of Neospora caninum-infected mice. (a) Representative immunohistochemistry analysis of F4/80 in gonadal adipose tissue (GAT), mesenteric adipose tissue (MAT), omental adipose tissue (OAT), subcutaneous adipose tissue (SAT) and intramuscular adipose tissue (IMAT) from wild-type C57BL/6 mice 7 days after intraperitoneal administration of 1 × 10⁷ N. caninum tachyzoites (NcT) or PBS. Adipose tissue was specifically stained (brown coloration) with a monoclonal anti-mouse F4/80 antibody and counterstained with haematoxylin. (b) Frequency of stained area of analysed adipose tissue depots at 7 days and 2 months after challenge. Each symbol represents an individual mouse. Horizontal lines represent the mean values of the respective group. These are pooled results from three (7 days) or two (2 months) independent experiments. Statistically significant differences between different experimental groups are indicated (Mann–Whitney U-test, **P ≤ 0·01; ***P ≤ 0·001; ****P ≤ 0·0001). Immunohistochemistry analysis of F4/80 in stromal vascular fraction cells isolated from the GAT of infected C57BL/6 mice, killed 7 days after the parasitic challenge. Cells were specifically stained (brown coloration) with a monoclonal rat IgG2a anti-mouse F4/80 antibody and counterstained with haematoxylin. Cells with morphology compatible with macrophages (c) and polymorphonuclear cells (d) are observed. I.C. (Cells stained with Isotype Control, Rat IgG2a). Bar = 100 µm in all micrographs but IMAT where bar = 50 µm.
Figure 3.

Increased macrophage numbers in the adipose tissue of Neospora caninum-infected mice. (a) Flow cytometry gating strategy used to define macrophages in the stromal vascular fraction (SVF) of the different depots of adipose tissue analysed. Dead cells were excluded with Fixable Viability Dye (FVD) and Singlets were then selected from FSC-A versus FSC-H dot plot. Macrophages were defined as F4/80high autofluorescencehigh. The fluorescence minus one (FMO) control is also shown. Dot plots are representative examples with SVF cells isolated from gonadal adipose tissue (GAT). (b) Hemacolor staining of sorted F4/80high autofluorescencehigh and F4/80low SVF cells, as indicated, from GAT of mice 7 days after intraperitoneal administration of 1 × 10⁷ N. caninum tachyzoites. Bar = 20 µm in all micrographs (c) Representative zebra plots of CD206+ F4/80+ and CD206− F4/80+ SVF cells gated in F4/80high autofluorescencehigh cells from of GAT of mice 7 days after parasitic challenge (NcT) or PBS (PBS). Respective isotype controls are shown. Numbers of CD206+ F4/80+ or CD206− F4/80+ cells per gram of adipose tissue or frequencies of the same cell populations in F4/80+ cells in the gonadal adipose tissue (GAT), mesenteric adipose tissue (MAT), omental adipose tissue (OAT) and subcutaneous adipose tissue (SAT) at (d) 7 days and (e) 2 months after intraperitoneal challenge with 1 × 10⁷ N. caninum tachyzoites (NcT) or PBS, as indicated. Mean fluorescence intensity (MFI) for F4/80 is also presented in the respective population of macrophages. Bars represent mean plus one SD of six to nine mice per group pooled from 3 (7 days) or 2 (2 months) independent experiments. (Mann–Whitney U-test, *P < 0·05; **P ≤ 0·01; ***P ≤ 0·001; ****P ≤ 0·0001).
Figure 4.
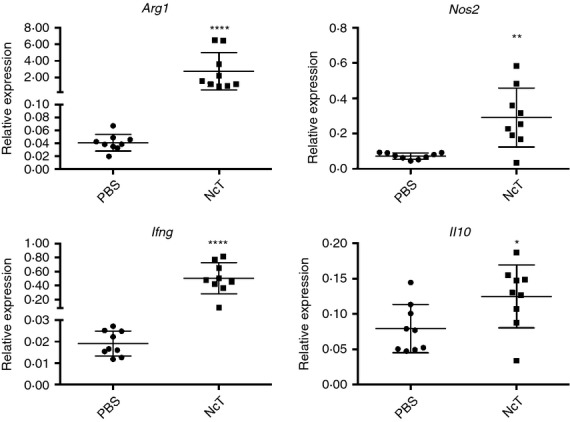
Increased expression of M1 and M2 macrophage markers in the adipose tissue of infected mice. Relative levels of arginase (Arg1), nitric oxide synthase 2, inducible (Nos2), interferon-γ (Ifng) and interleukin 10 (Il10) mRNA, normalized to Non-POU-domain containing octamer binding protein (Nono) mRNA, detected by real-time PCR in the stromal vascular fraction (SFV) of gonadal adipose tissue (GAT) of mice 7 days after intraperitoneal administration of 1 × 10⁷ Neospora caninum tachyzoites (NcT) or PBS (PBS). Each symbol represents an individual mouse. Horizontal lines represent the mean values of the respective group (± SD). These results are pooled from three independent experiments. (Mann–Whitney U-test, *P < 0·05; **P ≤ 0·01; ****P ≤ 0·0001).
Th1 cells are present at high numbers in the adipose tissue of N. caninum infected mice
T-bet is a well-known transcription factor regulating T helper 1 (Th1) cell lineage commitment.35 As the Th1-type immune response is fundamental to achieve protection against acute N. caninum infection, we evaluated whether CD4+ T-bet+ cells could participate in the local immune response in the adipose tissue. As T-bet is not exclusively expressed by CD4+ T cells,35 we defined Th1 cells as CD4+ CD3+ NK1.1− Foxp3− T-bet+ (Fig.5a). A previous report has shown that conventional T cells present in epididymal fat pads express high levels of T-bet transcripts and abundant intracellular interferon-γ (IFN-γ).21 Accordingly we observed a high frequency of T-bet+ CD4+ cells not only in GAT but also in MAT, OAT and SAT of control animals while MLN presented few T-bet+ cells (Fig.5b,c). An increase in the frequencies (Fig.5b) and numbers (see Supporting information, Fig. S2a) of Th1 cells was observed after 7 days upon infection in all types of adipose tissue analysed except for OAT where increased numbers but not proportions of these cells were detected. In accordance, increased expression of IFN-γ mRNA was observed in the GAT, 7 days after infection (Fig.4). By 2 months of infection, increased numbers of Th1 cells could still be observed in all adipose tissues analysed whereas a slight increase in their frequency was only detected in the MAT and SAT (Fig.5c and Fig. S2b). These results taken together indicate that, a Th1-type immune response is mounted in the adipose tissue during N. caninum infection, probably contributing to local parasite elimination. In order to further investigate whether an intact IL-12/IFN-γ axis is important for parasite clearance in the adipose tissue, p40−/− mice, which are highly susceptible to acute neosporosis,17 were i.p. infected with N. caninum and their VAT and SAT examined by immunohistochemistry. In contrast to wild-type mice, parasitic forms were abundantly observed in VAT (Fig.6a), where parasites could be observed closely associated with adipocytes (Fig.6b). Parasites were also detectable in SAT by 7 days of infection (Fig.6a). These results further suggest that an intact Th1-type immune response driven by IL-12 was protective in the adipose tissue.
Figure 5.

Increased T helper type 1 (Th1)/regulatory T (Treg) cell ratio in the adipose tissue of Neospora caninum-infected mice. (a) Flow cytometry analysis of Th1 cells (defined as T-bet+ Foxp3− CD4+ CD3+ NK−) and Treg cells in stromal vascular fraction cells isolated from omental adipose tissue. Dot plots are representative examples of gate strategy used to define Th1 and Treg cells in the different depots of adipose tissue analysed. Dead cells were excluded with Fixable Viability Dye (FVD). Percentages of T-bet+ Foxp3− cells, Foxp3+ CD25+ cells, Foxp3+ CD25− cells, CD25+ Foxp3− cells and Foxp3+ T-bet+ on total CD4+ CD3+ NK− cells in the gonadal adipose tissue (GAT), mesenteric adipose tissue (MAT), omental adipose tissue (OAT), subcutaneous adipose tissue (SAT) and mesenteric lymph nodes (MLN) from C57BL/6 mice killed 7 days (b) and 2 months (c) after intraperitoneal challenge with 1 × 10⁷ N. caninum tachyzoites (NcT) or PBS, as indicated. The ratio of Th1 cells (T-bet+ Foxp3− CD4+) and total Treg cells (Foxp3+ T-bet− CD4+) is also depicted for the different adipose tissue depots analysed. These are pooled results from three (7 days) or two (2 months) independent experiments. Bars represent means plus one SD of six to nine animals per group. (Mann–Whitney U-test, *P < 0·05; **P ≤ 0·01; ***P ≤ 0·001; ****P ≤ 0·0001).
Figure 6.
Detection of Neospora caninum in the adipose tissue of infected interleukin-12 (IL-12)/IL-23 p40−/− mice. (a) Representative images showing parasitic forms in the gonadal adipose tissue (GAT), mesenteric adipose tissue (MAT), omental adipose tissue (OAT) and subcutaneous adipose tissue (SAT) of p40−/− C57BL/6 mice 7 days after intraperitoneal administration of 5 × 10⁵ N. caninum tachyzoites, detected by immunohistochemistry. Thin sections of the indicated organs/tissues were specific stained (brown coloration, indicated by arrows) with a polyclonal serum goat anti-N. caninum and counterstained with haematoxylin. This is one representative result of two independent experiments with three mice per experiment. Bar = 100 µm (b) Higher magnification of GAT and MAT showing parasitic forms closely associated with adipocytes (arrow). Bar = 20 µm.
Regulatory T cells in the adipose tissue of N. caninum-infected mice
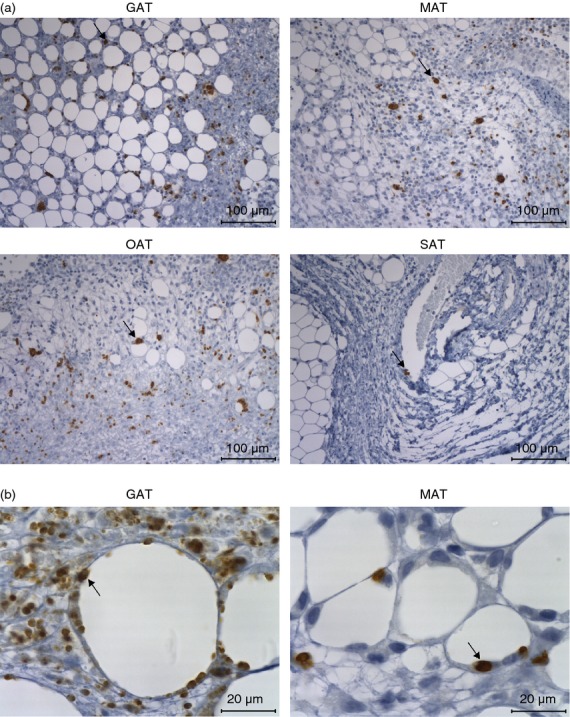
In previous works we showed that mice infected with N. caninum had increased numbers of splenic Foxp3+ CD25+ CD4+ cells.18,36 As a population of regulatory T (Treg) cells with a distinct gene expression profile and important for the control of inflammation was described in the abdominal adipose tissue of lean mice,21,37 we also assessed Treg cells in this tissue upon N. caninum infection. By immunohistochemistry, Foxp3+ cells were rarely observed in the different adipose tissue depots analysed in control mice, except in OAT where Foxp3+ cells were readily observed in the milky spots. Seven days after infection an increase in Foxp3+ cell numbers was readily observed in all VAT and SAT samples analysed (see Supporting information, Fig. S3). VAT Treg cells have been described as having high IL-10 transcript levels.21 As we observed increased numbers of Foxp3+ cells we determined IL-10 mRNA levels in the GAT of infected mice. A slight increase of IL-10 mRNA levels was observed in infected mice comparative to sham-infected controls when Nono was used as reference gene (Fig.4). However, no such increase was observed when using the Hprt gene for normalization. Therefore, the elevated Il10 gene transcription observed in the infected mice probably reflects a marginal phenomenon. Flow cytometric analysis showed that the increase in Foxp3+ cells observed 7 days after infection in the VAT and SAT, was due to both Foxp3+ CD25+ and Foxp3+ CD25− cells (Fig. S2a). However, conventional CD4+ T cells, defined here as Foxp3−, were also found in increased numbers upon infection, explaining the decreased frequency of Foxp3+ CD25+ CD4+ cells within total CD4+ cells observed in the GAT, OAT and SAT and of Foxp3+ CD25− CD4+ Treg cells in all types of adipose tissue analysed (Fig.5b and Fig. S2a). Two months after infection a decreased frequency of Foxp3+ CD25+ CD4+ cells could still be observed in the MAT and SAT and of Foxp3+ CD25− CD4+ in the MAT of N. caninum-challenged mice (Fig.5c). No comparative alteration in their respective frequencies was observed in the MLN of infected mice and controls at any time-point analysed (Fig.5b,c). Treg cells were still rarely detected in the IMAT of N. caninum-challenged mice at any of the-time points assessed (Fig. S3).
A population of Treg cells expressing the transcription factor T-bet, specialized in regulating Th1 cells, was described during type 1 inflammation.38 Accordingly, accompanying the increase in Th1 cells we also observed increased numbers of Foxp3+ T-bet+ cells in all adipose tissue samples analysed, and of their frequency in the MAT, 7 days after infection (Fig. S2a,b and Fig.5b). 2 months after infection only slight alterations were observed in numbers and frequencies of Foxp3+ T-bet+ cells (Fig.5c and Fig. S2b). Although both Th1 and Treg cells were found in increased numbers, the Th1/Treg ratio was higher in infected mice than controls in all adipose tissue samples analysed at 7 days and in MAT and SAT samples 2 months after infection (Fig.5b,c). This ratio may explain the effectiveness of the protective immune response, as assessed by the parasitic burden, in the adipose tissue.
Adipokines serum levels
Having observed a marked alteration in the adipose tissue immune cell composition upon infection, we determined whether the production of adipokines could also be affected. As shown in Fig.7(a), a significant increase of leptin serum levels was detected at 21 days and more markedly 2 months after infection, but was still within control levels at day 7. At each time-point assessed no difference in total body weight as well as that of GAT and of inguinal SAT (as surrogate markers of VAT and SAT, respectively) were observed between infected and control groups (Fig.7b). Notwithstanding, both control and infected mice groups were heavier at 2 months upon the i.p. challenge (21·6 ± 0·7 and 21·5 ± 1·5 g, respectively) than at the beginning of the experiment (day of challenge, 19·6 ± 1·2 and 19·3 ± 1·1 g, control and infected mice, respectively). Serum levels of adiponectin were found slightly below those of controls by day 7 post-infection but did not significantly differ from those of controls at later time points. To determine if the 10-fold increase in leptin serum levels observed 2 months after infection associated with hyperinsulinaemia, we determined insulin serum levels at this time-point. Those were found within control levels (0·48 ± 0·17 and 0·48 ± 0·11 ng/ml, for control and infected mice, respectively, n = 6). To determine whether this observation was peculiar to the route of infection used, leptin levels were also measured in the sera of mice challenged i.g. with N. caninum or PBS as controls. As for the i.p.-challenged mice, i.g.-infected mice also presented higher leptin serum levels than controls (2·19 ± 0·80 versus 1·24 ± 0·39 ng/ml, respectively; n = 5, P = 0·0317) despite having similar GAT (0·1606 ± 0·06886 versus 0·1599 ± 0·0159 g, respectively; n = 5, P = 0·3095) and body weight (20·48 ± 0·55 versus 21·28 ± 0·44 g, respectively; n = 5, P = 0·0635). Moreover, no difference in adiponectin serum levels was found between these infected mice and controls (17·57 ± 5·214 versus 13·38 ± 2·202 μg/ml, respectively; n = 5, P = 0·1508). Despite the observed increase in serum leptin, no difference was detected in leptin mRNA levels in the different adipose tissues analysed (Fig.7c). Together these results show that N. caninum infection leads to a sustained increase of host serum leptin and suggest that metabolic regulatory mechanisms may be affected in the long-term by infection. On the other hand, since leptin was shown to promote a Th1-type immune response,39 they also hint at a role for adipokines in promoting host resistance against this parasite.
Figure 7.
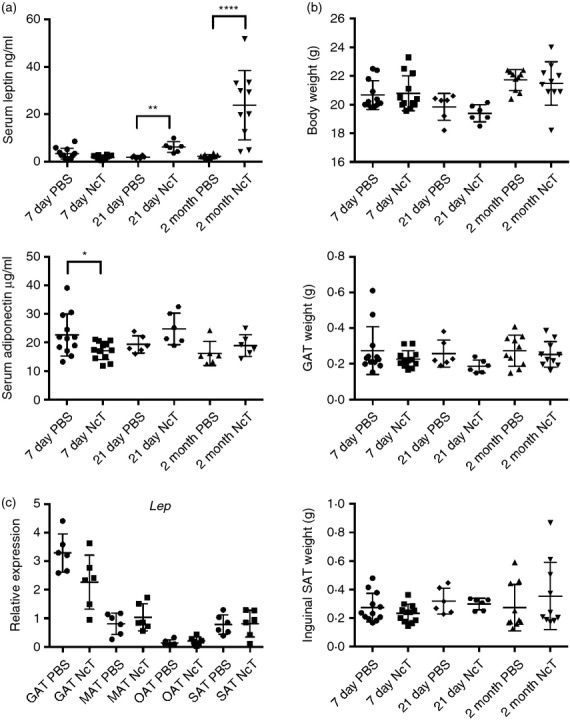
Leptin levels increase in the serum of Neospora caninum-infected mice. (a) Serum levels of leptin and adiponectin and (b) total body, gonadal adipose tissue (GAT) and inguinal subcutaneous adipose tissue (SAT) weight, as indicated, of C57BL/6 mice 7 days, 21 days and 2 months after intraperitoneal administration of 1 × 10⁷ N. caninum tachyzoites (NcT) or PBS. (c) Relative levels of leptin (Lep) mRNA, normalized to Non-POU-domain containing octamer binding protein (Nono) mRNA, detected by real-time PCR in GAT, mesenteric adipose tissue (MAT), omental adipose tissue (OAT) and SAT of mice 2 months after intraperitoneal administration of 1 × 10⁷ NcT or PBS. Each symbol represents an individual mouse. Horizontal lines represent the mean values of the respective group (± SD). These are pooled results from two to three independent experiments. (Mann–Whitney U-test, *P < 0·05; **P ≤ 0·01; ****P ≤ 0·0001).
Discussion
In this work we show that N. caninum infects the cells of the adipose tissue, where it is detected early in parasitic challenge and persists for several days. This infection is associated with increased cellular infiltrates that were particularly abundant in OAT. Similarly, increased numbers and size of immune aggregates in the omentum of mice challenged i.p. with a gammaherpevirus was previously reported.4 Further characterization of the adipose tissue showed a marked increase in F4/80-stained area, not only located in the vicinity of the peritoneal injection (VAT), but also in IMAT and SAT that are located more distant from the inoculation site. This shows that the i.p. parasitic challenge affected adipose tissue throughout the body. The increased F4/80-stained area observed may reflect a higher number of macrophages as well as up-regulated surface expression of that marker, as verified by flow cytometry analysis. Accordingly, F4/80 was previously shown to be up-regulated in peritoneal macrophages upon contact with N. caninum in vitro.30 Nevertheless, we cannot exclude that polymorphonuclear cells could also be contributing to the increased F4/80 staining. We confirmed, by using flow cytometry, that N. caninum infection led to an increase in the number of macrophages found in the adipose tissue at different anatomical locations. This could result from local proliferation of adipose tissue macrophages, as previously shown in other conditions,40 or from recruited blood monocytes.41 Indeed, excreted/secreted N. caninum proteins were shown to promote recruitment of monocytes to infection loci.42 An increase in macrophages in white adipose tissue was also observed in mice infected with Trypanosoma cruzi.3 The observed increase in both CD206+ F4/80+ and CD206− F4/80+ cell populations concomitant with increased Arg1 and Nos2 mRNA levels suggest that a mixed M1/M2 type macrophage response is elicited in the adipose tissue upon N. caninum challenge. The increased Arg1 mRNA expression can be important for limitation of inflammation-associated tissue damage but can also be promoting host susceptibility to N. caninum by suppressing nitric oxide (NO) production as shown for T. gondii infection.43 The detected increased Nos2 mRNA expression could indicate that upon the parasitic challenge, adipose tissue macrophages produce NO. Indeed, others have shown in vitro that NO production by peritoneal macrophages is an important mechanism inhibiting parasitic multiplication.32 Nevertheless, the role of NO in host resistance to neosporosis is controversial because discrepant outcomes were reported for N. caninum-infected iNOS2-deficient mice.32,44 Using OVA-specific OT-II mice, others have shown that adipose tissue macrophages promote CD4+ T-cell proliferation and IFN-γ production.45 Accordingly, we show here that upon infection with an apicomplexa parasite, macrophages and T-bet+ CD4+ T-cell numbers simultaneously increased in several adipose tissue depots. Interestingly, although no increase was observed in the frequency of T-bet+ cells in the MLN, the surrounding mesenteric adipose tissue presented an increased frequency of this cell population, still detected 2 months after infection. This suggests that macrophages are inducing an immune response in situ. Indeed we observed parasitic forms inside adipose tissue SVF cells with macrophage morphology, and parasite DNA was detected in sorted GAT macrophages. In vitro studies have shown that bovine monocyte-derived macrophages infected with N. caninum promote IFN-γ production by T cells31 and supernatants of co-cultures of purified splenic naive T cells with peritoneal CD11b+ cells stimulated with N. caninum antigen extracts have increased levels of IFN-γ.46 As we have observed increased numbers of macrophages in the GAT associated with increased IFN-γ mRNA expression, we hypothesize that adipose tissue macrophages infected in vivo with N. caninum are inducing IFN-γ production by adipose tissue T cells. Resistance to neosporosis has been associated with Th1-type immune responses.47 The increased numbers of T-bet+ CD4+ T cells in the adipose tissue, associated with the fact that 2 months after infection parasitic DNA was no longer detected therein, suggest that a protective immune response was locally elicited. Moreover, IL-12/IL-23 p40−/− mice presented abundant parasitic colonization in the VAT. This probably results from the compromised IL-12/IFN-γ axis rather than from defective Th17 differentiation, as a previous study found no evidence of increased IL-17 production in mice infected with this parasite.36 Treg cells are important for the control of excessive inflammation in the adipose tissue21,37 and, more generally, of exacerbated immune responses that could be harmful to the host.48 Therefore the observed increase in Treg cell number could be important to tone down the immune response in the adipose tissue. This would be in agreement with the slight increase in IL-10 mRNA observed upon infection in the GAT. However, M2 macrophages can also explain the higher IL-10 gene transcription detected, because these cells were also present in higher amounts upon infection. Moreover, we also observed increased numbers of Foxp3+ T-bet+ cells that have been shown to control Th1 type cells.38 However, the increased Th1/Treg cell ratio probably reflects the clonal expansion of conventional CD4+ T cells in the ongoing immune response to infection. This increased ratio was still observed 2 months after infection in MAT and SAT, suggesting that the inflammatory response in these tissues is maintained months into infection. This is further suggested by the lower frequency of CD206+ macrophages observed at that time-point in the MAT. Nevertheless, additional studies will be necessary to more comprehensively define inflammatory populations. Interestingly, our results suggest that adipose tissue from different anatomical locations may be differently affected in the long term, as shown by the sustained higher Th1/Treg cell ratio observed only in MAT and SAT. Surprisingly, a 10-fold increase in serum leptin levels was detected by 2 months after infection, also suggesting a long-term effect of the parasitic challenge in the adipose tissue. Leptin is an adiposity signal that acts in the brain to reduce food intake49,50 and is mainly produced by adipocytes.51 In mouse models of diet-induced obesity, higher levels of leptin are observed in heavier mice.52,53 Here we observed in the infected mice, serum leptin levels that can be as high as those previously reported in female C57BL/6 mice with diet-induced obesity.53,54 Nevertheless, this was without detected differences in body weight between control and infected mice groups at each assessed time point. As leptin production by adipose tissue can be stimulated by insulin,50 which is also a physiological signal of adiposity, we assessed whether serum insulin levels also increased. This was not confirmed, rendering the likelihood of insulin being the mechanism by which leptin was induced improbable. Furthermore, the absence of differences in body weight, body fat distribution and insulin levels, suggests that leptin increase after the infection is not primarily related to the hormone role in energy balance regulation. Despite the detected rise in serum leptin, no increased leptin mRNA levels were found in the different adipose tissues analysed. This may indicate that leptin secretion by adipocytes or plasma clearance could be affected. Increased serum leptin without increased mRNA levels was previously reported in another murine model.55 Alternatively, other tissues could be contributing to the adipokine serum increase. Skeletal muscle and gastric mucosa have been shown to produce leptin56,57 and therefore a contribution of these tissues to serum leptin levels cannot be excluded, in particular since the former is a known place for N. caninum persistence in the host.58 Leptin also has important effects in both innate and adaptive immunity,51 namely by promoting Th1 responses39 and negatively regulating Treg cell proliferation.59 Therefore the elevated serum leptin observed in the infected mice may contribute to the lower frequencies of Treg and increased Th1 cells observed in the adipose tissue independently of the presence of parasites. Interestingly, a positive association between seropositivity for T. gondii and obesity has recently been reported60 and plasma leptin levels were also increased in the serum of T. gondii-infected rats.61 Our results add evidence in that apicomplexa parasites are able to affect metabolic parameters. Infection by Trypanosoma cruzi has also been shown to affect metabolic parameters, as serum leptin levels were found below normal levels in 1-month-infected mice without body weight alterations.26 Overall, we show here that a challenge with an apicomplexa parasite contributes to a long-term inflammatory state in the adipose tissue even when parasites were no longer detected therein, providing compelling evidence that infection can have important long-term consequences in the adipose tissue physiology of non-obese hosts.
Acknowledgments
The authors are most indebted to Professor Artur Águas and Professor Rui Appelberg for fruitful discussions and critically revising the manuscript. The authors are also thankful to undergraduate students Daniela Costa e Sousa and Sofia Jesus for assistance with some experiments, Ana Pinto and Madalena Costa for excellent technical assistance, and Catarina Leitão for excellent technical assistance on cell sorting. This work was supported by FEDER through COMPETE and by national funds through FCT-FCOMP-01-0124-FEDER-020158 (FCT reference: PTDC/CTV/122777/2010). Luzia Teixeira was supported by Fundo Social Europeu and MCTES through POPH-QREN- Tipologia 4.2. Pedro Ferreirinha was supported by FCT grant SFRH/BD/76900/2011, Alexandra Correia was supported by FCT grant SFRH/BPD/91623/2012.
Glossary
Abbreviations:
- AF
autofluorescence
- APC
allophycocyanin
- Arg1
arginase 1
- FMO
fluorescence minus one
- FVD
fixable viability dye
- GAT
gonadal adipose tissue
- IFN-γ
interferon-γ
- i.g.
intragastrically
- IL-12
interleukin-12
- i.p.
intraperitoneally
- IMAT
intramuscular adipose tissue
- MAT
mesenteric adipose tissue
- MLN
mesenteric lymph nodes
- NcT
Neospora caninum tachyzoites
- NO
nitric oxide
- Nos2
inducible nitric oxide synthase 2
- OAT
omental adipose tissue
- PE
phycoerythrin
- qPCR
quantitative real-time PCR
- SAT
subcutaneous adipose tissue
- SD
standard deviation
- SVF
stromal vascular fraction
- Th1
T helper type 1
- Treg
regulatory T
- VAT
visceral adipose tissue
- WT
wild-type
Authors' contributions
LT conceived, designed and conducted experiments, supervised the imunohistochemistry analysis, analysed all the remaining data and wrote the manuscript. JM, JM, FB, RMM, PF, AC participated in the experiments and contributed to data analysis. PGF assisted in the design of experiments, recovery of the adipose tissue samples and interpretation of histological data. MM assisted in the experimental design and contributed to the interpretation of data regarding metabolic parameters. MV assisted in the design of experiments and contributed to the interpretation of data and manuscript writing. All authors read and approved the final manuscript.
Disclosures
The authors declare that they have no conflict of interest.
Supporting Information
Additional Supporting Information may be found in the online version of this article:
Figure S1. Inflammatory infiltrates in the adipose tissue of Neospora caninum-infected mice.
Figure S2. T helper type 1 cells and regulatory T cells are increased in the adipose tissue of Neospora caninum-infected mice.
Figure S3. Increased numbers of Foxp3+ cells in the adipose tissue of the infected mice.
References
- Schaffler A, Scholmerich J. Innate immunity and adipose tissue biology. Trends Immunol. 2010;31:228–35. doi: 10.1016/j.it.2010.03.001. [DOI] [PubMed] [Google Scholar]
- Mathis D. Immunological goings-on in visceral adipose tissue. Cell Metab. 2013;17:851–9. doi: 10.1016/j.cmet.2013.05.008. [DOI] [PMC free article] [PubMed] [Google Scholar]
- Nagajyothi F, Desruisseaux MS, Machado FS, et al. Response of adipose tissue to early infection with Trypanosoma cruzi (Brazil strain) J Infect Dis. 2012;205:830–40. doi: 10.1093/infdis/jir840. [DOI] [PMC free article] [PubMed] [Google Scholar]
- Gray KS, Collins CM, Speck SH. Characterization of omental immune aggregates during establishment of a latent gammaherpesvirus infection. PLoS One. 2012;7:e43196. doi: 10.1371/journal.pone.0043196. [DOI] [PMC free article] [PubMed] [Google Scholar]
- Na HN, Nam JH. Adenovirus 36 as an obesity agent maintains the obesity state by increasing MCP-1 and inducing inflammation. J Infect Dis. 2012;205:914–22. doi: 10.1093/infdis/jir864. [DOI] [PubMed] [Google Scholar]
- Wu D, Molofsky AB, Liang HE, Ricardo-Gonzalez RR, Jouihan HA, Bando JK, Chawla A, Locksley RM. Eosinophils sustain adipose alternatively activated macrophages associated with glucose homeostasis. Science. 2011;332:243–7. doi: 10.1126/science.1201475. [DOI] [PMC free article] [PubMed] [Google Scholar]
- Kaminski DA, Randall TD. Adaptive immunity and adipose tissue biology. Trends Immunol. 2010;31:384–90. doi: 10.1016/j.it.2010.08.001. [DOI] [PMC free article] [PubMed] [Google Scholar]
- Cohen CA, Shea AA, Heffron CL, Schmelz EM, Roberts PC. Intra-abdominal fat depots represent distinct immunomodulatory microenvironments: a murine model. PLoS One. 2013;8:e66477. doi: 10.1371/journal.pone.0066477. [DOI] [PMC free article] [PubMed] [Google Scholar]
- Dubey JP, Schares G, Ortega-Mora LM. Epidemiology and control of neosporosis and Neospora caninum. Clin Microbiol Rev. 2007;20:323–67. doi: 10.1128/CMR.00031-06. [DOI] [PMC free article] [PubMed] [Google Scholar]
- Reichel MP, Alejandra Ayanegui-Alcerreca M, Gondim LF, Ellis JT. What is the global economic impact of Neospora caninum in cattle – the billion dollar question. Int J Parasitol. 2013;43:133–42. doi: 10.1016/j.ijpara.2012.10.022. [DOI] [PubMed] [Google Scholar]
- Innes EA. The host–parasite relationship in pregnant cattle infected with Neospora caninum. Parasitology. 2007;134:1903–10. doi: 10.1017/S0031182007000194. [DOI] [PubMed] [Google Scholar]
- Barling KS, McNeill JW, Thompson JA, Paschal JC, McCollum FT, 3rd, Craig TM, Adams LG. Association of serologic status for Neospora caninum with postweaning weight gain and carcass measurements in beef calves. J Am Vet Med Assoc. 2000;217:1356–60. doi: 10.2460/javma.2000.217.1356. [DOI] [PubMed] [Google Scholar]
- Tiwari A, Vanleeuwen JA, Dohoo IR, Keefe GP, Haddad JP, Tremblay R, Scott HM, Whiting T. Production effects of pathogens causing bovine leukosis, bovine viral diarrhea, paratuberculosis, and neosporosis. J Dairy Sci. 2007;90:659–69. doi: 10.3168/jds.S0022-0302(07)71548-5. [DOI] [PubMed] [Google Scholar]
- Thurmond MC, Hietala SK. Effect of Neospora caninum infection on milk production in first-lactation dairy cows. J Am Vet Med Assoc. 1997;210:672–4. [PubMed] [Google Scholar]
- Ellis J, Sinclair D, Morrison D, Al-Qassab S, Springett K, Ivens A. Microarray analyses of mouse responses to infection by Neospora caninum identifies disease associated cellular pathways in the host response. Mol Biochem Parasitol. 2010;174:117–27. doi: 10.1016/j.molbiopara.2010.08.007. [DOI] [PubMed] [Google Scholar]
- Teixeira L, Botelho AS, Mesquita SD, et al. Plasmacytoid and conventional dendritic cells are early producers of IL-12 in Neospora caninum-infected mice. Immunol Cell Biol. 2010;88:79–86. doi: 10.1038/icb.2009.65. [DOI] [PubMed] [Google Scholar]
- Mineo TW, Benevides L, Silva NM, Silva JS. Myeloid differentiation factor 88 is required for resistance to Neospora caninum infection. Vet Res. 2009;40:32. doi: 10.1051/vetres/2009015. [DOI] [PMC free article] [PubMed] [Google Scholar]
- Teixeira L, Botelho AS, Batista AR, et al. Analysis of the immune response to Neospora caninum in a model of intragastric infection in mice. Parasite Immunol. 2007;29:23–36. doi: 10.1111/j.1365-3024.2006.00911.x. [DOI] [PubMed] [Google Scholar]
- Pereira SS, Morais T, Costa MM, Monteiro MP, Pignatelli D. The emerging role of the molecular marker p27 in the differential diagnosis of adrenocortical tumors. Endocr Connect. 2013;2:137–45. doi: 10.1530/EC-13-0025. [DOI] [PMC free article] [PubMed] [Google Scholar]
- Moro K, Yamada T, Tanabe M, et al. Innate production of TH2 cytokines by adipose tissue-associated c-Kit+ Sca-1+ lymphoid cells. Nature. 2010;463:540–4. doi: 10.1038/nature08636. [DOI] [PubMed] [Google Scholar]
- Feuerer M, Herrero L, Cipolletta D, et al. Lean, but not obese, fat is enriched for a unique population of regulatory T cells that affect metabolic parameters. Nat Med. 2009;15:930–9. doi: 10.1038/nm.2002. [DOI] [PMC free article] [PubMed] [Google Scholar]
- Arsenijevic T, Gregoire F, Delforge V, Delporte C, Perret J. Murine 3T3-L1 adipocyte cell differentiation model: validated reference genes for qPCR gene expression analysis. PLoS One. 2012;7:e37517. doi: 10.1371/journal.pone.0037517. [DOI] [PMC free article] [PubMed] [Google Scholar]
- Lumeng CN, Bodzin JL, Saltiel AR. Obesity induces a phenotypic switch in adipose tissue macrophage polarization. J Clin Invest. 2007;117:175–84. doi: 10.1172/JCI29881. [DOI] [PMC free article] [PubMed] [Google Scholar]
- Herrero L, Shapiro H, Nayer A, Lee J, Shoelson SE. Inflammation and adipose tissue macrophages in lipodystrophic mice. Proc Natl Acad Sci USA. 2010;107:240–5. doi: 10.1073/pnas.0905310107. [DOI] [PMC free article] [PubMed] [Google Scholar]
- Schmittgen TD, Livak KJ. Analyzing real-time PCR data by the comparative C(T) method. Nat Protoc. 2008;3:1101–8. doi: 10.1038/nprot.2008.73. [DOI] [PubMed] [Google Scholar]
- Combs TP, Nagajyothi F, Mukherjee S, et al. The adipocyte as an important target cell for Trypanosoma cruzi infection. J Biol Chem. 2005;280:24085–94. doi: 10.1074/jbc.M412802200. [DOI] [PubMed] [Google Scholar]
- Rangel-Moreno J, Moyron-Quiroz JE, Carragher DM, Kusser K, Hartson L, Moquin A, Randall TD. Omental milky spots develop in the absence of lymphoid tissue-inducer cells and support B and T cell responses to peritoneal antigens. Immunity. 2009;30:731–43. doi: 10.1016/j.immuni.2009.03.014. [DOI] [PMC free article] [PubMed] [Google Scholar]
- Collantes-Fernandez E, Lopez-Perez I, Alvarez-Garcia G, Ortega-Mora LM. Temporal distribution and parasite load kinetics in blood and tissues during Neospora caninum infection in mice. Infect Immun. 2006;74:2491–4. doi: 10.1128/IAI.74.4.2491-2494.2006. [DOI] [PMC free article] [PubMed] [Google Scholar]
- Sica A, Mantovani A. Macrophage plasticity and polarization: in vivo veritas. J Clin Invest. 2012;122:787–95. doi: 10.1172/JCI59643. [DOI] [PMC free article] [PubMed] [Google Scholar]
- Abe C, Tanaka S, Ihara F, Nishikawa Y. Macrophage depletion prior to Neospora caninum infection results in severe neosporosis in mice. Clin Vaccine Immunol. 2014;21:1185–8. doi: 10.1128/CVI.00082-14. [DOI] [PMC free article] [PubMed] [Google Scholar]
- Flynn RJ, Marshall ES. Parasite limiting macrophages promote IL-17 secretion in naive bovine CD4+ T-cells during Neospora caninum infection. Vet Immunol Immunopathol. 2011;144:423–9. doi: 10.1016/j.vetimm.2011.09.008. [DOI] [PubMed] [Google Scholar]
- Tanaka T, Nagasawa H, Fujisaki K, Suzuki N, Mikami T. Growth-inhibitory effects of interferon-γ on Neospora caninum in murine macrophages by a nitric oxide mechanism. Parasitol Res. 2000;86:768–71. doi: 10.1007/s004360000242. [DOI] [PubMed] [Google Scholar]
- Mitchell AJ, Pradel LC, Chasson L, Van Rooijen N, Grau GE, Hunt NH, Chimini G. Technical advance: autofluorescence as a tool for myeloid cell analysis. J Leukoc Biol. 2010;88:597–603. doi: 10.1189/jlb.0310184. [DOI] [PubMed] [Google Scholar]
- Fujisaka S, Usui I, Bukhari A, et al. Regulatory mechanisms for adipose tissue M1 and M2 macrophages in diet-induced obese mice. Diabetes. 2009;58:2574–82. doi: 10.2337/db08-1475. [DOI] [PMC free article] [PubMed] [Google Scholar]
- Lazarevic V, Glimcher LH, Lord GM. T-bet: a bridge between innate and adaptive immunity. Nat Rev Immunol. 2013;13:777–89. doi: 10.1038/nri3536. [DOI] [PMC free article] [PubMed] [Google Scholar]
- Correia A, Ferreirinha P, Costa AA, et al. Mucosal and systemic T cell response in mice intragastrically infected with Neospora caninum tachyzoites. Vet Res. 2013;44:69. doi: 10.1186/1297-9716-44-69. [DOI] [PMC free article] [PubMed] [Google Scholar]
- Cipolletta D, Feuerer M, Li A, Kamei N, Lee J, Shoelson SE, Benoist C, Mathis D. PPAR-γ is a major driver of the accumulation and phenotype of adipose tissue Treg cells. Nature. 2012;486:549–53. doi: 10.1038/nature11132. [DOI] [PMC free article] [PubMed] [Google Scholar]
- Koch MA, Tucker-Heard G, Perdue NR, Killebrew JR, Urdahl KB, Campbell DJ. The transcription factor T-bet controls regulatory T cell homeostasis and function during type 1 inflammation. Nat Immunol. 2009;10:595–602. doi: 10.1038/ni.1731. [DOI] [PMC free article] [PubMed] [Google Scholar]
- Lord GM, Matarese G, Howard JK, Baker RJ, Bloom SR, Lechler RI. Leptin modulates the T-cell immune response and reverses starvation-induced immunosuppression. Nature. 1998;394:897–901. doi: 10.1038/29795. [DOI] [PubMed] [Google Scholar]
- Amano SU, Cohen JL, Vangala P, et al. Local proliferation of macrophages contributes to obesity-associated adipose tissue inflammation. Cell Metab. 2014;19:162–71. doi: 10.1016/j.cmet.2013.11.017. [DOI] [PMC free article] [PubMed] [Google Scholar]
- Oh DY, Morinaga H, Talukdar S, Bae EJ, Olefsky JM. Increased macrophage migration into adipose tissue in obese mice. Diabetes. 2012;61:346–54. doi: 10.2337/db11-0860. [DOI] [PMC free article] [PubMed] [Google Scholar]
- Mineo TW, Oliveira CJ, Silva DA, et al. Neospora caninum excreted/secreted antigens trigger CC-chemokine receptor 5-dependent cell migration. Int J Parasitol. 2010;40:797–805. doi: 10.1016/j.ijpara.2009.12.003. [DOI] [PubMed] [Google Scholar]
- El Kasmi KC, Qualls JE, Pesce JT, et al. Toll-like receptor-induced arginase 1 in macrophages thwarts effective immunity against intracellular pathogens. Nat Immunol. 2008;9:1399–406. doi: 10.1038/ni.1671. [DOI] [PMC free article] [PubMed] [Google Scholar]
- Ritter DM, Kerlin R, Sibert G, Brake D. Immune factors influencing the course of infection with Neospora caninum in the murine host. J Parasitol. 2002;88:271–80. doi: 10.1645/0022-3395(2002)088[0271:IFITCO]2.0.CO;2. [DOI] [PubMed] [Google Scholar]
- Morris DL, Cho KW, Delproposto JL, Oatmen KE, Geletka LM, Martinez-Santibanez G, Singer K, Lumeng CN. Adipose tissue macrophages function as antigen-presenting cells and regulate adipose tissue CD4+ T cells in mice. Diabetes. 2013;62:2762–72. doi: 10.2337/db12-1404. [DOI] [PMC free article] [PubMed] [Google Scholar]
- Dion S, Germon S, Guiton R, Ducournau C, Dimier-Poisson I. Functional activation of T cells by dendritic cells and macrophages exposed to the intracellular parasite Neospora caninum. Int J Parasitol. 2011;41:685–95. doi: 10.1016/j.ijpara.2011.01.008. [DOI] [PubMed] [Google Scholar]
- Nishikawa Y, Tragoolpua K, Inoue N, Makala L, Nagasawa H, Otsuka H, Mikami T. In the absence of endogenous γ interferon, mice acutely infected with Neospora caninum succumb to a lethal immune response characterized by inactivation of peritoneal macrophages. Clin Diagn Lab Immunol. 2001;8:811–6. doi: 10.1128/CDLI.8.4.811-817.2001. [DOI] [PMC free article] [PubMed] [Google Scholar]
- Belkaid Y, Tarbell K. Regulatory T cells in the control of host-microorganism interactions (*) Annu Rev Immunol. 2009;27:551–89. doi: 10.1146/annurev.immunol.021908.132723. [DOI] [PubMed] [Google Scholar]
- Halaas JL, Gajiwala KS, Maffei M, et al. Weight-reducing effects of the plasma protein encoded by the obese gene. Science. 1995;269:543–6. doi: 10.1126/science.7624777. [DOI] [PubMed] [Google Scholar]
- Havel PJ. Role of adipose tissue in body-weight regulation: mechanisms regulating leptin production and energy balance. Proc Nutr Soc. 2000;59:359–71. doi: 10.1017/s0029665100000410. [DOI] [PubMed] [Google Scholar]
- White SJ, Taylor MJ, Hurt RT, Jensen MD, Poland GA. Leptin-based adjuvants: an innovative approach to improve vaccine response. Vaccine. 2013;31:1666–72. doi: 10.1016/j.vaccine.2013.01.032. [DOI] [PMC free article] [PubMed] [Google Scholar]
- Van Heek M, Compton DS, France CF, et al. Diet-induced obese mice develop peripheral, but not central, resistance to leptin. J Clin Invest. 1997;99:385–90. doi: 10.1172/JCI119171. [DOI] [PMC free article] [PubMed] [Google Scholar]
- Polotsky VY, Wilson JA, Smaldone MC, et al. Female gender exacerbates respiratory depression in leptin-deficient obesity. Am J Respir Crit Care Med. 2001;164:1470–5. doi: 10.1164/ajrccm.164.8.2101100. [DOI] [PubMed] [Google Scholar]
- Kentish SJ, O'Donnell TA, Frisby CL, Li H, Wittert GA, Page AJ. Altered gastric vagal mechanosensitivity in diet-induced obesity persists on return to normal chow and is accompanied by increased food intake. Int J Obes (Lond) 2014;38:636–42. doi: 10.1038/ijo.2013.138. [DOI] [PubMed] [Google Scholar]
- Terauchi Y, Matsui J, Kamon J, et al. Increased serum leptin protects from adiposity despite the increased glucose uptake in white adipose tissue in mice lacking p85α phosphoinositide 3-kinase. Diabetes. 2004;53:2261–70. doi: 10.2337/diabetes.53.9.2261. [DOI] [PubMed] [Google Scholar]
- Bado A, Levasseur S, Attoub S, et al. The stomach is a source of leptin. Nature. 1998;394:790–3. doi: 10.1038/29547. [DOI] [PubMed] [Google Scholar]
- Wang J, Liu R, Hawkins M, Barzilai N, Rossetti L. A nutrient-sensing pathway regulates leptin gene expression in muscle and fat. Nature. 1998;393:684–8. doi: 10.1038/31474. [DOI] [PubMed] [Google Scholar]
- Peters M, Lutkefels E, Heckeroth AR, Schares G. Immunohistochemical and ultrastructural evidence for Neospora caninum tissue cysts in skeletal muscles of naturally infected dogs and cattle. Int J Parasitol. 2001;31:1144–8. doi: 10.1016/s0020-7519(01)00221-1. [DOI] [PubMed] [Google Scholar]
- De Rosa V, Procaccini C, Cali G, Pirozzi G, Fontana S, Zappacosta S, La Cava A, Matarese G. A key role of leptin in the control of regulatory T cell proliferation. Immunity. 2007;26:241–55. doi: 10.1016/j.immuni.2007.01.011. [DOI] [PubMed] [Google Scholar]
- Reeves GM, Mazaheri S, Snitker S, et al. A positive association between T. gondii seropositivity and obesity. Front Public Health. 2013;1:73. doi: 10.3389/fpubh.2013.00073. [DOI] [PMC free article] [PubMed] [Google Scholar]
- Baltaci AK, Mogulkoc R. Plasma leptin levels in rats with induced Toxoplasma gondii infection. Bratisl Lek Listy. 2012;113:67–9. doi: 10.4149/bll_2012_016. [DOI] [PubMed] [Google Scholar]
Associated Data
This section collects any data citations, data availability statements, or supplementary materials included in this article.
Supplementary Materials
Figure S1. Inflammatory infiltrates in the adipose tissue of Neospora caninum-infected mice.
Figure S2. T helper type 1 cells and regulatory T cells are increased in the adipose tissue of Neospora caninum-infected mice.
Figure S3. Increased numbers of Foxp3+ cells in the adipose tissue of the infected mice.