

Abstract
Macrophages play important roles in the innate immune system during infection and systemic inflammation. When bacterial lipopolysaccharide (LPS) binds to Toll-like receptor 4 on macrophages, several signalling cascades co-operatively up-regulate gene expression of inflammatory molecules. The present study aimed to examine whether salt-inducible kinase [SIK, a member of the AMP-activated protein kinase (AMPK) family] could contribute to the regulation of immune signal not only in cultured macrophages, but also in vivo. LPS up-regulated SIK3 expression in murine RAW264.7 macrophages and exogenously over-expressed SIK3 negatively regulated the expression of inflammatory molecules [interleukin-6 (IL-6), nitric oxide (NO) and IL-12p40] in RAW264.7 macrophages. Conversely, these inflammatory molecule levels were up-regulated in SIK3-deficient thioglycollate-elicited peritoneal macrophages (TEPM), despite no impairment of the classical signalling cascades. Forced expression of SIK3 in SIK3-deficient TEPM suppressed the levels of the above-mentioned inflammatory molecules. LPS injection (10 mg/kg) led to the death of all SIK3-knockout (KO) mice within 48 hr after treatment, whereas only one mouse died in the SIK1-KO (n = 8), SIK2-KO (n = 9) and wild-type (n = 8 or 9) groups. In addition, SIK3-KO bone marrow transplantation increased LPS sensitivity of the recipient wild-type mice, which was accompanied by an increased level of circulating IL-6. These results suggest that SIK3 is a unique negative regulator that suppresses inflammatory molecule gene expression in LPS-stimulated macrophages.
Keywords: AMP-activated protein kinase, endotoxin shock, interleukin-12p40, interleukin-1β, interleukin-6, inducible nitric oxide synthase, macrophage, salt-inducible kinases, tumour necrosis factor-α
Introduction
Macrophages play a critical role in the innate immune system during infection and systemic inflammation.1 They produce pro-inflammatory cytokines such as tumour necrosis factor-α (TNF-α), interleukin-6 (IL-6) and IL-12 through recognition of bacterial components via Toll-like receptors (TLRs). Lipopolysaccharide (LPS; a cell-wall component of Gram-negative bacteria) is the ligand for TLR4.2,3 When LPS binds to TLR4, its adaptor protein, the myeloid differentiation factor (MyD)88, recruits and activates IL-1 receptor-associated kinase family proteins,4,5 which is followed by the activation of the transforming growth factor-β-activated kinase 1 (TAK1). The active TAK then transmits the signal through different pathways such as those involving the IκB kinase (IKK) family (IκBα-nuclear factor-κB) and the mitogen-activated protein kinases [MAPKs: extracellular signal-regulated kinase (ERK), p38, and c-Jun N-terminal kinase (JNK)]. TAK1 phosphorylates MAPK kinases (MKKs) and induces the activation of MAPKs.6–8
These MyD88-dependent cascades are initiated at an immediate early phase. In contrast, interferon-β-producing cascades such as those involving the interferon regulatory factor 3 (IRF3) and the signal transducer and activator of transcription (STAT1) are activated by the MyD88-independent and Toll interleukin receptor-domain-containing adapter-inducing interferon-β-dependent pathways, which contributes to the late activation of nuclear factor-κB.3,4,9–11 The gene expression of nitric oxide (NO) synthase 2 (Nos2 or inducible NOS; iNOS), which produces the inflammatory mediator NO, is also induced by active STAT1.12,13
Macrophages produce not only pro-inflammatory cytokines, but also anti-inflammatory cytokines. Macrophages are classified into two types, according to their pro-inflammatory or anti-inflammatory functions, classically activated macrophages (M1 macrophages) and alternatively activated macrophages (M2 macrophages), respectively. M2 macrophages are further classified into M2a, M2b, M2c, M2d14 and M2b macrophages (also called regulatory macrophages) and produce anti-inflammatory cytokines such as IL-10.15
Salt-inducible kinase (SIK) is a member of the AMP-activated protein kinase (AMPK) family and plays a role in the regulation of glucose and lipid metabolism.16,17 SIKs regulate the expression of several genes via the cAMP response element-binding protein (CREB) and myocyte enhancer factor 2 (MEF-2) transcription factors. The former is inhibited by SIKs via the phosphorylation-dependent inactivation of CREB-regulated transcription co-activators (CRTCs), which are CREB-specific co-activators18–20 and the latter is activated via phosphorylation-dependent inactivation of class IIa histone deacetylases (HDAC), which act as co-repressors for MEF-2.21,22 Both CRTCs and class IIa HDACs are sensitive to the cAMP–protein kinase A and calcineurin (phosphatase) cascades in which protein kinase A inactivates SIKs and calcineurin reactivates CRTCs and class IIa HDACs.19
Recently, SIK inhibitors were reported to polarize macrophages toward the M2b type through IL-10 production in a CRTC3-dependent manner.23,24 On the other hand, Yong Kim et al.25 reported that SIK1 and SIK3 negatively regulate TLR4-mediated signalling through interruption of the TAK1-binding protein (TAB)2–TNF receptor-associated factor (TRAF)6 complex by the inhibition of ubiquitination-dependent TRAF6 degradation. These reports suggest that SIKs play important roles in the inflammation and innate immune systems in cultured macrophages. However, the involvement of SIKs in inflammation in vivo, except for that in liver inflammation, cholestasis and cholelithiasis in SIK3-knockout (KO) mice,26 remains unclear.
Here, we found that SIK3-KO mice, but not SIK1-KO and SIK2-KO mice, were highly sensitive to LPS and that SIK3-deficient macrophages produced increased levels of the inflammatory molecules, iNOS, IL-6 and IL-12p40 without any significant difference in the classical immune cascades. Moreover, adoptive transfer of SIK3-KO-bone marrow (SIK3-KO-BM) to X-ray-irradiated wild-type (WT) mice also increased LPS sensitivity in these mice.
Materials and methods
Mice
Age- and sex-matched littermates of SIK1-KO (C57BL6/J × 129 background), SIK2-KO and SIK3-KO (C57BL6/J background) mice described previously26–28 were used in this study. For bone marrow transplantation, 8-week-old male C57BL6/J mice (Japan SLC, Hamamatsu, Japan) were used. All animal experiments were conducted according to the institutional ethical guidelines for animal experimentation of the National Institute of Biomedical Innovation (approved as nos. DS20-56, DS24-41 and DS26-86).
Cell culture
The murine RAW264.7 monocytic/macrophage cell line was obtained from the American Type Culture Collection (Manassas, VA). The cells were cultured in RPMI-1640 medium (Wako, Osaka, Japan) supplemented with 10% heat-inactivated fetal bovine serum (FBS) (Life Technologies, Carlsbad, CA). The isolation of mouse thioglycollate-elicited peritoneal macrophages (TEPM) is described elsewhere.29 Briefly, 10- to 16-week-old mice were injected with 2 ml of 4% (w/v) Brewer's thioglycollate medium (BD Biosciences, San Diego, CA). Three or four days after the injection, the mice were killed by cervical dislocation under deep anaesthesia with isoflurane and their peritoneal macrophages were harvested by lavage with ice-cold PBS. The lavage fluid was transferred into polypropylene tubes, centrifuged at 370 g for 10 min, and the peritoneal macrophages were seeded at a density of 5.0 × 10⁵ cells/cm2. The non-adherent cells were washed out twice with PBS warmed at 37° and then cultivated in 10% FBS/RPMI-1640.
Real-time quantitative reverse transcription PCR
Total RNA was prepared using the ReliaPrep™ RNA Cell Miniprep System (Promega, Madison, WI), according to the manufacturer's instructions. Complementary DNA was synthesized by reverse transcription (RT) of 1 μg of total RNA by using the ReverTra Ace® qPCR RT Kit (Toyobo, Osaka, Japan) and used for quantitative PCR. The primers used in this study are listed in the Supporting information (Table S1).
Lentiviral transduction of SIK3 in RAW264.7 cells
The stable RAW264.7 line that over-expressed SIK3 was transduced using the ViraPower™ HiPerform™ Promoterless Gateway® Expression System (Life Technologies), according to the manufacturer's protocol. Briefly, the mouse Sik3 (mSIK3) open reading frame was amplified by PCR with primers containing attB1/2 sequences, and the PCR product was cloned into the pDONR221 plasmid with BP clonase (Life Technologies). The mSIK3 open reading frame and the cytomegalovirus (CMV) promoter that was cloned into the pENTR plasmid were transferred into the plenti6.4-R4R2-DEST plasmid for preparing the lentiviral vector through the LR reaction. pLP1, pLP2, pLP-VSVG and plenti6.4-CMV-mSIK3 or -LacZ (control) were transformed into 293FT cells using the calcium phosphate method.30 After 72 hr of transformation, the supernatant containing lentiviruses was collected and viral particles were purified using the Lenti-X™ Concentrator (Clontech, Mountain View, CA), according to the manufacturer's protocol. RAW264.7 cells were infected with lentiviruses, and the infected cells were selected by 10 μg/ml blasticidin (Santa Cruz Inc., Santa Cruz, CA) for 10 days.
Adenoviral transduction of SIK3 in thioglycollate-elicited mouse peritoneal macrophages
Adenoviral expression vectors for Lac Z, human SIK3 (hSIK3)-WT, and hSIK3-K37M mutant (kinase inactive form) were previously described.31 The amplified adenoviruses were purified using Fast-Trap® Virus Purification and Concentration Kit (Millipore, Billerica, MA) according to the manufacturer's protocol. Thioglycollate-elicited mouse peritoneal macrophages isolated from SIK3-KO or WT mice were infected with adenoviruses (at a multiplicity of infection of 250) for 1 hr. After infection, the cells were washed with serum-free RPMI-1640 medium twice and incubated with 5% FBS/RPMI-1640 for 2 days.
Western blotting
The cells were washed three times with ice-cold PBS and lysed with the 1 × SDS buffer (50 mm Tris–HCl, 10% glycerol, 2% SDS; pH 6.8) without bromophenol blue. After measurement of protein concentration using Bicinchoninic acid (BCA) Protein Assay reagents (Thermo Scientific, Waltham, MA), the lysates were diluted with a one-third volume of 3 × SDS buffer supplemented with 10% 2-mercaptoethanol and bromophenol blue and heated at 100° for 5 min. Proteins (5–15 μg) were separated by SDS–PAGE and electrophoretically transferred onto PVDF membranes. The membranes were blocked with the Blocking One solution (Nacalai Tesque, Kyoto, Japan) and incubated with the following antibodies at 4° overnight: anti-SIK3 (1 : 2000; as per the method described earlier31), anti-α/β-tubulin (1 : 3000; #2148), anti-phospho-IKKα/β (1 : 1000; #2697), anti-IKKα/β (1 : 2000; sc-7607), anti-phospho-IκBα (1 : 1000; #2859), anti-IκBα (1 : 1000; #4812), anti-phospho-ERK (1 : 2000; #4376), anti-ERK (1 : 2000; #4695), anti-phospho-p38 (1 : 2000; #9215), anti-p38 (1 : 2000; #9212), anti-phospho-JNK (1 : 1000; #9251), anti-JNK (1 : 1000; #9252), anti-iNOS (1 : 500; sc-7271), anti-phospho-(pY701)-STAT1 (1 : 2000; #7649), anti-STAT1 (1 : 3000; #9172), anti-phospho-IRF3 (1 : 1000; #4947), anti-IRF3 (1 : 1000; #4302), or anti-β-actin (1 : 1000; sc-47778). Except for anti-IKKα/β, anti-iNOS, and anti-β-actin antibodies, which were purchased from Santa Cruz Biotechnology, all other antibodies were purchased from Cell Signaling Technology (Danvers, MA). Next, the membranes were incubated with an anti-rabbit horseradish peroxidase-conjugated goat antibody (111-035-144; Jackson ImmunoResearch Laboratory, West Grove, PA) or an anti-mouse horseradish peroxidase-conjugated goat antibody (1 : 10 000; 115-035-166; Jackson ImmunoResearch Laboratory) for 1 hr. The Chemi-Lumi One Super solution (Nacalai Tesque) was used for the detection of immune complexes.
Bone marrow transplantation
Bone marrow cells were prepared from the femur, tibia, humerus and pelvis of WT or SIK3-KO mice. Recipient mice were irradiated with X-ray (7 Gy). The cells (1 × 10⁷ cells/head) were intravenously injected in the tail vein of irradiated recipient mice. Eight weeks after the transplantation, the recipient mice were used for experiments.
LPS-induced endotoxin shock model
Lipopolysaccharide (10 mg/kg body weight; derived from O111 Escherichia coli; phenol-extracted, Wako) dissolved in PBS was injected intraperitoneally into 14-week-old mice. Blood was collected from a small cut on the tail, and serum was separated by centrifugation at 1000 g for 10 min, collected into tubes, and stored at −40° until analysis.
Measurement of cytokine production by ELISA
The cytokine levels in media containing LPS-stimulated mouse peritoneal macrophages or RAW264.7 cells were quantified by ELISA with the ELISA MAX™ Deluxe (BioLegend, San Diego, CA), as per the manufacturer's instructions. The cytokine levels were normalized to those of cellular protein measured by using the BCA Protein Assay Kit (Thermo Scientific).
Measurement of NO production
Griess reagent (0.05% naphthylethylenediamine dihydrochloride, 0.5% sulphonylamide and 2.5% phosphoric acid) was prepared and stored at 4° in the dark. Media from LPS-stimulated mouse TEPM or RAW264.7 cells were collected into fresh tubes and then mixed with Griess reagent at a 1 : 1 ratio in a 96-well plate. Absorbance was measured spectrophotometrically at 550 nm. Concentration of NO was normalized to the cellular protein concentration measured by using the BCA Protein Assay Kit (Thermo Scientific).
Statistical analyses
For all experiments, data are expressed as mean ± standard error of the mean (SEM), with at least three repeats for each experimental group. Statistical analyses were performed using the Student's t-test or two-way analysis of variance followed by Bonferroni's post-tests for the comparison of gene expression and cytokine secretion. The Cox–Mantel test was used to analyse the Kaplan–Meier curve for mouse survival.
Results
Increase in SIK3 mRNA level after LPS treatment in RAW264.7 macrophages
According to recent studies using SIK inhibitors and RNA interference techniques,23,25 all SIK isoforms contribute to inflammatory responses in macrophages. However, information regarding the expression of each SIK isoform in macrophages is limited. To measure the expression of SIK family kinases in macrophages, RAW264.7 cells were stimulated with LPS (Fig.1). Sixteen hours after LPS treatment, the mRNA level of SIK3, but not SIK1 or SIK2, was significantly up-regulated in RAW264.7 macrophages treated with 10, 100 and 1000 ng/ml LPS (Fig.1a). We also examined the time-dependent change of SIK isoform mRNA levels after LPS (100 ng/ml) stimulation (Fig.1b). The SIK3 mRNA level hovered at a high level of expression compared with that observed in the control (only medium replacement), from 4 to 16 hr after LPS stimulation. A small, or less, difference in SIK1 or SIK2 mRNA level was observed between LPS stimulation and control (two-way analysis of variance followed by Bonferroni's post-test suggested a significance in SIK2 mRNA at the 4 hr-point).
Figure 1.
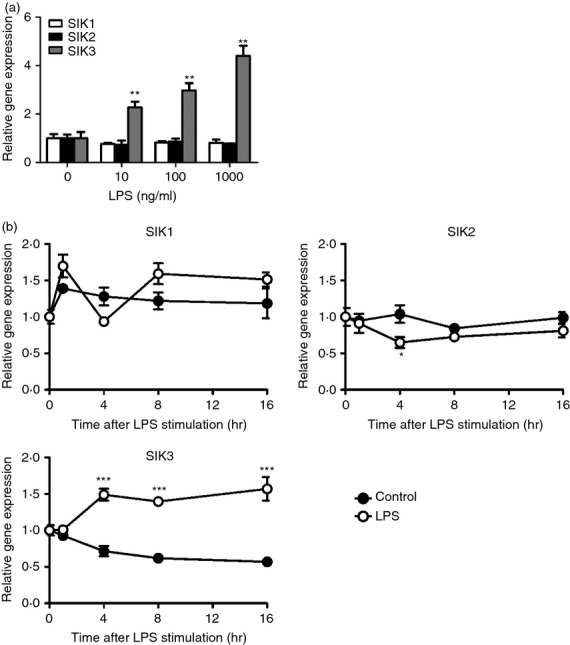
Salt-inducible kinase (SIK) family kinase gene expression levels in RAW264.7 cells after lipopolysaccharide (LPS) treatment. (a) RAW264.7 cells (1.5 × 10⁵ cells/cm2) were stimulated with the indicated dose of LPS for 16 hr. (b) RAW264.7 cells were stimulated with 100 ng/ml LPS and harvested at the indicated time-points. After total RNA isolation, the mRNA levels of SIK1, SIK2 and SIK3 were analysed by quantitative PCR. Hypoxanthine-guanine phosphoribosyltransferase (HPRT) was used as an internal control. The data are expressed as mean ± SEM (n = 3). Statistical analyses were performed using the Student's t-test (a) or two-way analysis of variance followed by Bonferroni's post-tests (b) for the comparison of gene expression. *P < 0.05, **P < 0.01, ***P < 0.001.
SIK3 over-expression suppresses inflammatory molecule expression
To examine whether the different level of SIK3 expression affects the levels of pro-inflammatory or anti-inflammatory molecules after LPS stimulation, we prepared mouse SIK3 (mSIK3) over-expressing RAW264.7 macrophages using lentiviruses. Western blotting revealed that SIK3 protein level in mSIK3 over-expressing cells was higher than that in the control cells (Lac Z) (Fig.2a). Suppressed mRNA levels of IL-6, iNOS and IL-12p40 were observed after LPS stimulation (Fig.2b). However, no significant difference in TNF-α and IL-1β mRNA levels was observed between the control and mSIK3 over-expressing cells. On the other hand, 1 hr after LPS stimulation, IL-10 mRNA levels were also lower in mSIK3 over-expressed RAW264.7 macrophages than in LacZ-control.
Figure 2.
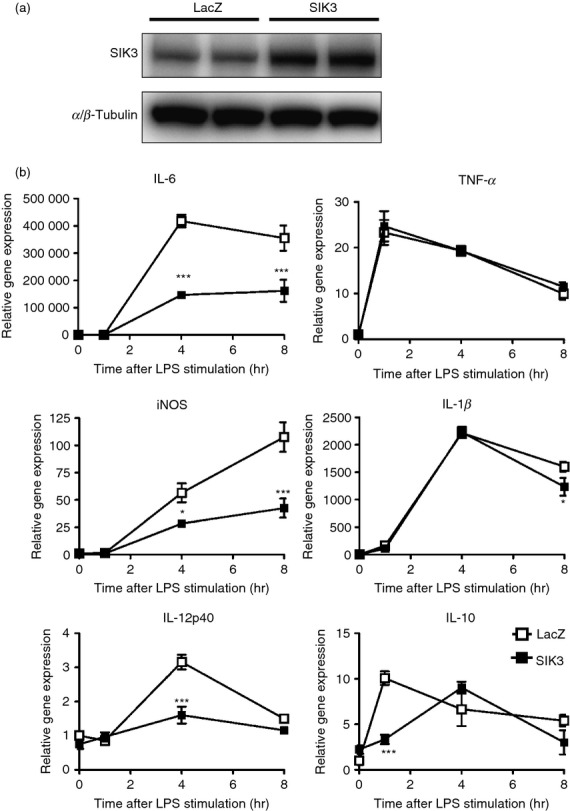
Effect of salt-inducible kinase 3 (SIK3) over-expression on pro-inflammatory molecule mRNA levels in RAW264.7 macrophages. (a) Western blotting confirmed murine SIK3 (mSIK3) protein over-expression in lentiviral-transduced RAW264.7 cells. (b) LacZ (control) and mSIK3 over-expressing RAW264.7 cells were stimulated with lipopolysaccharide (LPS; 100 ng/ml) and the cells were harvested at the indicated time-points. The mRNA levels of pro-inflammatory molecules [interleukin-6 (IL-6), inducible nitric oxide synthase (iNOS), IL-12p40, tumour necrosis factor-α (TNF-α), IL-1β, and IL-10] were analysed by quantitative PCR. Hypoxanthine-guanine phosphoribosyltransferase (HPRT) was used as an internal control. The data are expressed as mean ± SEM (n = 3). Statistical analyses were performed using two-way analysis of variance followed by Bonferroni's post-tests for the comparison of gene expression.*P < 0.05, **P < 0.01, ***P < 0.001.
SIK3-deficient macrophages produce high levels of inflammatory molecules
Next, we examined the effects of SIK3 deficiency on the levels of inflammatory molecules. Because the RNA interference technique was not successful for SIK3 in our laboratory, we prepared TEPM from SIK3-KO and WT mice. In contrast to the findings in mSIK3 over-expressed RAW264.7 macrophages, after 4 hr of LPS stimulation, the mRNA levels of IL-6, iNOS and IL-12p40 were higher in SIK3-KO TEPM than in WT TEPM (Fig.3a). In addition, no significant difference was observed in TNF-α or IL-1β expression levels between SIK3-KO and WT TEPM. These results suggested that the molecules whose expression was regulated by SIK3 are restricted to the secondary genes that were not fully induced at 1 hr after LPS stimulation. On the other hand, IL-10 mRNA level was also higher in SIK3-KO TEPM than in WT TEPM at 1 hr after LPS stimulation, suggesting that the increase in the expression of secondary genes in SIK3-KO TEPM might be out of the control of, or independent of, the IL-10 altered expression.
Figure 3.

Gene expression and production of pro-inflammatory molecules in salt-inducible kinase 3 (SIK3) -deficient peritoneal macrophages. (a) Thioglycollate-elicited peritoneal macrophages (TEPM) were isolated from SIK3 knockout (-KO) and wild-type (WT) mice and then stimulated with 100 ng/ml lipopolysaccharide (LPS). The cells were then harvested at the indicated time-points for gene expression analyses of pro-inflammatory molecules [interleukin-6 (IL-6), inducible nitric oxide synthase (iNOS), IL-12p40, tumour necrosis factor-α (TNF-α) and IL-1β). Hypoxanthine-guanine phosphoribosyltransferase (HPRT) was used as an internal control. (b) Supernatants from LPS-stimulated peritoneal macrophages isolated from SIK3-KO and WT mice were harvested at 4 hr after LPS stimulation. IL-6, TNF-α, and IL-10 production was then analysed by ELISA. (c) Supernatants from LPS-stimulated peritoneal macrophages isolated from SIK3-KO and WT mice were harvested at 24 hr after LPS stimulation. NO production was analysed by using Griess reagent. (d) Adenovirus-mediated supplementation of SIK3-WT, SIK3-K37M mutant (kinase-inactive), or LacZ in SIK3-KO or WT TEPM. Western blotting confirmed SIK3 protein over-expression. (e) Culture media from the TEPM that had been infected with adenoviruses (LacZ, SIK3-WT or SIK3-K37M) were harvested for IL-6 measurement at 4 hr after LPS stimulation. (f) SIK3 deficiency did not affect the MyD88-dependent Toll-like receptor 4 (TLR4) -signalling pathway. Thioglycollate-elicited peritoneal macrophages isolated from SIK3-KO or WT mice were harvested at the indicated time-points after LPS stimulation. Western blotting was performed using the indicated antibodies (listed in Materials and methods). α/β-Tubulin was used as an internal control. (g) SIK3 deficiency did not affect the MyD88-independent TLR4-signalling pathway. β-Actin was used as an internal control. The data are expressed as mean ± SEM (n = 3). Statistical analyses were performed using two-way analysis of varaince followed by Bonferroni's post-tests (a) or the Student's t-test (b, e) for the comparison of gene expression and cytokine secretion, respectively. *P < 0.05, **P < 0.01, ***P < 0.001.
In addition to mRNA quantification, we measured the production of cytokines (IL-6, TNF-α and IL-10) and NO in SIK3-KO TEPM (Fig.3b,c). After stimulation with LPS, SIK3-KO TEPM produced higher IL-6 (twofold, Fig.3b left panel) and NO (3.5-fold, Fig.3c) levels than WT TEPM. In contrast, TNF-α production in SIK3-KO TEPM was lower than that in WT TEPM (Fig.3b middle panel). Interleukin-10 production was also slightly, but clearly, higher in SIK3-KO TEPM than in WT TEPM (Fig.3b right panel). Furthermore, adenovirus-mediated SIK3 reconstitution in the SIK3-KO TEPM lowered IL-6 production to the level observed in WT TEPM (Fig.3d,e), which was not observed when a kinase-defective SIK3 (K37M mutant) was reconstituted.
The completeness of signalling cascades in the induction of inflammatory molecules was confirmed by Western blotting (Fig.3f, classified into the primary response). No significant difference was observed in IKK, IκBα and MAPK phosphorylation levels between WT and SIK3-KO TEPM after LPS stimulation. However, the JNK protein total level was lower in SIK3-KO TEPM than in WT TEPM, but phosphorylated JNK levels did not differ in these macrophages. In addition to these primary response cascades, phosphorylation levels of secondary response signal transducers such as IRF3 and STAT1 also did not differ in macrophages (Fig.3g).
In addition to SIK3-KO TEPM experiments, we prepared TEPM from SIK1-KO and SIK2-KO mice and quantified pro-inflammatory and anti-inflammatory molecule mRNA expression (see Supporting information, Fig. S1). Notably, IL-10 mRNA level was down-regulated in SIK1-KO macrophages at 1 hr after LPS stimulation (Fig. S1a), whereas it was up-regulated in SIK2-KO macrophages (Fig. S1b). Although statistical analyses showed some differences in other gene expression levels between WT and SIK1-KO or SIK2-KO TEPM, these differences (especially in the levels of secondary genes) were smaller than those between SIK3-KO TEPM and its control WT TEPM (Fig.3a).
To argue about the nature of macrophages in SIK3 signalling, we assessed the expression of pro-inflammatory and anti-inflammatory molecules in bone marrow-derived macrophages (BMDM) prepared from WT or SIK3-KO mice (see Supporting information, Fig. S2). Consistent with the results of TEPM, significant differences in IL-6 and iNOS mRNA levels between SIK3-KO and WT BMDM were observed at 4 hr after LPS stimulation. Furthermore, IL-12p40 mRNA was higher in SIK3-KO BMDM than in WT BMDM. Lower TNF-α levels and higher IL-10 levels in SIK3-KO BMDM than in WT BMDM were observed at 1 hr after LPS stimulation.
SIK3 deficiency exacerbates endotoxin shock in mice
The absence of SIK3 resulted in enhanced mRNA levels of the inflammatory molecules categorized as secondary genes. To examine the importance of SIK3 in the regulation of LPS-induced endotoxin shock in vivo, SIK1-3-KO mice were intraperitoneally injected with 10 mg/kg of LPS (Fig.4a). All SIK3-KO mice died within 48 hr of LPS injection, whereas only one mouse died in the SIK1-KO, SIK2-KO and control groups (WT, both C57BL/6 and C57BL/6 × 129 genetic backgrounds). Serum IL-6 levels in WT, SIK1-KO and SIK2-KO mice rapidly increased after LPS treatment, reached a peak at 2–4 hr, and then decreased (Fig.4b). However, a continuous increase in the serum IL-6 level in SIK3-KO mice was observed until 8 hr after LPS treatment. In all mouse groups, serum TNF-α levels rapidly reached a peak 1 hr after LPS treatment (Fig.4c). Decreased serum TNF-α level in SIK2-KO and SIK3-KO mice was observed. These results suggest that SIK3 is related to LPS sensitivity in vivo and that the dysregulation of secondary inflammatory responses in macrophages is a representative phenotype of SIK3 deficiency.
Figure 4.
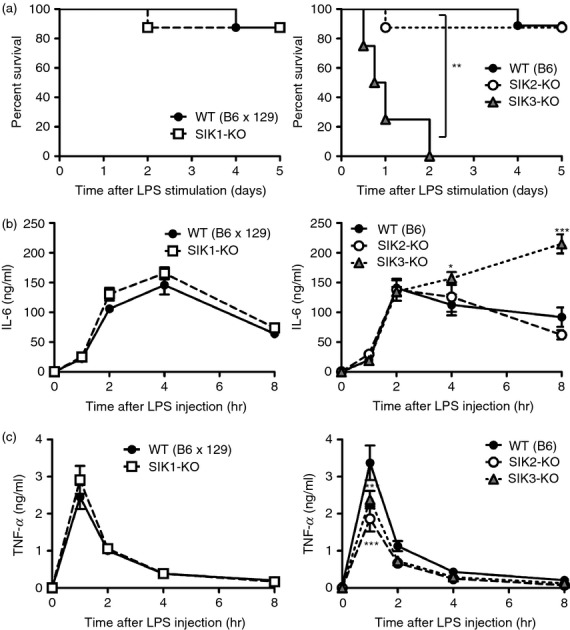
Lipopolysaccharide (LPS) -induced endotoxin shock in each salt-inducible kinase (SIK) -deficient mouse. (a) Left panel: Wild-type (WT) (B6 × 129 background) (n = 8) and SIK1 knockout (-KO) (n = 8); Right panel: WT (C57BL/6 background) (n = 9), SIK2-KO (n = 8), and SIK3-KO (n = 8) mice were injected with LPS (10 mg/kg) and the % survival was plotted. Blood was collected from the tail vein at the indicated time-points, and serum concentrations of interleukin-6 (IL-6) (b) and tumour necrosis factor-α (TNFα) (c) were determined by ELISA. The data are expressed as mean ± SEM. Statistical analyses were performed using the Cox–Mantel test (a) or two-way analysis of variance followed by Bonferroni's post-tests (b, c) for the comparison of the Kaplan–Meier curve for mouse survival and cytokine secretion, respectively. *P < 0.05, **P < 0.01, ***P < 0.001.
Transplantation of SIK3-deficient bone marrow increases LPS sensitivity
To confirm whether the increase in LPS sensitivity in SIK3-KO mice was attributed to haematopoietic cells, we prepared bone marrow haematopoietic cells from WT or SIK3-KO mice and adoptively transfer them to X-ray-irradiated WT mice. Reconstitution of SIK3-KO or WT haematopoietic cells was confirmed by PCR using genomic DNA isolated from blood or tail of these recipient mice (Fig.5a). After LPS treatment, eight out of nine mice that had been reconstituted with SIK3-KO haematopoietic cells (SIK3-KO-BM mice) died within 4 days (Fig.5b), whereas only two out of nine mice reconstituted with the control WT haematopoietic cells (WT-BM mice) died. The level of IL-6 production after LPS treatment was also higher in SIK3-KO-BM mice than in WT-BM mice (Fig.5c), but no significant difference in TNF-α level was observed (Fig.5d). These results suggested that SIK3-deficient haematopoietic cells, probably macrophages, might contribute to the increased death rate of SIK3-KO mice after LPS treatment.
Figure 5.
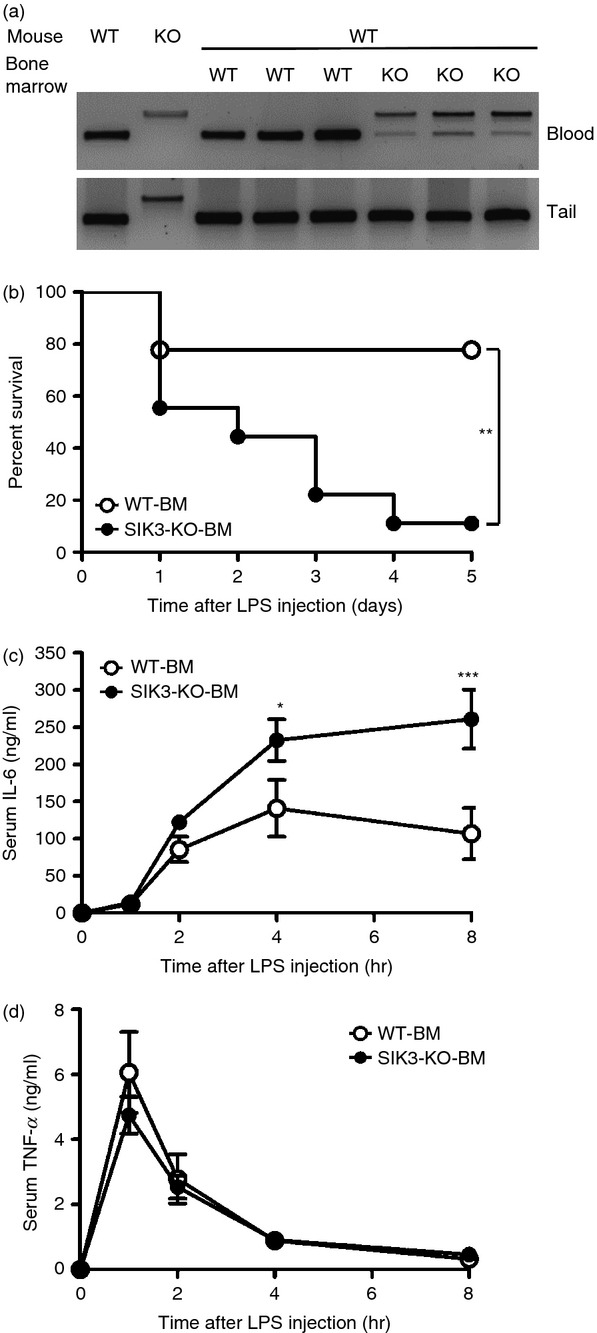
Lipopolysaccharide (LPS) -induced endotoxin shock in wild-type (WT) mice transplanted with salt-inducible kinase 3 knockout (SIK3-KO) bone marrow. (a) DNA was prepared from the blood and tails of mice subjected to bone marrow transplantation and used as the PCR template of SIK3 genotyping. (b) WT mice with SIK3-KO bone marrow (SIK3-KO-BM, n = 9) or with WT bone marrow (WT-BM, n = 9) were treated with LPS (10 mg/kg) and the % survival was plotted. Blood was collected from the tail vein at the indicated time-points, and serum concentrations of interleukin-6 (IL-6) (c) and tumour necrosis factor-α (TNF-α) (d) were determined by ELISA. The data are expressed as mean ± SEM. Statistical analyses were performed using the Cox–Mantel test (b) or two-way analysis of variance followed by Bonferroni's post-tests (c, d) for the comparison of the Kaplan–Meier curve for mouse survival and for cytokine secretion, respectively. *P < 0.05, **P < 0.01, ***P < 0.001.
Discussion
Recent studies with small compounds proposed that SIK family kinases are the signal transducers of the inflammatory response in macrophages through the regulation of CRTC–CREB systems.23,24 However, the unified direction, inflammatory or anti-inflammatory, of each SIK family kinase action remains to be established. Here, we report that SIK3 is induced by LPS in RAW264.7 macrophages and may repress mRNA expression of secondary genes encoding inflammatory molecules, IL-6, IL-12p40 and iNOS. In contrast, SIK3-KO macrophages showed high expression levels of genes that were down-regulated in SIK3 over-expressed macrophages compared with WT macrophages. Moreover, SIK3-KO mice were highly sensitive to LPS and died after LPS treatment. These phenomena were not observed in KO mice in which other SIK family genes, SIK1 and SIK2, were disrupted.
Despite statistical significance in inflammatory molecule expression between SIK3-KO and WT BMDM, the difference in BMDM was smaller than that in TEPM (see Supporting information, Fig. S2; and Fig.3a), indicating that observations on the function of SIK3 from TEPM may not be generalizable to other closely related cell types. TEPM are considered to be M1-like macrophages (pro-inflammatory),32,33 whereas BMDM are to be M2-like macrophages (anti-inflammatory)34–36 that are characterized by the robust expression of IL-10 following LPS stimulation. The observations of differently originated SIK3-KO macrophages suggest that SIK3 may function in M1-like, rather than in M2-like, macrophages. In addition, other immune compartments that affect macrophage polarization, such as T cells, also have to be considered as a cause of the high mortality of SIK3-KO mice in response to LPS.
Clark et al. reported that the TANK-binding kinase 1 inhibitor MRT67307 enhanced IL-10 secretion from bone marrow-derived macrophages after LPS stimulation. MRT67307 also up-regulated the expression of regulatory macrophage (M2b) markers (LIGHT, SPHK1 and Arg1) and down-regulated the production of inflammatory cytokines (IL-6 and TNF-α).23 The CRTC3–CREB cascade was found to be responsible for MRT67307-mediated enhancement of the Il10 promoter activity, and an in vitro kinase assay suggested AMPK-related kinases as the target of MRT67307. Further screening, modification of compounds, and testing for anti-inflammatory activities helped to identify the potent SIK inhibitors MRT199665, KIN112 and HG-9-91-01 and to determine their inhibitory spectra. Additionally, RNA interference techniques led to the conclusion that all SIK isoforms might play a role in the pro-inflammatory cascades of macrophages via suppression of IL-10 gene expression.23 The same conclusion was drawn for prostaglandin E2 or cAMP stimulation in macrophages in a related study.24 It is not clear why the authors chose only SIK2 to demonstrate SIK-mediated repression of IL-10 production in macrophages. The results obtained with our SIK2-KO mice supported the same conclusion. SIK2-KO mice secreted a lower level of TNF-α after LPS treatment than WT mice did. However, serum IL-6 levels did not differ significantly between SIK2-KO and WT mice. In contrast to the results obtained in experiments in vivo, enhanced IL-10 mRNA expression accompanied by suppressed iNOS mRNA levels were observed in SIK2-KO TEPM after LPS stimulation, whereas no significant change in TNF-α or IL-6 mRNA level was observed (Fig. S2), suggesting that SIK2 may play a role in pro-inflammatory cascades. These contradictions between observations from KO mice and cultured macrophages may be the result of differences in the experimental conditions and unknown systemic factors that may have offset the pro-inflammatory functions of SIK2 in vivo.
In contrast to the SIK2 findings, Yong Kim et al.25 also reported that over-expression of SIK1 and SIK3 resulted in the suppression of TLR4 signalling in RAW264.7 macrophages. They proposed that SIK1 and SIK3 inhibited TLR4 signalling not only through IKK-mediated nuclear factor-κB signalling, but also through p38- and JNK-mediated signalling via an interruption with the TAB2–TRAF6 complex, thereby inhibiting TRAF6 ubiquitination. However, in our study, the SIK1-KO mice or macrophages did not show altered sensitivity to LPS, and, at least in SIK3-KO macrophages, no significant difference was observed in the phosphorylation levels of p38, JNK, IKK or IκBα, the downstream components of TAB2–TRAF6 (Fig.3f). These results again highlight the different experimental conditions. However, in our experiments using an SIK deficiency animal model, SIK3 was the indispensable kinase among the SIK family with regard to regulation of the inflammatory response in macrophages.
Histone deacetylases are modulators of inflammatory cascades in macrophages and class IIa HDACs (HDAC4, HDAC5, HDAC7, and HDAC9) are the substrates of SIK.21,22 A recent study indicates that the depletion of the class IIa HDAC4 in macrophages also exacerbated LPS-induced endotoxin shock, and that the inhibition of SIK or LKB1, which is an upstream kinase of SIK, led to the deacetylation of p65 by HDAC4 and the reduction of its recruitment to the TNFα and IL-12β promoters.37 In addition, the class IIa HDACs use HDAC3 (a class I HDAC) to repress target gene transcription by forming a repressor complex on promoters.38,39 Chen et al. demonstrated that HDAC3 deficiency in macrophages resulted in the suppression of LPS-induced IL-6 and iNOS expression through the inhibition of the MyD88-independent IRF3–IFN-β–STAT1 signalling pathway.15 Class I HDACs are also known to deacetylate MAPK phosphatase-1 (MKP-1), which dephosphorylates p38 and inhibits downstream signalling40–42 Deacetylation of MKP-1 protein by class I HDACs inhibits its phosphatase activity and stimulates p38 phosphorylation in LPS-stimulated macrophages.41,42 In addition, the pan-HDAC inhibitor trichostatin A (TsA) inhibits pro-inflammatory cytokine gene expression in macrophages after LPS treatment,26 which could be due to inhibition of MKP-1.40,43 Furthermore, Serrat et al.43 indicated that TsA especially affected secondary genes such as those encoding IL-6 and iNOS. These observations suggest the relevance of SIK3 in HDAC-mediated response to LPS. However, we could not show any supportive results that indicate a relationship between HDACs, either class I or IIa, and the enhanced expression of secondary genes in SIK3-deficient macrophages (data not shown).
In conclusion, we found that SIK3 deficiency, but not SIK1 or SIK2 deficiencies, exacerbate endotoxin shock induced by LPS in mice. The increased sensitivity to LPS in SIK3-KO mice was caused by SIK3-deficiency in haematopoietic cells, supposedly in macrophages. Although the involvement of SIK family kinases in the innate immune system has been suggested in cultured macrophages, this study is the first to show the importance of SIKs in vivo and indicates that SIK3 plays an important role in anti-inflammatory cascades in LPS-stimulated macrophages. However, it was also true that the strong induction of secondary genes by LPS in SIK3-KO TEPM was not fully reproduced in BMDM despite the presence of statistical significance, suggesting contributions of other cell types to the SIK3-deficient phenotypes. Further studies will be needed to evaluate functions of SIKs during inflammation.
Acknowledgments
MS, TeN and HT designed the research. MS and HT wrote the paper. MS, MF, TO, TaN, YI, AK, MK, HF, JK and HT performed the experiments. We thank Ms Tomoko Onishi for her technical assistance and Dr Alejandro M. Bertorello (Karolinska Institute, Sweden) for providing us with SIK1-KO mice. This study was supported by Grants-in-Aid for Scientific Research from the Ministry of Education, Culture, Sports, Science, and Technology, Japan (24790333), Adaptable and Seamless Technology Transfer Programme through target-driven research and development, JST, the grant from the Ministry of Health, Labour, and Welfare (2013–2017, 2014–2016), Scientific Research on Innovative Areas, a MEXT Grant-in-Aid Project 2012–2013; Strategic Research Foundation at Private Universities (2013–2017), and a grant from the Uehara Memorial Foundation.
Disclosures
The authors have no conflict of interests.
Supporting Information
Additional Supporting Information may be found in the online version of this article:
Figure S1. Gene expression of pro-inflammatory and anti-inflammatory molecules in salt-inducible kinase 1 (SIK1) or SIK2-deficient thioglycollate-elicited peritoneal macrophages.
Figure S2. Expression of pro-inflammatory and anti-inflammatory molecules in salt-inducible kinase 3 knockout bone marrow-derived macrophages.
Table S1. List of primers used for quantitative RT-PCR.
Data S1. Supporting materials and methods.
References
- Salomao R, Brunialti MKC, Rapozo MM, Baggio-Zappia GL, Galanos C, Freudenberg M. Bacterial sensing, cell signaling, and modulation of the immune response during sepsis. Shock. 2012;38:227–42. doi: 10.1097/SHK.0b013e318262c4b0. [DOI] [PubMed] [Google Scholar]
- Kawai T, Akira S. The role of pattern-recognition receptors in innate immunity: update on Toll-like receptors. Nat Immunol. 2010;11:373–84. doi: 10.1038/ni.1863. [DOI] [PubMed] [Google Scholar]
- Pålsson-McDermott EM, O'Neill LAJ. Signal transduction by the lipopolysaccharide receptor, Toll-like receptor-4. Immunology. 2004;113:153–62. doi: 10.1111/j.1365-2567.2004.01976.x. [DOI] [PMC free article] [PubMed] [Google Scholar]
- Pauls E, Nanda SK, Smith H, Toth R, Arthur JSC, Cohen P. Two phases of inflammatory mediator production defined by the study of IRAK2 and IRAK1 knock-in mice. J Immunol. 2013;191:2717–30. doi: 10.4049/jimmunol.1203268. [DOI] [PMC free article] [PubMed] [Google Scholar]
- Kawagoe T, Sato S, Matsushita K, et al. Sequential control of Toll-like receptor-dependent responses by IRAK1 and IRAK2. Nat Immunol. 2008;9:684–91. doi: 10.1038/ni.1606. [DOI] [PubMed] [Google Scholar]
- Kyriakis JM, Avruch J. Mammalian MAPK signal transduction pathways activated by stress and inflammation: a 10-year update. Physiol Rev. 2012;92:689–737. doi: 10.1152/physrev.00028.2011. [DOI] [PubMed] [Google Scholar]
- Newton K, Dixit VM. Signaling in innate immunity and inflammation. Cold Spring Harb Perspect Biol. 2012;4:pii a006049. doi: 10.1101/cshperspect.a006049. [DOI] [PMC free article] [PubMed] [Google Scholar]
- Das M, Sabio G, Jiang F, Rincón M, Flavell RA, Davis RJ. Induction of hepatitis by JNK-mediated expression of TNF-α. Cell. 2009;136:249–60. doi: 10.1016/j.cell.2008.11.017. [DOI] [PMC free article] [PubMed] [Google Scholar]
- Piras V, Selvarajoo K. Beyond MyD88 and TRIF Pathways in Toll-Like Receptor Signaling. Front Immunol. 2014;5:70. doi: 10.3389/fimmu.2014.00070. [DOI] [PMC free article] [PubMed] [Google Scholar]
- Kawai T, Takeuchi O, Fujita T, Inoue J, Mühlradt PF, Sato S, Hoshino K, Akira S. Lipopolysaccharide stimulates the MyD88-independent pathway and results in activation of IFN-regulatory factor 3 and the expression of a subset of lipopolysaccharide-inducible genes. J Immunol. 2001;167:5887–94. doi: 10.4049/jimmunol.167.10.5887. [DOI] [PubMed] [Google Scholar]
- McWhirter SM, Fitzgerald KA, Rosains J, Rowe DC, Golenbock DT, Maniatis T. IFN-regulatory factor 3-dependent gene expression is defective in Tbk1-deficient mouse embryonic fibroblasts. Proc Natl Acad Sci U S A. 2004;101:233–8. doi: 10.1073/pnas.2237236100. [DOI] [PMC free article] [PubMed] [Google Scholar]
- Ohmori Y, Hamilton TA. Requirement for STAT1 in LPS-induced gene expression in macrophages nal transducer and activator of transcription 1 2000. [PubMed]
- Thomas KE, Galligan CL, Newman RD, Fish EN, Vogel SN. Contribution of interferon-β to the murine macrophage response to the toll-like receptor 4 agonist, lipopolysaccharide. J Biol Chem. 2006;281:31119–30. doi: 10.1074/jbc.M604958200. [DOI] [PubMed] [Google Scholar]
- Ferrante CJ, Leibovich SJ. Regulation of macrophage polarization and wound healing. Adv Wound Care. 2012;1:10–6. doi: 10.1089/wound.2011.0307. [DOI] [PMC free article] [PubMed] [Google Scholar]
- Fleming BD, Mosser DM. Regulatory macrophages: setting the threshold for therapy. Eur J Immunol. 2011;41:2498–502. doi: 10.1002/eji.201141717. [DOI] [PMC free article] [PubMed] [Google Scholar]
- Lizcano JM, Göransson O, Toth R, et al. LKB1 is a master kinase that activates 13 kinases of the AMPK subfamily, including MARK/PAR-1. EMBO J. 2004;23:833–43. doi: 10.1038/sj.emboj.7600110. [DOI] [PMC free article] [PubMed] [Google Scholar]
- Takemori H, Kajimura J, Okamoto M. TORC-SIK cascade regulates CREB activity through the basic leucine zipper domain. FEBS J. 2007;274:3202–9. doi: 10.1111/j.1742-4658.2007.05889.x. [DOI] [PubMed] [Google Scholar]
- Dentin R, Liu Y, Koo SH, Hedrick S, Vargas T, Heredia J, Yates J, 3rd, Montminy M. Insulin modulates gluconeogenesis by inhibition of the coactivator TORC2. Nature. 2007;449:366–9. doi: 10.1038/nature06128. [DOI] [PubMed] [Google Scholar]
- Screaton RA, Conkright MD, Katoh Y, et al. The CREB coactivator TORC2 functions as a calcium- and cAMP-sensitive coincidence detector. Cell. 2004;119:61–74. doi: 10.1016/j.cell.2004.09.015. [DOI] [PubMed] [Google Scholar]
- Altarejos JY, Montminy M. CREB and the CRTC co-activators: sensors for hormonal and metabolic signals. Nat Rev Mol Cell Biol. 2011;12:141–51. doi: 10.1038/nrm3072. [DOI] [PMC free article] [PubMed] [Google Scholar]
- Takemori H, Katoh Hashimoto Y, Nakae J, Olson EN, Okamoto M. Inactivation of HDAC5 by SIK1 in AICAR-treated C2C12 myoblasts. Endocr J. 2009;56:121–30. doi: 10.1507/endocrj.k08e-173. [DOI] [PubMed] [Google Scholar]
- Walkinshaw DR, Weist R, Kim G-W, et al. The tumor suppressor kinase LKB1 activates the downstream kinases SIK2 and SIK3 to stimulate nuclear export of class IIa histone deacetylases. J Biol Chem. 2013;288:9345–62. doi: 10.1074/jbc.M113.456996. [DOI] [PMC free article] [PubMed] [Google Scholar]
- Clark K, MacKenzie KF, Petkevicius K, et al. Phosphorylation of CRTC3 by the salt-inducible kinases controls the interconversion of classically activated and regulatory macrophages. Proc Natl Acad Sci U S A. 2012;109:16986–91. doi: 10.1073/pnas.1215450109. [DOI] [PMC free article] [PubMed] [Google Scholar]
- MacKenzie KF, Clark K, Naqvi S, et al. PGE2 induces macrophage IL-10 production and a regulatory-like phenotype via a protein kinase A-SIK-CRTC3 pathway. J Immunol. 2013;190:565–77. doi: 10.4049/jimmunol.1202462. [DOI] [PMC free article] [PubMed] [Google Scholar]
- Yong Kim S, Jeong S, Chah K-H, et al. Salt-inducible kinases 1 and 3 negatively regulate Toll-like receptor 4-mediated signal. Mol Endocrinol. 2013;27:1958–68. doi: 10.1210/me.2013-1240. [DOI] [PMC free article] [PubMed] [Google Scholar]
- Uebi T, Itoh Y, Hatano O, et al. Involvement of SIK3 in glucose and lipid homeostasis in mice. PLoS ONE. 2012;7:e37803. doi: 10.1371/journal.pone.0037803. [DOI] [PMC free article] [PubMed] [Google Scholar]
- Eneling K, Brion L, Pinto V, et al. Salt-inducible kinase 1 regulates E-cadherin expression and intercellular junction stability. FASEB J. 2012;26:3230–9. doi: 10.1096/fj.12-205609. [DOI] [PMC free article] [PubMed] [Google Scholar]
- Horike N, Kumagai A, Shimono Y, et al. Downregulation of SIK2 expression promotes the melanogenic program in mice. Pigment Cell Melanoma Res. 2010;23:809–19. doi: 10.1111/j.1755-148X.2010.00760.x. [DOI] [PubMed] [Google Scholar]
- Zhang X, Goncalves R, Mosser DM. The isolation and characterization of murine macrophages. Curr Protoc Immunol. 2008;Chapter 14:Unit 14.1. doi: 10.1002/0471142735.im1401s83. [DOI] [PMC free article] [PubMed] [Google Scholar]
- Graves RA, Tontonoz P, Ross SR, Spiegelman BM. Identification of a potent adipocyte-specific enhancer: involvement of an NF-1-like factor. Genes Dev. 1991;5:428–37. doi: 10.1101/gad.5.3.428. [DOI] [PubMed] [Google Scholar]
- Katoh Y, Takemori H, Lin X-Z, et al. Silencing the constitutive active transcription factor CREB by the LKB1-SIK signaling cascade. FEBS J. 2006;273:2730–48. doi: 10.1111/j.1742-4658.2006.05291.x. [DOI] [PubMed] [Google Scholar]
- Murray PJ, Allen JE, Biswas SK, et al. Macrophage activation and polarization: nomenclature and experimental guidelines. Immunity. 2014;41:14–20. doi: 10.1016/j.immuni.2014.06.008. [DOI] [PMC free article] [PubMed] [Google Scholar]
- Jenkins SJ, Ruckerl D, Cook PC, Jones LH, Finkelman FD, van Rooijen N, MacDonald AS, Allen JE. Local macrophage proliferation, rather than recruitment from the blood, is a signature of Th2 inflammation. Science. 2011;332:1284–8. doi: 10.1126/science.1204351. [DOI] [PMC free article] [PubMed] [Google Scholar]
- Becker L, Liu N-C, Averill MM, et al. Unique proteomic signatures distinguish macrophages and dendritic cells. PLoS ONE. 2012;7:e33297. doi: 10.1371/journal.pone.0033297. [DOI] [PMC free article] [PubMed] [Google Scholar]
- Lacey DC, Achuthan A, Fleetwood AJ, et al. Defining GM-CSF- and macrophage-CSF-dependent macrophage responses by in vitro models. J Immunol. 2012;188:5752–65. doi: 10.4049/jimmunol.1103426. [DOI] [PubMed] [Google Scholar]
- Fleetwood AJ, Lawrence T, Hamilton JA, Cook AD. Granulocyte–macrophage colony-stimulating factor (CSF) and macrophage CSF-dependent macrophage phenotypes display differences in cytokine profiles and transcription factor activities: implications for CSF blockade in inflammation. J Immunol. 2007;178:5245–52. doi: 10.4049/jimmunol.178.8.5245. [DOI] [PubMed] [Google Scholar]
- Luan B, Goodarzi MO, Phillips NG, et al. Leptin-mediated increases in catecholamine signaling reduce adipose tissue inflammation via activation of macrophage HDAC4. Cell Metab. 2014;19:1058–65. doi: 10.1016/j.cmet.2014.03.024. [DOI] [PMC free article] [PubMed] [Google Scholar]
- Parra M, Verdin E. Regulatory signal transduction pathways for class IIa histone deacetylases. Curr Opin Pharmacol. 2010;10:454–60. doi: 10.1016/j.coph.2010.04.004. [DOI] [PubMed] [Google Scholar]
- Ghisletti S, Huang W, Jepsen K, Benner C, Hardiman G, Rosenfeld MG, Glass CK. Cooperative NCoR/SMRT interactions establish a corepressor-based strategy for integration of inflammatory and anti-inflammatory signaling pathways. Genes Dev. 2009;23:681–93. doi: 10.1101/gad.1773109. [DOI] [PMC free article] [PubMed] [Google Scholar]
- Cao W, Bao C, Padalko E, Lowenstein CJ. Acetylation of mitogen-activated protein kinase phosphatase-1 inhibits Toll-like receptor signaling. J Exp Med. 2008;205:1491–503. doi: 10.1084/jem.20071728. [DOI] [PMC free article] [PubMed] [Google Scholar]
- Jeong Y, Du R, Zhu X, Yin S, Wang J, Cui H, Cao W, Lowenstein CJ. Histone deacetylase isoforms regulate innate immune responses by deacetylating mitogen-activated protein kinase phosphatase-1. J Leukoc Biol. 2013;95:1–9. doi: 10.1189/jlb.1013565. [DOI] [PubMed] [Google Scholar]
- Chi H, Flavell RA. Acetylation of MKP-1 and the control of inflammation. Sci Signal. 2008;1:pe44. doi: 10.1126/scisignal.141pe44. [DOI] [PMC free article] [PubMed] [Google Scholar]
- Serrat N, Sebastian C, Pereira-Lopes S, Valverde-Estrella L, Lloberas J, Celada A. The response of secondary genes to lipopolysaccharides in macrophages depends on histone deacetylase and phosphorylation of C/EBPβ. J Immunol. 2014;192:418–26. doi: 10.4049/jimmunol.1203500. [DOI] [PubMed] [Google Scholar]
Associated Data
This section collects any data citations, data availability statements, or supplementary materials included in this article.
Supplementary Materials
Figure S1. Gene expression of pro-inflammatory and anti-inflammatory molecules in salt-inducible kinase 1 (SIK1) or SIK2-deficient thioglycollate-elicited peritoneal macrophages.
Figure S2. Expression of pro-inflammatory and anti-inflammatory molecules in salt-inducible kinase 3 knockout bone marrow-derived macrophages.
Table S1. List of primers used for quantitative RT-PCR.
Data S1. Supporting materials and methods.