

Abstract
Background
Curcumin (diferulolylmethane) has been shown to have a protective role in mouse models of inflammatory bowel diseases (IBD) and to reduce the relapse rate in human ulcerative colitis (UC), thus making it a potentially viable supportive treatment option. Trinitrobenzene sulfonic acid (TNBS) colitis in NKT-deficient SJL/J mice has been described as Th1-mediated inflammation, whereas BALB/c mice are believed to exhibit a mixed Th1/Th2 response.
Methods
We therefore investigated the effect of dietary curcumin in colitis induced in these 2 strains.
Results
In the BALB/c mice, curcumin significantly increased survival, prevented weight loss, and normalized disease activity. In the SJL/J mice, curcumin demonstrated no protective effects. Genomewide microarray analysis of colonic gene expression was employed to define the differential effect of curcumin in these 2 strains. This analysis not only confirmed the disparate responses of the 2 strains to curcumin but also indicated different responses to TNBS. Curcumin inhibited proliferation of splenocytes from naive BALB/c mice but not SJL/J mice when nonspecifically stimulated in vitro with concanavalin A (ConA). Proliferation of CD4+ splenocytes was inhibited in both strains, albeit with about a 2-fold higher IC50 in SJL/J mice. Secretion of IL-4 and IL-5 by CD4+ lymphocytes of BALB/c mice but not SJL/J mice was significantly augmented by ConA and reduced to control levels by curcumin.
Conclusions
The efficacy of dietary curcumin in TNBS colitis varies in BALB/c and SJL/J mouse strains. Although the exact mechanism underlying these differences is unclear, the results suggest that the therapeutic value of dietary curcumin may differ depending on the nature of immune dysregulation in IBD.
Keywords: animal models of IBD, trinitrobenzene sulfonic acid (TNBS), BALB/c, SJL/J, microarray
Idiopathic inflammatory bowel diseases [IBD; Crohn’s disease (CD) and ulcerative colitis (UC)] are defined as autoimmune diseases implicated in aberrant and persistent inflammation of the bowel because of an excessive effector response or an insufficient regulatory response to commensal bacterial flora.1 Both environmental factors and genetic predisposition have been implicated in the pathogenesis of CD and UC, although their precise contributions remain incompletely understood.1–4 Although both CD and UC share a common basis in immune hyperresponsiveness to mucosal antigens, the 2 diseases vary considerably. Crohn’s disease is associated with a Th1/Th17 cell–mediated response mediated by IL-12 and IL-23, with concomitant increased production of IFNγ, IL-2, IL-18, and IL-17,1,5–7 whereas ulcerative colitis is associated with an atypical Th2 response characterized by NKT secretion of IL-13 accompanied by increased production of IL-4 and IL-5.1,8
Both in human IBD and in animal models of the disease, the development and persistency of inflammation depend partially on the activation and nuclear translocation of the NFκB complex. Although with somewhat different mechanisms, NFκB regulates transcription of both Th1/Th17-associated cytokines like IL-12 and IL-239–12 and the Th2 cytokines IL-4 and IL-13,13,14 making NFκB an attractive therapeutic target in both CD and UC. In fact, decoy oligonucleotides containing NFκB-binding sites were proven effective in both the prevention and treatment of murine Th1 and Th2 models of hapten-induced colitis.15 Curcumin (diferulolylmethane) is also an emerging candidate drug targeting, among other pathways, the signaling events leading to NFκB activity.16 The effects of curcumin on the immune response (both innate and adaptive) has been a subject of much attention in the past decade.17 Curcumin has been identified as the most active constituent of turmeric and has been described as an anti-inflammatory, antioxidant, proapoptotic, and antiproliferative compound.18–21 In addition, this compound regulates the activity of several enzymes via direct interaction or can modulate gene transcription through the inhibition of transcription factors and signaling pathways.22 Curcumin has been shown to play a protective role in chemically induced mouse models of IBD23–26 and to reduce the relapse rate in human UC.27
Colitis can be efficiently induced in mice using a rectally administered haptenizing agent, trinitrobenzene sulfonic acid (TNBS) in 50% ethanol, with the nature of the immune response to TNBS depending on the genetic background of the mice used. In BALB/c mice, TNBS colitis develops independently of IFNγ, with prominent Th2 responses in colonic patches and lesions.28 Although Th1 response and IFNγ has been implicated in the early deaths of TNBS-treated BALB/c mice, in later stages of the disease in this strain, expression of IFNγ mRNA in CD4+ cells is undetectable, whereas morphological changes in the colonic mucosa are reminiscent of those observed in ulcerative colitis.28 In contrast, TNBS-induced colitis in SJL/J mice is mediated by Th1-type T cells and is associated with high production of IL-12 and IFNγ. This response may be attributed to a susceptibility locus on chromosome 11 of SJL/J mice, associated with increased IL-12 responses to parenteral injection of LPS.29 The importance of IL-12 and/or IL-23 was demonstrated by the efficacy of a single injection of anti-p40 antibody in preventing colitis.30 Colitis in SJL/J mice can also be prevented by the administration of anti-CD40, blocking CD40–CD40L interactions, which are crucial in Th1-mediated inflammation.31,32 The key role of TNFα in TNBS colitis in the SJL/J strain also confirms the importance of the Th1 pathway because TNFα-deficient mice do not develop inflammation.33 The Th1-skewed response to TNBS in SJL/J mice is likely a result of a defect in NKT cells that have been implicated in IL-13 production and associated with an atypical Th2 response in ulcerative colitis.8 SJL/J mice have drastically reduced the number of B220−/CD1d tetramer+ NKT cells34 with defective T-cell-receptor-induced IL-4 production and absence of T cells expressing NK1.1.35
In this study, we investigated the effect of dietary curcumin in a concentration previously demonstrated as effective in BALB/c mice (2%)25 in the 2 strains of mice: SJL/J and BALB/c. This model of hapten-induced colitis allows the study of the initial event in the development of mucosal inflammation, associating the response to specific antigen (in the presence of ethanol) and the mucosal immune response leading to colonic inflammation. Our results indicate that in BALB/c mice, which exhibit a mixed Th1/Th2 response, dietary curcumin significantly increases survival, protects from weight loss, and normalizes the indices of the disease, while remaining ineffective in Th1-skewed SJL/J mice. Using a genomewide microarray analysis of colonic gene expression, we identified a differential pattern of genes regulated by dietary curcumin in these 2 mouse strains. Moreover, in vitro, curcumin inhibits concanavalin A (ConA)–induced proliferation of splenocytes from naive BALB/c mice but not SJL/J mice. The curcumin IC for CD4+ 50 T-cell proliferation was 2-fold higher in SJL/J mice than in BALB/c mice. Our results therefore provide a side-by-side comparison of the effectiveness of curcumin in 2 immunologically distinct models of chemically induced colitis and may suggest potential differences in the usefulness of this compound in Crohn’s disease and ulcerative colitis.
MATERIALS AND METHODS
Curcumin
Curcumin was isolated from commercially obtained turmeric powder, Curcuma longa L., Zingiberaceae, according to the unpublished method of Timmermann et al (Higuchi Biosciences Center, University of Kansas, Lawrence, Kan.; patent pending). Briefly, the method consists of 3 steps, 2 solvent extraction steps and a chromatography step, employing commonly used water-miscible and -immiscible solvents in industrial-scale processes. Quality control was performed by high-performance liquid chromatography (HPLC) using an Agilent system comprising an Agilent 1100 pump, a thermostated column compartment, a nonthermostated autosampler and diode array detector, a Luna C18 column (Phenomenex), and a guard column (SecurityGuard AJO-4287; Phenomenex; Torrance, CA) with mobile phases A (500 μL of acetic acid/L of Nanopure water) and B (500 μL of acetic acid/L of acetonitrile). Detection was performed at 425 and 250 nm with ChemStation for LC 3D, Rev. A. 09.03 (1417) for data acquisition (Agilent). Mass spectrometry (MS) analysis was performed with an Agilent 1100 HPLC system in tandem with an Agilent LC-MSD-Trap-SL ion trap mass spectrometer using MSD Trap Control 5.0 with LC/MSD Trap software 4.1 by Bruker Daltonic GmbH for data acquisition.
Animals and Diets
Six-week-old male BALB/c and SJL/J mice (18–21 g B.W.) were obtained from Harlan Laboratories (Indianapolis, Ind.) and maintained in the animal facility at the University of Arizona, College of Medicine. Mice were fed a control diet (NIH-31; Harlan Teklad, Madison, Wis.) or a diet supplemented with 2% curcumin. Diets were prepared daily by mixing powdered food with curcumin (2% final content) in a mortar until homogeneity was observed. Water (0.65 mL/g diet) with microwave-melted agar (0.1% final content in the diet) was subsequently added and mixed well, and the diet was divided into daily portions based on an estimated consumption of 5 g of dry matter per mouse per day. The stability of curcumin in the diet was evaluated by HPLC. Aliquots (3× 200 mg) of the diet were removed at times 0, 2.5, 5, 9, and 24 hours and immediately extracted with 5 mL of a 1:1 mixture of dichloromethane and methanol. Samples were injected into a Luna C18 (2) column with a SecurityGuard AJO-4287 guard column (both from Phenomenex) and analyzed in an Agilent 1100 system with a diode array detector at 425 and 250 nm. The area under the curve (AUC) of the curcumin peak was calculated, averaged, and plotted (Fig. 1). Feeding the 2 diets began 2 days prior to the administration of TNBS and continued for 7 days, until sacrifice. Mice were administered TNBS intrarectally (2 mg/mouse in 50% ethanol) or phosphate-buffered saline as a control in a total volume of 100 μL (3.5 cm from the anal verge) using a 1-mL syringe fitted with a polyethylene cannula. Mice were then kept in a vertical position for 30 seconds before being returned to their cages. Body weight and mortality were monitored daily. Three experimental groups were used in both mouse strains: control diet/control enema, control diet/TNBS enema, and 2% curcumin diet/TNBS enema. An additional group of BALB/c mice fed the curcumin-supplemented diet for 9 days was included to study the effects of curcumin alone on colonic gene expression.
FIGURE 1.

Purity and stability of curcumin used in the study. A: HPLC analysis of curcumin was performed as described in the Materials and Methods section. No contaminating curcuminoids (demetoxycurcumin, or bis-demetoxycurcumin), commonly detected as contaminants in commercial curcumin, were detectable in the preparation. B: Mass spectrometry (MS) analysis of curcumin. Its melting point, elemental analysis, molecular weight by MS, and H NMR were in accord with the structure. C: Chromatographic analysis of curcumin stability in the mouse diet did not indicate any degradation over a 24-hour period. A slight increase in the amount of extracted curcumin was observed between times 0 and 9 hours, possibly because of partitioning of hydrophobic curcumin into the lipid phase of the diet, which was more accessible to the organic solvents used in the extraction procedure.
Histological Evaluation
Proximal and distal colons from BALB/c and SJL/J mice were harvested and fixed in 10% neutral buffered formalin (Fisher Scientific, Tustin Calif.) and paraffin embedded. Five-micrometer tissue cuts were stained with hematoxylin and eosin (H&E) for light microscopic examination. A veterinary pathologist blinded to the study design graded the sections by scoring them on a scale from 0 to 5. The scoring table was based on the criteria degree of lamina propria mononuclear cell infiltration, crypt hyperplasia, and architectural distortion, as previously described.36 Proximal and distal colons were scored separately, and the sum of the 2 scores for individual mice was used for statistical analysis. Images from H&E-stained slides were obtained for documentation and presentation using a Zeiss Axioplan microscope fitted with a Nikon DS-Fi1 digital camera.
Microarray Analysis of Colonic Gene Expression
Colonic tissues (whole colon) from 9 mice randomly selected from each treatment group were pooled (3 per sample), and RNA was purified with TRIzol reagent (Invitrogen, Carlsbad, Calif.) to yield 3 pooled samples per group. Total RNA (100 μg) was cleaned up with an RNeasy Mini Kit (Qiagen) according to the manufacturer’s protocol. RNA was evaluated by denaturing agarose gel electrophoresis, the 28S/18S rRNA ratio was calculated, and concentrations were adjusted according to densitometric analysis of the 18S rRNA. Only high-quality RNA, as evaluated by the intactness of the ribosomal bands, was used for gene chip analysis. RNA samples were subsequently processed to yield biotinylated cRNA for hybridization to Affymetrix Mouse Gene Array Expression Set 430 (Affymetrix, Santa Clara, Calif.) according to the manufacturer’s recommendations (Affymetrix; Expression Analysis Technical Manual) using reagents provided by Affymetrix [Gene Chip Sample Cleanup Module, T7-oligo(dT) primer, GeneChip IVT Labeling Kit] or Invitrogen (dNTP mix, SuperScript II Reverse Transcriptase, E. coli DNA ligase, E. coli DNA polymerase I, E. coli RNase H). Fragmented cRNA was mixed with control oligonucleotide B2 (Affymetrix), eukaryotic hybridization controls (Affymetrix), herring sperm DNA (Invitrogen), bovine serum albumin (Invitrogen), 2× hybridization buffer, and RNAse-free water. This hybridization cocktail was then applied to GeneChip Mouse Expression Set 430 (Affymetrix) and hybridized at 45°C for 16 hours while spinning at 53 rpm. The GeneChip Mouse Expression Set 430 provides comprehensive coverage of the transcribed mouse genome on a 2-array set with about 45,000 probe sets to analyze the expression of more than 39,000 transcripts and variants from more than 34,000 well-characterized mouse genes. Chips were immediately washed and stained with the GeneChip Fluidics Station 400 (Affymetrix). SAPE and antibody solutions were prepared according to the manufacturer’s recommendations (Affymetrix), and chips were washed and stained utilizing the EukGE-WS2v5 fluidics protocol. After the chips had been washed and stained, they were scanned with the GeneChip Scanner 3000 (Affymetrix). Obtained data were subsequently exported for analysis to GeneSpring v.7.0 (Silicon Genetics, Redwood City, Calif.). Stringent empirical and statistical analyses were employed to compare gene expression profiles between mice in different treatment groups, with a cross-gene error model based on replicates. Normalized data (per gene, per chip, and per sample, with healthy controls serving as a reference point) were serially filtered in the following order: selected genes flagged as present or marginal in at least 3 of 9 samples; selected genes up- or down-regulated at least 1.5-fold with P ≤ 0.05 (control versus TNBS, both on control diet; Student t test); and selected genes with P ≤ 0.5 according to ANOVA (with all 3 treatment groups) and significantly different between TNBS-treated mice on control or curcumin-supplemented diet [by Student-Newman-Keuls (SNK) post hoc test].
Real-time RT-PCR
Expression of selected genes based on the outcome of microarray analysis was independently analyzed by real-time RT-PCR. 200 ng of total RNA was reverse-transcribed using an iScript kit (Bio-Rad, Hercules, Calif.), and 10% of the RT reaction was used for real-time PCR analysis using TaqMan technology and commercially available primers from Applied Biosystems (Foster City, Calif.) with iQSupermix (Bio-Rad) and the iCycler optical PCR cycler (Bio-Rad). The resulting data were analyzed using the comparative Ct method as a means of relative quantitation of gene expression, normalized to an endogenous reference (TATA box–binding protein) and relative to a calibrator (normalized Ct value obtained from control mice), and expressed as 2−ΔΔCt, as described by the manufacturer (Applied Biosystems).
Lymphoid Cell Preparation and Stimulation by Concanavalin A
Spleens of naive BALB/c or SJL/J mice were removed, and single-cell suspensions were prepared by gentle teasing. Cells were washed and resuspended in complete medium (RPMI 1640, Invitrogen, Carlsbad, Calif.) supplemented with 10% heat-inactivated fetal calf serum (Gemini Bio-products, West Sacramento, Calif.), 2 mM l-glutamine, 50 mg/mL of gentamicin (Sigma, St. Louis, Mo.), 100 U/mL penicillin, and 100 mg/mL streptomycin (Invitrogen, Carlsbad, Calif.). Red blood cells were lysed in a hypotonic buffer (BD Biosciences, San Jose, Calif.) and washed twice in a complete medium. CD4+ cells were purified from the total population of splenocytes using magnetic separation and an autoMACS instrument according to manufacturer’s instructions (Miltenyi Biotec, Auburn, Calif.). CD4+ T cells were selected using the DepletS program. Flow cytometry analysis (FACSCalibur; BD, Franklin Lakes, NJ) indicated that more than 95% of the selected cells coexpressed CD3 and CD4. Cells were cultured at a concentration of 106 cells/mL in 96-well flat-bottomed plates (BD Bioscience). Splenocytes or CD4+ T cells were nonspecifically stimulated in vitro with concanavalin A (Sigma) at a concentration of 5 μg/mL and treated with DMSO or increasing concentrations of curcumin (from 0.5 to 5 μM) for 72 hours. In a separate series of experiments, cell culture supernatants were collected and stored at −80°C for cytokine analysis. For the proliferation assay, cells were pulsed with 1 μCi/well [3H]-thymidine (MP Biomaterial, Costa Mesa, Calif.) after 56 hours of culture and incubated for an additional 16 hours. Cells were then harvested using a 96-well Packard cell harvester, and radioactivity was measured on a Packard Beta Counter (Packard Biosciences, Meriden, Conn.). The curcumin IC50 was calculated for BALB/c and SJL/J CD4+ T cells or splenocytes stimulated with concanavalin A and treated with increasing concentrations of curcumin—0.5, 1, 1.25, 2.5, and 5 μM—according to the [3H]-thymidine measurements.
Statistical Analysis
Statistical significance was determined by the Student t test or analysis of variance (ANOVA) followed by the Fisher PLSD test using the StatView software package version 4.53 (SAS Institute, Cary, NC). Data are expressed as mean ± standard error of the mean. Microarray analysis was performed using GeneSpring GX 7.3 (Agilent Technologies, Santa Clara, Calif.) utilizing both empirical and statistical tools (t test, 1-way ANOVA, Student-Newman-Keuls post hoc test) in the software package.
Ethical Considerations
All methods used in this study were reviewed and approved by the Institutional Animal Care and Use Committee of the University of Arizona.
RESULTS
Purity and Stability of Curcumin
The isolated curcumin was more than 97% pure as judged by HPLC (Fig. 1A) and completely devoid of coextracted curcuminoids, demethoxycurcumin and bis-demethoxycurcumin, commonly detected as contaminants in commercial curcumin. Its melting point, elemental analysis, and molecular weight by MS and H-NMR were in accord with the structure (Fig. 1B). Organic extraction and LC-MS analysis indicated no apparent degradation of dietary curcumin within 24 hours (Fig. 1C).
Curcumin Significantly Increased Survival and Protected from Body Weight Loss in BALB/c But Not SJL/J Mice
Both strains of mice responded to TNBS treatment with significant mortality, which reached 35% in BALB/c mice and 50% in SJL/J mice (Fig. 2A). This was accompanied by body weight loss, as great as 27% and 28% of body weight in the BALB/c and SJL/J strains, respectively (Fig. 2B). Two percent dietary curcumin administered in a preventive mode in settings similar to those described by Sugimoto et al25 offered significant protection against TNBS-induced mortality in BALB/c mice but not SJL/J mice (Fig. 2A). Similarly, curcumin prevented significant body weight loss in TNBS-treated BALB/c mice, whereas body weight loss and recovery of SJL/J mice was not improved by the curcumin-supplemented diet (Fig. 2B).
FIGURE 2.
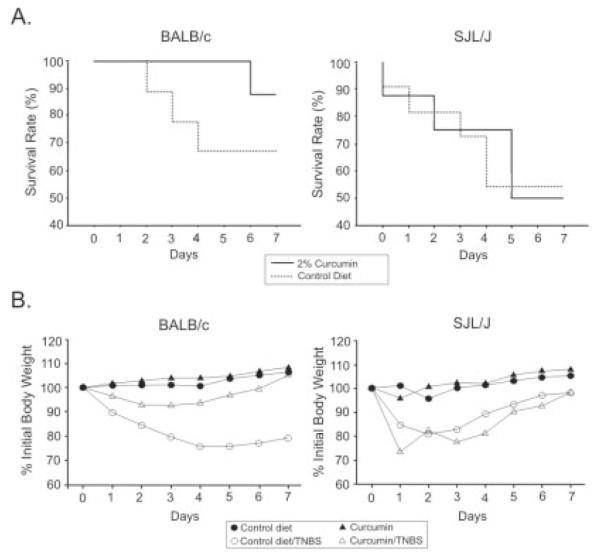
A: Survival of TNBS-treated BALB/c and SJL/J mice fed control diet (dotted line) and 2% curcumin–supplemented diet (solid line). Dietary curcumin significantly improved the survival of colitic BALB/c mice but not SJL/J mice. B: Body weight loss and recovery in control and TNBS-treated BALB/c and SJL/J mice fed the control or the 2% curcumin–supplemented diet. The curcumin diet prevented body weight loss in BALB/c mice but not SJL/J mice.
Curcumin Improves Colonic Histology of BALB/c Mice But Not SJL/J Mice
Colon sections were interpreted semiquantitatively in a blinded manner by a veterinary pathologist according to previously published critieria,36 taking into account lymphocytic and neutrophilic infiltration, crypt hyperplasia, mucosal ulcerations, focal or multifocal transmural necrosis, penetration of the colonic wall, and exuberant subacute peritonitis encompassing the adjacent pancreatic tissue. The final histological score, depicted in Figure 3G, is the sum of the scores from the proximal and distal segments of the mouse colon. Consistent with the effects on mortality and body weight loss, curcumin treatment resulted in statistically significant improvement in the histology score of BALB/c mice but not SJL/J mice (Fig. 3).
FIGURE 3.

Histological analysis (H&E staining) of colonic morphology in control and TNBS-treated BALB/c and SJL/J mice fed the control or the 2% curcumin–supplemented diet. A–C: BALB/c mice; D–F: SJL/J mice. G: Summary of histological damage scoring expressed as the sum of the scores from the proximal and distal segments of the mouse colon. Consistent with the effects on mortality and body weight loss, curcumin treatment resulted in statistically significant improvement of the histology scores of BALB/c mice but not SJL/J mice.
Microarray Analysis of Colonic Gene Expression Revealed TNBS Colitis Alters Expression of Distinct Sets of Genes in BALB/c and SJL/J Mice
Genomewide microarray analysis (MOE430 set; Affymetrix) of colonic gene expression in BALB/c and SJL/J mice was performed using GeneSpring GX 7.3.1 software (Agilent). Genes/probe sets were selected as follows: (1) present or marginal in 2 of 6 samples (3 biological repetitions per treatment per strain), (2) expression increased or decreased at least 1.5-fold, (3) t test showing P < 0.05 between control and TNBS-treated mice. In the BALB/c mice, a total of 965 genes/probe sets were differentially expressed, whereas in the SJL/J mice, expression of 800 genes/probe sets was altered. The Venn diagram depicted in Figure 4 indicates a relatively small set of genes common to both strains, which were significantly altered by TNBS colitis, thus indicating the 2 strains had a significantly different response to a common haptenizing agent (TNBS).
FIGURE 4.
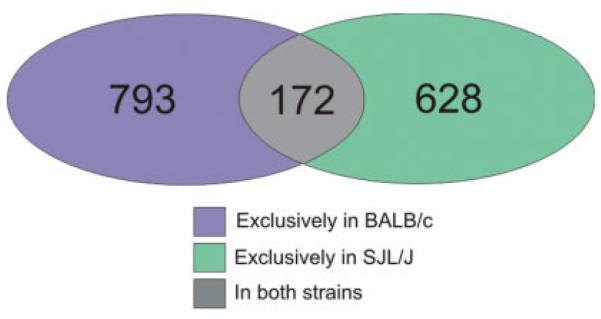
Venn diagram depicting a difference in the colonic gene expression pattern in BALB/c and SJL/J mice in response to TNBS. The number of genes/probe sets up- or down-regulated at least 1.5-fold (P < 0.05, Student t test) in the BALB/c mice (blue and gray overlap) and the SJL/J mice (green and gray overlap) indicated a significantly different response to the same haptenizing agent, with a relatively small number of genes dysregulated in both strains.
Colonic Gene Expression Profiles in BALB/c and SJL/J Mice Confirmed Differential Response to Curcumin
The genes/probe sets identified in Figure 4 as induced or repressed at least 1.5-fold (P < 0.05) in TNBS colitis were analyzed by 1-way ANOVA followed by the Student-Newman-Keuls post hoc (SNK) test for all 3 groups of mice (control, TNBS, TNBS+curcumin). ANOVA identified 469 genes in the BALB/c mice and 211 genes in the SJL/J mice. Of these, 428 genes were significantly different (normalized) in the BALB/c mice according to the SNK test (91.3%), whereas only 41 genes/probe sets were different in the SJL/J mice (19.4%), shown in Figure 5A. Moreover, the expression pattern of genes/probe sets identified in the BALB/c mice by ANOVA and the SNK test (Fig. 5A) was very different in the SJL/J mice. A vast majority of the genes whose expression was normalized by curcumin in the BALB/c mice (Fig. 5B) were not affected in the SJL/J mice (Fig. 5C). Further analysis of the differential response to curcumin among the 2 mouse strains focused on genes affected by TNBS colitis and normalized by curcumin in BALB/c but not SJL/J mice. To this end, we identified a subset of 116 genes/probe sets whose expression was normalized by curcumin treatment in BALB/c mice (as determined by ANOVA and post hoc testing) but were not significantly altered in SJL/J mice (P > 0.05 between TNBS and TNBS/curcumin by SNK test). To gain insight into the functional relevance of the identified genes that were targets of strain-specific effects of curcumin, this list of genes/probe sets was analyzed with the Functional Annotation Tool and the Database for Annotation, Visualization, and Integrated Discovery (DAVID), developed and maintained by the National Institute of Allergy and Infectious Diseases (http://david.abcc.ncifcrf.gov/).37 Biological process gene ontological analysis grouped these 116 genes/probe sets into several functional categories (P value ranging from 0.05 to 3.6 × 10−09), consistent with an inflammatory response (Fig. 6). On close inspection, this list consisted of 97 nonredundant, well-characterized genes, a large number of which are known to be involved in the pathogenesis of inflammatory bowel diseases, with genes involved in the acute-phase response, cell adhesion, and the response to a biotic stimulus particularly overrepresented. Table 1 depicts genes selected from among the 97 with expression data demonstrating a differential effect of dietary curcumin in the BALB/c and SJL/J mice.
FIGURE 5.
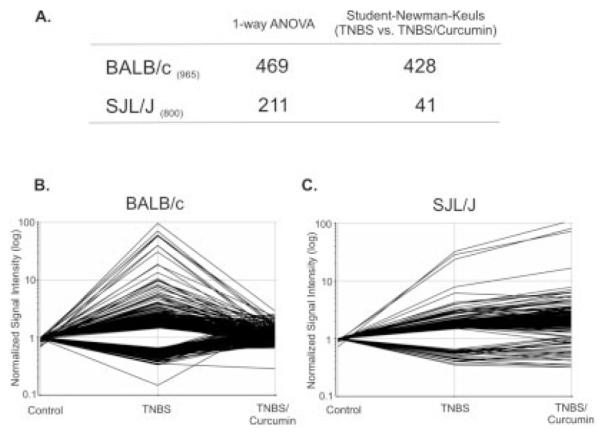
A: Genes/probe sets dysregulated by TNBS colitis (≥1.5-fold, P < 0.05) in the BALB/c mice (965 genes) or the SJL/J mice (800 genes) were subjected to 1-way ANOVA followed by the Student-Newman-Keuls (SNK) post hoc test. Four hundred and sixty-nine genes/probe sets in the BALB/c mice and 211 in the SJL/J mice passed ANOVA. Of these, 428 genes were normalized by curcumin treatment of the BALB/c mice (SNK, P < 0.05, TNBS versus TNBS/curcumin), but only 41 by curcumin treatment of the SJL/J mice. To demonstrate dramatic difference in the effect of curcumin in the 2 mouse strains, 428 genes from the SNK analysis of the BALB/c mice were plotted with their respective expression values from the BALB/c mice (B) and the SJL/J mice (C).
FIGURE 6.
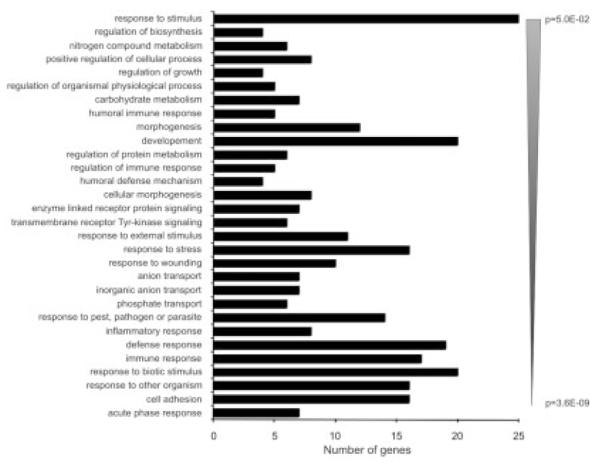
Gene ontology analysis using the DAVID Functional Annotation Tool (http://david.abcc.ncifcrf.gov/) of the 116 gene/probe sets (97 nonredundant well-characterized genes) whose expression was normalized by curcumin in BALB/c mice but not SJL/J mice based on post hoc analyses. Genes categorized based on biological process were grouped and ranked (threshold of 4, P < 0.05). Categories were sorted according to the EASE score, a modified Fisher exact P value.
TABLE 1.
Gene Expression Data (Fold Change Compared to Control Group) of the 97 Nonredundant Well-Characterized Genes Whose Expression Was Normalized by Curcumin in BALB/c Mice and Not in SJL/J Mice Based on Post-Hoc Analyses
| Gene | Description | BALB/c |
SJL/J |
||
|---|---|---|---|---|---|
| TNBS | TNBS/Curcumin | TNBS | TNBS/Curcumin | ||
| Acute-phase response | |||||
| REG3A | Regenerating islet-derived 3 alpha | 109.00 | 6.67 | 37.70 | 67.10 |
| REG3G | Regenerating islet-derived 3 gamma | 11.50 | 1.49 | 1.39 | 1.48 |
| SERPINA3 | Serine (or cysteine) peptidase inhibitor, clade a, member 3n |
10.60 | 0.89 | 3.06 | 5.51 |
| REG3D | Regenerating islet-derived 3 delta | 8.85 | 1.04 | 14.30 | 24.50 |
| Cell adhesion | FN1 fibronectin 1 | ||||
| THBS1 | Thrombospondin 1 | 2.26 | 1.22 | 1.74 | 2.19 |
| TNC* | Tenascin c | 2.25 | 1.08 | 1.45 | 2.12 |
| COL1A2 | Procollagen, type I, alpha 2 | 2.17 | 0.95 | 1.68 | 2.25 |
| VCAN | Versican | 2.13 | 1.23 | 2.53 | 3.68 |
| TGM2 | Transglutaminase 2, c polypeptide | 2.10 | 1.23 | 1.69 | 2.58 |
| FBLN2 | Fibulin 2 | 1.97 | 0.98 | 1.53 | 1.79 |
| COL4A1 | Procollagen, type IV, alpha 1 | 1.96 | 1.12 | 2.05 | 3.62 |
| COL5A2 | Procollagen, type V, alpha 2 | 1.93 | 1.12 | 1.60 | 1.92 |
| EMB | Embigin | 1.74 | 1.13 | 2.02 | 2.86 |
| COL4A2 | Procollagen, type IV, alpha 2 | 1.74 | 0.97 | 1.62 | 3.15 |
| ICAM1* | Intercellular adhesion molecule 1 (CD54) | 1.69 | 1.10 | 1.79 | 2.00 |
| MADCAM1* | Mucosal vascular addressin cell adhesion molecule 1 | 1.67 | 1.08 | 1.40 | 1.98 |
| PDPN | Podoplanin | 1.65 | 1.12 | 1.53 | 2.02 |
| CD47 | cd47 Antigen (rh-related antigen, integrin-associated signal transducer) |
1.64 | 1.07 | 1.28 | 1.73 |
| COL5A1 | Procollagen, type v, alpha 1 | 1.64 | 0.99 | 1.27 | 1.39 |
| Thy | Thymus cell antigen 1, theta | 1.60 | 1.12 | 1.96 | 2.74 |
| 1.59 | 1.01 | 1.56 | 1.93 | ||
| Defense/immune/inflammatory response, response to biotic stimulus, response to wounding |
|||||
| S100A9 | s100 Calcium binding protein a9 (calgranulin b) | 62.80 | 3.09 | 48.90 | 101.00 |
| Chi3l3* | Chitinase 3-like 3 | 44.80 | 0.94 | 38.20 | 76.70 |
| S100A8 | s100 Calcium binding protein a8 (calgranulin a) | 41.60 | 1.48 | 59.10 | 137.00 |
| CXCL2 | Chemokine (c-x-c motif) ligand 2 | 6.41 | 1.10 | 31.30 | 72.70 |
| IL1B* | Interleukin 1 beta | 3.56 | 1.14 | 11.10 | 21.30 |
| PTX3 | Pentraxin-related gene, rapidly induced by IL-1 beta | 2.98 | 0.94 | 3.11 | 7.16 |
| LBP* | Lipopolysaccharide binding protein | 2.69 | 0.80 | 1.38 | 2.06 |
| IL6* | Interleukin 6 | 2.44 | 0.89 | 2.50 | 6.40 |
| LILRB3 | Leukocyte immunoglobulin-like receptor, subfamily b, member 3 |
2.26 | 1.06 | 2.27 | 5.12 |
| C3* | Complement component 3 | 2.24 | 1.10 | 3.40 | 6.11 |
| FCGR3A | Fc fragment of IgG, low affinity IIIa, receptor (CD16a) | 2.06 | 0.86 | 1.42 | 2.82 |
| CEBPB | CCAAT/enhancer binding protein (c/ebp), beta | 1.95 | 0.98 | 1.59 | 2.68 |
| C1QB | Complement component 1, q subcomponent, B chain | 1.90 | 1.13 | 1.88 | 2.16 |
| C1QB | Complement component 1, q subcomponent, B chain | 1.90 | 1.13 | 1.88 | 2.16 |
| C4B | Complement component 4b (childo blood group) | 1.79 | 1.08 | 1.86 | 2.54 |
| LCP1 | Lymphocyte cytosolic protein 1 (l-plastin) | 1.66 | 0.98 | 1.61 | 2.59 |
| LYZ | Lysozyme | 1.63 | 1.05 | 1.90 | 3.43 |
| BCL3 | B-cell CLL/lymphoma 3 | 1.55 | 0.81 | 1.23 | 1.46 |
| ARHGDIB | Rho, GDP dissociation inhibitor (GDI) beta | 1.50 | 1.09 | 1.60 | 2.60 |
| CES3 | Carboxylesterase 3 | 0.45 | 0.90 | 0.73 | 0.73 |
| Transport | |||||
| LCN2* | Lipocalin 2 | 63.50 | 1.74 | 15.00 | 39.00 |
| CLCA6 | Chloride channel calcium activated 6 | 35.00 | 1.39 | 1.28 | 1.45 |
| Slc20a1 | Solute carrier family 20, member 1 (Pit-1) | 0.50 | 1.10 | 0.68 | 0.67 |
| ABCB1 | ATP-binding cassette, sub-family B (MDR/TAP), member 1A |
0.50 | 1.07 | 0.80 | 0.92 |
| SLC30A10 | Solute carrier family 30, member 10 | 0.37 | 0.78 | 0.87 | 0.79 |
| Response to stress | |||||
| PTGS2* | Prostaglandin-endoperoxide synthase 2 (COX-2) | 3.59 | 1.20 | 3.29 | 7.66 |
| HSPB7 | Heat shock protein family, member 7 (cardiovascular) | 1.83 | 1.10 | 1.20 | 1.25 |
| Enzyme linked receptor protein signaling pathway | |||||
| LOX | Lysyl oxidase | 4.06 | 1.16 | 3.85 | 7.95 |
| IGF1 | Insulin-like growth factor 1 (somatomedin C) | 2.41 | 1.22 | 1.97 | 2.58 |
| Sparc | Secreted protein, acidic, cysteine-rich (osteonectin) | 2.11 | 1.29 | 1.78 | 2.19 |
| PTPRO | Protein tyrosine phosphatase, receptor type, o | 1.90 | 1.19 | 1.73 | 2.03 |
| GRB10 | Growth factor receptor-bound protein 10 | 1.56 | 1.03 | 1.89 | 2.37 |
| Development | |||||
| PLA2G2A | Phospholipase A2, group IIA (platelets, synovial fluid) | 8.48 | 1.58 | 1.64 | 1.67 |
| TIMP1 | TIMP metallopeptidase inhibitor | 5.71 | 1.10 | 5.53 | 13.50 |
| GREM1 | Gremlin 1 | 2.55 | 0.96 | 1.87 | 2.25 |
| IGFBP4 | Insulin-like growth factor binding protein 4 | 2.32 | 1.04 | 1.86 | 2.65 |
| CAPG | Capping protein (actin filament), gelsolin-like | 2.30 | 1.49 | 1.43 | 1.75 |
| IGFBP5 | Insulin-like growth factor binding protein 5 | 2.15 | 1.23 | 1.70 | 1.92 |
| RREB1 | Ras responsive element binding protein 1 | 0.50 | 1.08 | 0.76 | 0.73 |
| PHOX2 | Paired-like homeobox 2b | 0.33 | 0.88 | 0.77 | 0.57 |
| Nitrogen compound metabolism | |||||
| SRM | Spermidine synthase | 1.53 | 0.94 | 0.99 | 1.33 |
| GOT1L1 | Glutamic-oxaloacetic transaminase 1-like 1 | 0.50 | 0.99 | 1.34 | 1.52 |
| MAOA | Monoamine oxidase a | 0.50 | 1.11 | 0.73 | 0.79 |
| Other | |||||
| CTLA2A* | Cytotoxic T lymphocyte–associated protein 2 alpha | 6.48 | 1.27 | 2.64 | 3.53 |
| RETNLB | Resistin like beta | 4.18 | 1.55 | 0.75 | 0.67 |
| TRIM15 | Tripartite motif-containing 15 | 3.85 | 1.26 | 1.25 | 1.40 |
| SLPI | Secretory leukocyte peptidase inhibitor | 3.31 | 1.33 | 2.96 | 3.36 |
| RBP1 | Retinol binding protein 1, cellular | 2.61 | 1.12 | 3.49 | 6.26 |
| SERPINE2 | Serpin peptidase inhibitor, clade E, member 2 | 2.50 | 1.46 | 1.68 | 2.09 |
| CSF2RB | Colony stimulating factor 2 receptor, beta, low-affinity (granulocyte-macrophage) |
2.18 | 0.99 | 2.57 | 5.22 |
| GDA | Guanine deaminase | 2.18 | 1.02 | 1.23 | 1.27 |
| FPRL2 | Formyl peptide receptor-like 2 | 2.16 | 0.96 | 2.06 | 5.48 |
| OSMR | Oncostatin M receptor | 2.11 | 1.04 | 1.46 | 2.06 |
| LGMN | Legumain | 2.03 | 1.02 | 1.23 | 1.43 |
| PGS1 | Phosphatidylglycerophosphate synthase 1 | 1.96 | 0.99 | 1.34 | 1.54 |
| FSTL1 | Follistatin-like 1 | 1.88 | 1.12 | 1.94 | 2.54 |
| BGN | Biglycan | 1.87 | 1.24 | 1.88 | 2.57 |
| TYROBP | TYRO protein tyrosine kinase binding protein | 1.83 | 1.07 | 2.09 | 3.06 |
| SULF2 | Sulfatase 2 | 1.81 | 1.04 | 1.44 | 1.66 |
| PLOD2 | Procollagen lysine, 2-oxoglutarate 5-dioxygenase 2 | 1.79 | 1.10 | 1.47 | 2.16 |
| MSN | Moesin | 1.74 | 1.00 | 1.80 | 2.42 |
| ITM2A | Integral membrane protein 2A | 1.74 | 1.05 | 2.09 | 3.33 |
| MMP14 | Matrix metallopeptidase 14 (membrane-inserted) | 1.59 | 1.12 | 1.52 | 2.11 |
| HEBP2 | Heme binding protein 2 | 1.54 | 1.12 | 1.04 | 1.11 |
| MMP2 | Matrix metallopeptidase 2 | 1.51 | 1.03 | 1.61 | 2.19 |
| GGTA1 | Glycoprotein galactosyltransferase alpha 1 | 1.50 | 0.89 | 1.44 | 2.07 |
| AKAP6 | A kinase (PRKA) anchor protein 6 | 0.62 | 1.15 | 1.11 | 1.41 |
| ARHGAP24 | Rho GTPase activating protein 24 | 0.50 | 0.95 | 1.25 | 1.57 |
| METTL7A | Methyltransferase like 7A | 0.50 | 1.08 | 0.83 | 0.80 |
| SMPX | Small muscle protein, X-linked | 0.50 | 0.89 | 0.79 | 0.62 |
| GSN | Gelsolin | 0.50 | 0.87 | 0.60 | 0.65 |
| MRPL47 | Mitochondrial ribosomal protein L47 | 0.50 | 1.48 | 0.95 | 1.32 |
| NMT2 | N-myristoyltransferase 2 | 0.50 | 1.44 | 1.77 | 2.48 |
| METTL7A | Methyltransferase like 7A | 0.50 | 1.14 | 0.76 | 0.73 |
| UGT2B5 | UDP glucuronosyltransferase 2 family, polypeptide B5 | 0.40 | 1.25 | 0.78 | 0.84 |
| CES1 | Carboxylesterase 1 (monocyte/macrophage Ser esterase 1) | 0.34 | 1.02 | 0.70 | 0.78 |
Genes were grouped based on their biological process assignment and sorted within groups based on fold-change in TNBS colitis in BALB/c mice. Asterisks next to gene symbols indicate genes selected and confirmed by real-time RT-PCR analysis.
TNFα is a prominent player in Th1 responses and is a well-established target of biological therapies, particularly in Crohn’s disease. In our studies, expression of TNFα was too low to be reliably compared by hybridization-based microarray analysis. However, real-time PCR analysis demonstrated that the TNBS-treated SJL/J mice had significantly higher expression of TNFα than did the BALB/c mice, and dietary curcumin effectively reduced expression in the latter strain while remaining ineffective in the SJL/J mice (Fig. 7).
FIGURE 7.
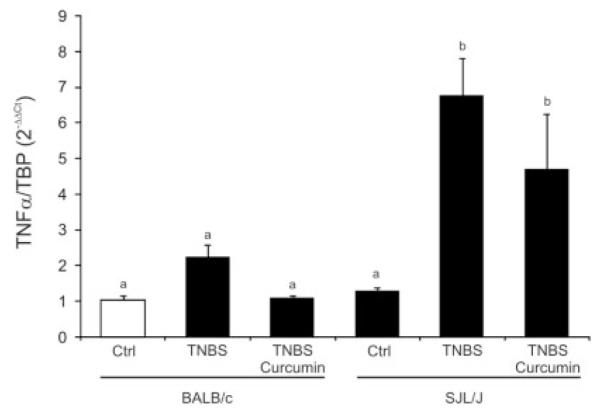
Real-time RT-PCR analysis of colonic expression of TNFα mRNA in BALB/c and SJL/J mice. The results were analyzed with TATA box–binding protein as an internal control using the ΔΔCt method, with control BALB/c mice (open bar) used as a calibrator. Statistical analysis was performed with ANOVA (P < 0.0007) followed by the Fisher PLSD post hoc test. Different letters next to bars indicate statistical differences (Fisher PLSD test, P < 0.05).
Identification of Overrepresented Transcription Factor–Binding Sites in Curcumin-Responsive Genes
To gain further insight into the transcriptional effects of curcumin in BALB/c mice, we used the set of 116 genes/probe identified as responding to curcumin treatment in BALB/c mice but not SJL/J mice to perform an analysis of transcription factor–binding sites (TFBSs) in the known gene promoters. To accomplish this, we utilized the oPOSSUM tool, recently developed by Ho Sui et al (http://www.cisreg.ca/oPOSSUM/).38 The oPOSSUM algorithm identifies overrepresented, predicted TFBSs in sets of human and mouse genes as compared to a defined genomic region of 1000 randomly selected background genes. Our analysis included 1000 bp upstream of the known or predicted transcription start site. From the submitted 116 genes/probe sets, 71 were included in the analysis. From among the overrepresented TFBSs, those previously demonstrated as targets of curcumin stood out (Fos/AP-1, NFκB, and PPARγ; Table 2). Although caution should be used interpreting TFBSs found overrepresented based on smaller background gene hits, some may represent true information about new, previously undescribed nuclear targets of curcumin, such as SRY/Sox5/Sox9 (members of the high-mobility group–box family of DNA-binding proteins), or homeobox transcription factors, generally implicated in regulating tissue-specific gene expression essential for tissue differentiation (Hox11, Prrx2, Nkx2-5, TCF1; Table 2).
TABLE 2.
POSSUM Analysis (http://www.cisreg.ca/oPOSSUM/) of Overrepresented Predicted Transcription Factor–Binding Sites in the Set of 97 Nonredundant Genes Whose Expression Was Normalized by Curcumin in BALB/c Mice and Not in SJL/J Mice Based on Post Hoc Analyses
| TF | Background gene hits |
Target gene hits |
Background TFBS hits |
Target TFBS hits |
Z-score | Fisher score |
|---|---|---|---|---|---|---|
| RXR-VDR | 7 | 3 | 7 | 3 | 12.0 | 0.024 |
| Fos | 233 | 24 | 346 | 52 | 11.9 | 0.035 |
| Hox 11-CTF1 | 16 | 5 | 16 | 5 | 11.6 | 0.010 |
| cEBP | 179 | 16 | 262 | 35 | 9.5 | 0.024 |
| SRY | 283 | 26 | 623 | 75 | 9.3 | 0.089 |
| MEF 2A | 96 | 12 | 123 | 18 | 7.4 | 0.045 |
| HLF | 108 | 13 | 121 | 17 | 7.3 | 0.047 |
| SRF | 11 | 3 | 11 | 3 | 7.3 | 0.060 |
| PPARG-RXRA | 8 | 2 | 8 | 2 | 7.1 | 0.138 |
| Prrx 2 | 322 | 27 | 916 | 105 | 7.0 | 0.188 |
| FOXD1 | 159 | 16 | 204 | 25 | 5.2 | 0.101 |
| Nkx2-5 | 383 | 29 | 1118 | 113 | 5.1 | 0.379 |
| RELA | 113 | 14 | 128 | 16 | 4.9 | 0.033 |
| TCF1 | 33 | 5 | 35 | 5 | 4.4 | 0.101 |
| Sox5 | 317 | 27 | 691 | 70 | 4.0 | 0.165 |
| SOX9 | 211 | 20 | 336 | 35 | 3.7 | 0.108 |
| NFKB1 | 76 | 9 | 83 | 10 | 3.7 | 0.101 |
| REL | 194 | 21 | 269 | 28 | 3.5 | 0.032 |
| TAL1-TCF3 | 95 | 12 | 118 | 13 | 3.3 | 0.042 |
| NFIl3 | 51 | 7 | 57 | 7 | 3.2 | 0.082 |
From the submitted 97 genes, 71 were included in the analysis focused on 1000 bp upstream of transcription start site and compared to a defined genomic region of 1000 randomly selected background genes. TFBS, transcription factor–binding site; background gene hits, number of genes with binding site(s) in the 1000-bp set of background genes; target gene hits, number of genes with binding site(s) in the 71 tested genes; background TFBS hits, number of binding sites in the 1000-bp set of background genes; target TFBS hits, number of binding sites in the 71 tested genes; Z score, measure of the rate of occurrence of a TFBS in the target set of genes compared to the expected rate estimated from the precomputed background set; Fisher score, 1-tailed Fisher exact probability comparing the proportion of coexpressed genes containing a particular TFBS to the proportion of the background set that contained the site to determine the probability of a nonrandom association between the coexepressed gene set and the TFBS of interest.
Limited Effects of Dietary Curcumin on Colonic Transcriptome in Naive BALB/c Mice
Curcumin is most effective when administered in a preventive mode prior to induction of colitis.25 To test whether curcumin acts to modify baseline gene expression or acts solely to prevent changes in colonic gene expression in response to an inflammatory insult, we analyzed the gene expression profile in the responsive mouse strain (BALB/c) to 2% dietary curcumin administered alone for the duration of the study (9 days). We observed very limited effects of the compound on the colonic transcriptome, consistent with the reported lack of toxic effects in rodents and humans. Microarray analysis performed in an analogous way to that already described identified only 6 genes significantly (≥1.5-fold change; P < 0.05, t test) affected by dietary curcumin. These include CHOP10/Ddit3 (2.47-fold induction by curcumin), glutathione S-transferase α2 (1.92-fold induction), HSPA5 (2.55-fold induction), coiled-coil domain containing 116 (Ccdc116; 2.11-fold induction), aldo-keto reductase family 1, member B (AKR1B1; 1.89-fold increase), and Wiskott-Aldrich syndrome-like gene (WASL; 1.89-fold increase).
Curcumin Differentially Modulates Mitogen-Induced BALB/c and SJL/J Splenocyte and CD4+ T-Cell Proliferation In Vitro
To help explain the strain-specific in vivo response to curcumin, we also evaluated the proliferative response of total splenocytes or purified CD4+ T cells obtained from BALB/c or SJL/J mice. Total splenocytes and magnetically selected CD4+ T cells were stimulated by a nonspecific mitogenic agent concanavalin A (ConA; 5 μM)) and cotreated with increasing concentrations of curcumin. The concentrations used were verified as noncytotoxic by the Trypan blue exclusion assay and by adenylate kinase release (ToxiLight Non-destructive Cytotoxicity Assay, Cambrex, NJ; data not shown). As anticipated, SJL/J mice generally had a much lower proliferative response to ConA than the BALB/c strain (Fig. 8). Curcumin effectively and dose-dependently inhibited proliferation of the BALB/c-derived splenocytes remaining (Fig. 8A) without a significant effect on splenocytes obtained from the SJL/J mice (Fig. 8B). Although the strain-related difference in the effects of curcumin on the proliferation of CD4+ lymphocytes was less dramatic than with total splenocytes, the IC50 calculated based on 5 independent experiments was somewhat higher in SJL/J mice than in BALB/c mice (4.1 vs. 2.5 μM, respectively; P < 0.05). In response to ConA stimulation, secretion of 2 key Th2 cytokines, IL-4 and IL-5, was significantly increased in the BALB/c-derived splenocytes (9-fold and 2.4-fold, respectively) and was significantly reduced by 5 μM curcumin, whereas both cytokines remained unaffected by ConA or curcumin in splenocytes obtained from SJL/J mice.
FIGURE 8.
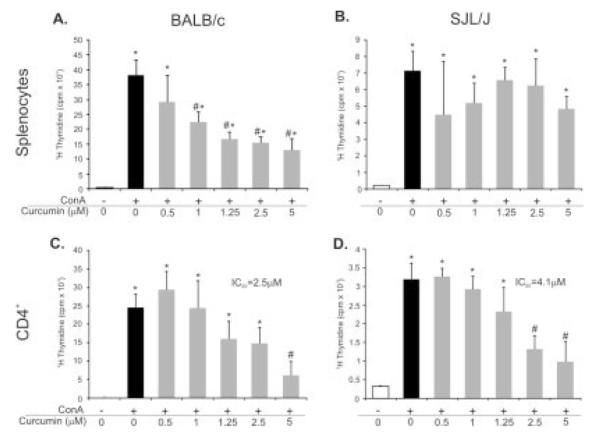
Effects of low, noncytotoxic concentrations of curcumin on ConA-induced proliferation of splenocytes (A,B) or magnetically selected CD4+ lymphocytes (C,D) obtained from naive BALB/c (A,C) or SJL/J mice (B,D). Dose-dependent inhibition of splenocyte proliferation was only observed in BALB/c mice, whereas the calculated IC50 of curcumin for the inhibition of CD4+ cell proliferation was significantly higher in SJL/J mice (P < 0.05; Student t test). All data were derived from 5 independent experiments with a minimum of 4 repetitions per treatment (*statistical difference between control and ConA-treated cells; #statistical difference between ConA and ConA+Curcumin treatment groups).
DISCUSSION
Curcumin has a broad spectrum of biological actions including chemotherapeutic, anti-inflammatory, antiangiogenic, and antioxidant effects. These were reviewed in depth in a recent monograph by Aggarwal, Surh, and Shishodia.39 The pleiotropic effects of curcumin could be attributed in part to the inhibition of NFκB, a finding that prompted several recent studies, which demonstrated the effectiveness of curcumin in chemically induced models of colitis.23–26 Moreover, curcumin has been demonstrated to be a promising, safe medication for maintaining remission in patients with quiescent ulcerative colits (UC).27 Clinical studies of potentially therapeutic or preventive effects of curcumin in Crohn’s disease are generally lacking, with the exception of a limited study by Holt et al.40 There are considerable differences in the pathogenesis, clinical manifestations, and outcomes of CD and UC, although generally there are no medications tailored specifically for either disorder.
Dichotomizing IBD as Th1 driven (Crohn’s disease) and Th2 or atypical Th2 response (ulcerative colitis) may be oversimplified based on current knowledge of IBD pathogenesis. It is even more contentious whether the TNBS colitis model can truly represent CD or UC, or simply an acute inflammation, a rather nonspecific component of IBD. Keeping in mind this and the known immunological differences between BALB/c and SJL/J mice described in the introduction, it is remarkable to see the striking differences in colonic gene expression pattern in response to the same haptenizing agent in BALB/c and SJL/J mice, 2 strains considered susceptible to TNBS-induced colitis.41 Although precise analysis of the differences in transcriptional response to TNBS in BALB/c and SJL/J mice is beyond the scope and limitations of this article, it is likely that this vastly different response to a proinflammatory insult also underlies the described differential effect of dietary curcumin. Despite multiple reports indicating the protective effects of curcumin in chemically induced colitis,23–26 we have repeatedly demonstrated lack of any positive effects of the compound in SJL/J mice in mortality, body weight loss, colonic histology, or colonic gene expression pattern. At the same time, BALB/c mice were consistently protected when administered curcumin in a preventive mode.
It remains unclear whether the protective effects of curcumin are dependent on polarization of T-cell responses in these 2 strains. Real-time RT-PCR analysis of colonic TNFα expression seems to indicate that the induction of the cytokine expression and differential effects of curcumin in BALB/c and SJL/J mice may be one factor determining the overall responsiveness to this drug. On the other hand, there are reports of in vitro studies that demonstrated curcumin-mediated inhibition of the Th1 activation pathway and skewing of the inflammatory response from Th1 to Th2. Kang et al showed that curcumin inhibited IL-12 production by LPS-induced macrophages, reduced their ability to induce IFN-γ, and increased their ability to induce IL-4 in antigen-primed CD4+ T cells.42 More recently, Kim et al demonstrated that curcumin-treated bone marrow–derived dendritic cells (DCs) also exhibited impaired IL-12, IL-1β, IL-6, and TNFα expression in response to LPS.19 In addition, curcumin-treated DCs showed impaired induction of Th1 responses.19 In vivo, curcumin was also shown to inhibit the Th1 cytokine profile,42,43 although in both cases this was accomplished with curcumin administered intraparenterally. Therefore, these studies were not conducted in settings achievable in human patients, where curcumin can only be administered orally and for whom no suitable means of parenteral administration have been described or approved by the Food and Drug Administration. It is likely that limited bioavailability and rapid metabolism of curcumin to compounds of unknown anti-inflammatory activity may both be factors in the ultimate effectiveness of curcumin in different forms of colonic inflammation. Also, it is not inconceivable that the observed more rapid onset of colitis in SJL/J mice was a factor in the overall efficacy of curcumin. Although little is known about the absorptive mechanisms of curcumin and the role of intestinal mucus, differences in mucus secretion, a potential diffusional barrier, particularly for lipophilic drugs, could contribute to differences in curcumin accessibility to the colonic epithelium.
Differential genomewide analysis of colonic gene expression clearly underscores the difference in clinical response to curcumin in the tested 2 strains of mice, with 91.3% of genes dysregulated by TNBS brought back to control levels in BALB/c mice and only 19.4% of genes affected by curcumin in SJL/J mice (Fig. 5). Focusing further analysis on genes affected by curcumin specifically in BALB/c mice and not in SJL/J mice, we hoped to gain insight into curcumin’s mechanism of protection from colitis. This list, depicted in Table 1, consists of 97 nonredundant genes, many of them known to be involved in the pathogenesis of inflammatory bowel diseases, with a particularly well-represented group of genes involved in cell adhesion. These include the members of the immunoglobulin superfamily, ICAM1, and MADCAM1. Although microarray data for VCAM1 were somewhat inconsistent (with disparate results from 4 probe sets), real-time PCR analysis confirmed the same pattern of expression, with VCAM1 elevated 12.06-fold ± 4.4-fold in TNBS-treated BALB/c mice and reduced 2.23-fold ± 0.3-fold over control mice by feeding them a curcumin-supplemented diet. At the same time, elevated expression of VCAM1 in colitic SJL/J mice was not affected by curcumin (data not shown). The binding of VCAM1 and MADCAM1 to their respective integrin ligands has been a target for drug development in recent years.44 Similarly, antisense therapy directed toward ICAM1 (Alicaforsen; ISIS 2302) showed promising results in studies with CD, unremitting pouchitis, and UC patients.45 It is plausible that the protective effects of curcumin are a result of its lack of specificity and its targeting of multiple genes and signaling pathways. Down-regulation of adhesion molecule expression was accompanied by simultaneous inhibition of cytokine and chemokine expression (e.g., IL1β, MIP-2, IL-6). Also, TLR-4 signaling, known to be affected by curcumin at the NFκB signaling cascade level,16 inhibition of ligand-dependent and -independent TLR-4 dimerization,46 and direct binding to MD-2,47 may be further affected by the observed down-regulation of LPS-binding protein (Table 1) and CD14. The latter was significantly induced by TNBS colitis in both BALB/c and SJL/J mice but reduced by curcumin in the BALB/c strain only (also confirmed by real-time PCR; not shown). CD14 was not included in the comparison presented in Table 1 because it did not pass the 1-way ANOVA test in SJL/J mice.
Microarray analysis of colonic gene expression in response to dietary curcumin in naive BALB/c mice showed very limited effects of the drug. This finding underscores the lack of apparent toxicity of curcumin and suggests it is unlikely that wide alterations of the colonic transcriptome set the stage for the attenuated response to TNBS in this mouse strain. Of the 6 identified genes induced by curcumin, the role of 3 is unclear (GSTa2, AKR1B1, Ccdc116), though it is possible that the first 2 may be up-regulated in response to curcumin metabolism. Chop10/Ddit3 has been shown to be activated by ER stress48 and to act as an inhibitor of C/EBP DNA binding.49 Incidentally, the C/EBP binding site was found overrepresented in curcumin-regulated genes in BALB/c mice (Table 2). Induction of HSPA5, a member of the HSP70 family of heat shock proteins, may also be related to ER stress. This protein is believed to be a key element in sensing the folding capacity within the ER.50 Perhaps the most intriguing finding is the induction of the WASL (N-WASP) gene by curcumin. WASL is a ubiquitously expressed functional homologue of WASP (Wiskott-Aldrich syndrome protein), with both playing key regulatory roles in cellular actin assembly and in integrating surface-receptor signals to the actin cytoskeleton. Most importantly, very recently WASP-deficient mice were described to develop Th2-like colitis.51 Although an intriguing concept, answering the questions of whether WASL plays a similar role in the development of colitis and whether its induction by curcumin is of importance in the overall anti-inflammatory effects of the compound remains largely speculative.
The important question that remains is why the same genes are differently affected by curcumin in these 2 strains. Unfortunately, microarray analysis does not provide enough information to answer it. Analysis of transcription factor (TF)–binding sites overrepresented in promoters of genes affected in BALB/c mice but not SJL/J mice (Table 2) returned a number of TFs consistent with current knowledge about the transcriptional effects of curcumin (NFκB family, AP-1, PPARγ), along with many others that have not yet been described as affected by curcumin. It remains to be elucidated whether they represent true targets of the compound and whether they play a role in the different responses to curcumin in BALB/c and SJL/J mice. Our in vitro observations also suggest that some of the differential effects of curcumin may stem from differences in the potency of the compound to inhibit splenocyte and CD4+ T-cell proliferation in these 2 strains. We have shown that the IC50 of curcumin was nearly 2-fold higher for SJL/J-derived CD4+ T cells, whereas ConA-induced proliferation of total SJL/J splenocytes was completely unaffected. In sharp contrast, mitogen-induced BALB/c splenocyte proliferation was greatly inhibited by low and noncytotoxic concentrations of curcumin (Fig. 8). Although the mechanism of these puzzling yet striking differences is unclear, it may also represent the basis for the selective efficacy of curcumin in the 2 tested mouse strains. It is also plausible that pharmacokinetic properties of curcumin or metabolic activity of enzymes involved in biotransformation of curcumin into potentially active or inactive metabolites varies among different mouse strains, although this has never been demonstrated.
Based on our results, it is tempting to speculate that dietary curcumin may be of different value for Crohn’s disease and ulcerative colitis. Although the usefulness of this compound in maintaining remission in UC has been recently demonstrated,27 no well-designed trials with CD patients have been published. To support this hypothesis, our results would also have to be further verified in established immune models of Crohn’s disease and ulcerative colitis, such as IL-10- or TCRα-knockout mice, respectively.
Acknowledgments
Supported by R01DK067286.
REFERENCES
- 1.Sartor RB. Mechanisms of disease: pathogenesis of Crohn’s disease and ulcerative colitis. Nat Clin Pract Gastroenterol Hepatol. 2006;3:390–407. doi: 10.1038/ncpgasthep0528. [DOI] [PubMed] [Google Scholar]
- 2.Danese S, Sans M, Fiocchi C. Inflammatory bowel disease: the role of environmental factors. Autoimmun Rev. 2004;3:394–400. doi: 10.1016/j.autrev.2004.03.002. [DOI] [PubMed] [Google Scholar]
- 3.Lawrance IC, Fiocchi C, Chakravarti S. Ulcerative colitis and Crohn’s disease: distinctive gene expression profiles and novel susceptibility candidate genes. Hum Mol Genet. 2001;10:445–456. doi: 10.1093/hmg/10.5.445. [DOI] [PubMed] [Google Scholar]
- 4.Fiocchi C. Inflammatory bowel disease: etiology and pathogenesis. Gastroenterology. 1998;115:182–205. doi: 10.1016/s0016-5085(98)70381-6. [DOI] [PubMed] [Google Scholar]
- 5.Fuss IJ, Neurath M, Boirivant M, et al. Disparate CD4+ lamina propria (LP) lymphokine secretion profiles in inflammatory bowel disease. Crohn’s disease LP cells manifest increased secretion of IFN-gamma, whereas ulcerative colitis LP cells manifest increased secretion of IL-5. J Immunol. 1996;157:1261–1270. [PubMed] [Google Scholar]
- 6.Monteleone G, Biancone L, Marasco R, et al. Interleukin 12 is expressed and actively released by Crohn’s disease intestinal lamina propria mono-nuclear cells. Gastroenterology. 1997;112:1169–1178. doi: 10.1016/s0016-5085(97)70128-8. [DOI] [PubMed] [Google Scholar]
- 7.Parronchi P, Romagnani P, Annunziato F, et al. Type 1 T-helper cell predominance and interleukin-12 expression in the gut of patients with Crohn’s disease. Am J Pathol. 1997;150:823–832. [PMC free article] [PubMed] [Google Scholar]
- 8.Fuss IJ, Heller F, Boirivant M, et al. Nonclassical CD1d-restricted NK T cells that produce IL-13 characterize an atypical Th2 response in ulcerative colitis. J Clin Invest. 2004;113:1490–1497. doi: 10.1172/JCI19836. [DOI] [PMC free article] [PubMed] [Google Scholar]
- 9.Plevy SE, Gemberling JH, Hsu S, et al. Multiple control elements mediate activation of the murine and human interleukin 12 p40 promoters: evidence of functional synergy between C/EBP and Rel proteins. Mol Cell Biol. 1997;17:4572–4588. doi: 10.1128/mcb.17.8.4572. [DOI] [PMC free article] [PubMed] [Google Scholar]
- 10.Becker C, Wirtz S, Blessing M, et al. Constitutive p40 promoter activation and IL-23 production in the terminal ileum mediated by dendritic cells. J Clin Invest. 2003;112:693–706. doi: 10.1172/JCI17464. [DOI] [PMC free article] [PubMed] [Google Scholar]
- 11.Hilliard BA, Mason N, Xu L, et al. Critical roles of c-Rel in autoimmune inflammation and helper T cell differentiation. J Clin Invest. 2002;110:843–850. doi: 10.1172/JCI15254. [DOI] [PMC free article] [PubMed] [Google Scholar]
- 12.Zhang Z, Andoh A, Yasui H, et al. Interleukin-1beta and tumor necrosis factor-alpha upregulate interleukin-23 subunit p19 gene expression in human colonic subepithelial myofibroblasts. Int J Mol Med. 2005;15:79–83. [PubMed] [Google Scholar]
- 13.Das J, Chen CH, Yang L, et al. A critical role for NF-kappa B in GATA3 expression and TH2 differentiation in allergic airway inflammation. Nature Immunol. 2001;2:45–50. doi: 10.1038/83158. [DOI] [PubMed] [Google Scholar]
- 14.Pahl A, Zhang M, Kuss H, et al. Regulation of IL-13 synthesis in human lymphocytes: implications for asthma therapy. Br J Pharmacol. 2002;135:1915–1926. doi: 10.1038/sj.bjp.0704656. [DOI] [PMC free article] [PubMed] [Google Scholar]
- 15.Fichtner-Feigl S, Fuss IJ, Preiss JC, et al. Treatment of murine Th1- and Th2-mediated inflammatory bowel disease with NF-kappa B decoy oligonucleotides. J Clin Invest. 2005;115:3057–3071. doi: 10.1172/JCI24792. [DOI] [PMC free article] [PubMed] [Google Scholar]
- 16.Jobin C, Bradham CA, Russo MP, et al. Curcumin blocks cytokine-mediated NF-kappa B activation and proinflammatory gene expression by inhibiting inhibitory factor I-kappa B kinase activity. J Immunol. 1999;163:3474–3483. [PubMed] [Google Scholar]
- 17.Jagetia GC, Aggarwal BB. “Spicing up” of the immune system by curcumin. J Clin Immunol. 2007;27:19–35. doi: 10.1007/s10875-006-9066-7. [DOI] [PubMed] [Google Scholar]
- 18.Yadav VS, Mishra KP, Singh DP, et al. Immunomodulatory effects of curcumin. Immunopharmacol Immunotoxicol. 2005;27:485–497. doi: 10.1080/08923970500242244. [DOI] [PubMed] [Google Scholar]
- 19.Kim GY, Kim KH, Lee SH, et al. Curcumin inhibits immunostimulatory function of dendritic cells: MAPKs and translocation of NF-kappa B as potential targets. J Immunol. 2005;174:8116–8124. doi: 10.4049/jimmunol.174.12.8116. [DOI] [PubMed] [Google Scholar]
- 20.Bhaumik S, Jyothi MD, Khar A. Differential modulation of nitric oxide production by curcumin in host macrophages and NK cells. FEBS Lett. 2000;483:78–82. doi: 10.1016/s0014-5793(00)02089-5. [DOI] [PubMed] [Google Scholar]
- 21.Joe B, Vijaykumar M, Lokesh BR. Biological properties of curcumin-cellular and molecular mechanisms of action. Crit Rev Food Sci Nutr. 2004;44:97–111. doi: 10.1080/10408690490424702. [DOI] [PubMed] [Google Scholar]
- 22.Sharma RA, Gescher AJ, Steward WP. Curcumin: the story so far. Eur J Cancer. 2005;41:1955–1968. doi: 10.1016/j.ejca.2005.05.009. [DOI] [PubMed] [Google Scholar]
- 23.Jian YT, Mai GF, Wang JD, et al. Preventive and therapeutic effects of NF-kappaB inhibitor curcumin in rats colitis induced by trinitrobenzene sulfonic acid. World J Gastroenterol. 2005;11:1747–1752. doi: 10.3748/wjg.v11.i12.1747. [DOI] [PMC free article] [PubMed] [Google Scholar]
- 24.Salh B, Assi K, Templeman V, et al. Curcumin attenuates DNB-induced murine colitis. Am J Physiol Gastrointest Liver Physiol. 2003;285:G235–G243. doi: 10.1152/ajpgi.00449.2002. [DOI] [PubMed] [Google Scholar]
- 25.Sugimoto K, Hanai H, Tozawa K, et al. Curcumin prevents and ameliorates trinitrobenzene sulfonic acid-induced colitis in mice. Gastroenterology. 2002;123:1912–1922. doi: 10.1053/gast.2002.37050. [DOI] [PubMed] [Google Scholar]
- 26.Ukil A, Maity S, Karmakar S, et al. Curcumin, the major component of food flavour turmeric, reduces mucosal injury in trinitrobenzene sulphonic acid-induced colitis. Br J Pharmacol. 2003;139:209–218. doi: 10.1038/sj.bjp.0705241. [DOI] [PMC free article] [PubMed] [Google Scholar]
- 27.Hanai H, Iida T, Takeuchi K, et al. Curcumin maintenance therapy for ulcerative colitis: randomized, multicenter, double-blind, placebo-controlled trial. Clin Gastroenterol Hepatol. 2006;4:1502–1506. doi: 10.1016/j.cgh.2006.08.008. [DOI] [PubMed] [Google Scholar]
- 28.Dohi T, Fujihashi K, Rennert PD, et al. Hapten-induced colitis is associated with colonic patch hypertrophy and T helper cell 2-type responses. J Exp Med. 1999;189:1169–1180. doi: 10.1084/jem.189.8.1169. [DOI] [PMC free article] [PubMed] [Google Scholar]
- 29.Bouma G, Kaushiva A, Strober W. Experimental murine colitis is regulated by two genetic loci, including one on chromosome 11 that regulates IL-12 responses. Gastroenterology. 2002;123:554–565. doi: 10.1053/gast.2002.34752. [DOI] [PubMed] [Google Scholar]
- 30.Fuss IJ, Marth T, Neurath MF, et al. Anti-interleukin 12 treatment regulates apoptosis of Th1 T cells in experimental colitis in mice. Gastroenterology. 1999;117:1078–1088. doi: 10.1016/s0016-5085(99)70392-6. [DOI] [PubMed] [Google Scholar]
- 31.Cong Y, Weaver CT, Lazenby A, et al. Colitis induced by enteric bacterial antigen-specific CD4+ T cells requires CD40–CD40 ligand interactions for a sustained increase in mucosal IL-12. J Immunol. 2000;165:2173–2182. doi: 10.4049/jimmunol.165.4.2173. [DOI] [PubMed] [Google Scholar]
- 32.Stuber E, Strober W, Neurath M. Blocking the CD40L–CD40 interaction in vivo specifically prevents the priming of T helper 1 cells through the inhibition of interleukin 12 secretion. J Exp Med. 1996;183:693–698. doi: 10.1084/jem.183.2.693. [DOI] [PMC free article] [PubMed] [Google Scholar]
- 33.Neurath MF, Fuss I, Pasparakis M, et al. Predominant pathogenic role of tumor necrosis factor in experimental colitis in mice. Eur J Immunol. 1997;27:1743–1750. doi: 10.1002/eji.1830270722. [DOI] [PubMed] [Google Scholar]
- 34.Singh AK, Yang JQ, Parekh VV, et al. The natural killer T cell ligand alpha-galactosylceramide prevents or promotes pristane-induced lupus in mice. Eur J Immunol. 2005;35:1143–1154. doi: 10.1002/eji.200425861. [DOI] [PMC free article] [PubMed] [Google Scholar]
- 35.Beutner U, Launois P, Ohteki T, et al. Natural killer-like T cells develop in SJL mice despite genetically distinct defects in NK1.1 expression and in inducible interleukin-4 production. Eur J Immunol. 1997;27:928–934. doi: 10.1002/eji.1830270419. [DOI] [PubMed] [Google Scholar]
- 36.Kiela PR, Midura AJ, Kuscuoglu N, et al. Effects of Boswellia serrata in mouse models of chemically induced colitis. Am J Physiol Gastrointest Liver Physiol. 2005;288:G798–G808. doi: 10.1152/ajpgi.00433.2004. [DOI] [PubMed] [Google Scholar]
- 37.Dennis G, Jr., Sherman BT, Hosack DA, et al. DAVID: Database for annotation, visualization, and integrated discovery. Genome Biol. 2003;4:P3. [PubMed] [Google Scholar]
- 38.Ho Sui SJ, Fulton DL, Arenillas DJ, et al. oPOSSUM: integrated tools for analysis of regulatory motif over-representation. Nucleic Acids Res. 2007;35:W245–W252. doi: 10.1093/nar/gkm427. [DOI] [PMC free article] [PubMed] [Google Scholar]
- 39.Aggarwal BB, Surh Y-J, Shishodia S, editors. The Molecular Targets and Therapeutic Uses of Curcumin in Health and Disease. Springer; New York: Jun 16, 2007. p. 2007. [Google Scholar]
- 40.Holt PR, Katz S, Kirshoff R. Curcumin therapy in inflammatory bowel disease: a pilot study. Dig Dis Sci. 2005;50:2191–2193. doi: 10.1007/s10620-005-3032-8. [DOI] [PubMed] [Google Scholar]
- 41.Scheiffele F, Fuss IJ. Induction of TNBS colitis in mice. In: Coico R, editor. Current Protocols in Immunology. John Wiley & Sons, Inc.; 2001. pp. 15.19.11–15.19.14. [DOI] [PubMed] [Google Scholar]
- 42.Kang BY, Song YJ, Kim KM, et al. Curcumin inhibits Th1 cytokine profile in CD4+ T cells by suppressing interleukin-12 production in macrophages. Br J Pharmacol. 1999;128:380–384. doi: 10.1038/sj.bjp.0702803. [DOI] [PMC free article] [PubMed] [Google Scholar]
- 43.Zhang M, Deng CS, Zheng JJ, et al. Curcumin regulated shift from Th1 to Th2 in trinitrobenzene sulphonic acid-induced chronic colitis. Acta Pharmacologica Sinica. 2006;27:1071–1077. doi: 10.1111/j.1745-7254.2006.00322.x. [DOI] [PubMed] [Google Scholar]
- 44.Nakamura K, Honda K, Mizutani T, et al. Novel strategies for the treatment of inflammatory bowel disease: Selective inhibition of cytokines and adhesion molecules. World J Gastroenterol. 2006;12:4628–4635. doi: 10.3748/wjg.v12.i29.4628. [DOI] [PMC free article] [PubMed] [Google Scholar]
- 45.Danese S, Semeraro S, Marini M, et al. Adhesion molecules in inflammatory bowel disease: therapeutic implications for gut inflammation. Dig Liver Dis. 2005;37:811–818. doi: 10.1016/j.dld.2005.03.013. [DOI] [PubMed] [Google Scholar]
- 46.Youn HS, Saitoh SI, Miyake K, et al. Inhibition of homodimerization of Toll-like receptor 4 by curcumin. Biochem Pharmacol. 2006;72:62–69. doi: 10.1016/j.bcp.2006.03.022. [DOI] [PubMed] [Google Scholar]
- 47.Gradisar H, Keber MM, Pristovsek P, et al. MD-2 as the target of curcumin in the inhibition of response to LPS. J Leukoc Biol. 2007 doi: 10.1189/jlb.1206727. [DOI] [PubMed] [Google Scholar]
- 48.Marciniak SJ, Yun CY, Oyadomari S, et al. CHOP induces death by promoting protein synthesis and oxidation in the stressed endoplasmic reticulum. Genes Dev. 2004;18:3066–3077. doi: 10.1101/gad.1250704. [DOI] [PMC free article] [PubMed] [Google Scholar]
- 49.Ron D, Habener JF. CHOP, a novel developmentally regulated nuclear protein that dimerizes with transcription factors C/EBP and LAP and functions as a dominant-negative inhibitor of gene transcription. Genes Dev. 1992;6:439–453. doi: 10.1101/gad.6.3.439. [DOI] [PubMed] [Google Scholar]
- 50.Shen J, Chen X, Hendershot L, et al. ER stress regulation of ATF6 localization by dissociation of BiP/GRP78 binding and unmasking of Golgi localization signals. Dev Cell. 2002;3:99–111. doi: 10.1016/s1534-5807(02)00203-4. [DOI] [PubMed] [Google Scholar]
- 51.Nguyen DD, Maillard MH, Cotta-de-Almeida V, et al. Lymphocyte-dependent and Th2 cytokine-associated colitis in mice deficient in Wiskott-Aldrich syndrome protein. Gastroenterology. 2007;133:1188–1197. doi: 10.1053/j.gastro.2007.07.010. [DOI] [PMC free article] [PubMed] [Google Scholar]