Abstract
Infection with Trypanosoma cruzi, the protozoan parasite that causes Chagas disease, results in chronic infection that leads to cardiomyopathy with increased mortality and morbidity in endemic regions. In a companion study, our group found that a high fat diet protected mice from Trypanosoma cruzi-induced myocardial damage, and significantly reduced post-infection mortality. In the present study, the lethality of T. cruzi (Brazil strain) infection in CD-1 mice was reduced from 55% to 20% by an 8 week pre-feeding of a high fat diet (HFD) to induce obesity and the metabolic syndrome. The addition of metformin reduced mortality to 3%. It is an interesting observation as both the high fat diet and metformin, which are known to differentially attenuate host metabolism, effectively modified mortality in T. cruzi infected mice. In humans, the metabolic syndrome, as presently construed, produces immune activation and metabolic alterations that promote complications of obesity and diseases of later life, such as myocardial infarction, stroke, diabetes, Alzheimer's disease and cancer. Using an evolutionary approach, we hypothesized that for millions of years, the channeling of host resources into immune defenses starting early in life ameliorated the effects of infectious diseases, especially chronic infections, such as tuberculosis, and Chagas disease. In economically developed countries in recent times, with control of the common devastating infections, epidemic obesity, and lengthening of life span, the dwindling benefits of the immune activation in the first half of life have been overshadowed by the explosion of the syndrome's negative effects in later life.
Introduction
(I-1)
American trypanosomiasis or Chagas disease, caused by the protozoan parasite, Trypanosoma cruzi, is classified by the World Health Organization (WHO) as one of the major infectious diseases of the world. It is responsible for substantial morbidity and mortality among individuals in endemic regions of Latin America and those that have immigrated to non-endemic areas of the world such as the United States and Europe [1, 2]. Chronic infection results in cardiomyopathy and/or megasyndromes with a significant associated morbidity and mortality. In this study and in a companion study from our group [3] we demonstrate that the lethality of T. cruzi acute infection in mice can be markedly attenuated by pre-feeding with a high fat diet (HFD) to mimic the metabolic syndrome.
(I-2)
The metabolic syndrome, the combination of (i) inflammation and immunologic activation (ii) hypertension and (iii) metabolic changes including insulin resistance, is a major complication of obesity in humans [4]. It is generally accepted that the metabolic syndrome is responsible for the acceleration of disorders associated with aging -- especially cardiovascular diseases and diabetes, and more recently Alzheimer's disease and cancer [5].
(I-3)
Using a historical perspective, we have hypothesized that the metabolic syndrome is evolutionarily ancient [6, 7]. In addition to the well-accepted harm associated with late-in-life disorders, we have posited that throughout human history, the so-called syndrome has benefited individuals by enhancing the host defenses against infectious diseases. In addition to support during acute self-limited infections (e.g. community acquired pneumonia) [8], we raise the possibility that the major benefit of the metabolic syndrome accrues in controlling the widespread potentially ravaging infections that the body cannot self-cure, including tuberculosis, and American trypanosomiasis, the subject of the present paper [9].
(I-4)
The findings presented in this study and in a companion piece [3] demonstrate that mice fed a high fat diet to mimic the human metabolic syndrome are significantly protected against the lethality of T. cruzi infection. These data are consistent with human epidemiologic observations that increased body weight positively correlates with improved outcomes in Chagas disease [10] (as well as with tuberculosis, histoplamosis, malaria, and other infectious diseases [8, 9, 11]). Exceptions occurs when (i) hyperglycemia supervenes, or (ii) when the metabolic syndrome is severe or (iii) of long duration.
Materials and Methods
Ethics Statement
(M-1)
All animal experiments followed standard care principles and procedures for the use of experimental animals (Guide for the Care and Use of Laboratory Animals, National Research Council) as described by NIH and OLAW. All experiments were performed on an animal use protocol (20130101) approved by the Institutional Animal Care and Use Committees (IACUC) of the Albert Einstein College of Medicine.
Experimental animal model
(M-2) Experimental animals
5 weeks old CD-1 inbred mice (n=220), weighing on average 28 grams (Charles River Laboratories, Wilmington, MA, U.S.A.) were maintained on a 12h light–dark cycle in a temperature and humidity controlled room. Animals were housed in groups of five per cage with free access to water and food. Body weights were recorded once every two weeks, and cages were changed three times per week.
(M-3)
Mice were randomly divided into a high fat diet (HFD), n=100 or regular diet (n=120). Mice fed a regular diet included 20 uninfected mice, 20 uninfected mice treated with metformin, 40 infected mice, and 40 infected mice treated with metformin. Mice fed a high fat diet included 20 uninfected mice, 20 uninfected mice treated with metformin, 30 infected mice, and 30 infected mice treated with metformin. The high fat diet consisted of (by kcal) 60% fat with added cholesterol, 20% protein and 20% carbohydrate; the regular diet consisted of 10% fat, 20% protein and 70% carbohydrate (Research Diets Inc., New Brunswick, NJ). Diets were matched for sucrose. All mice were fed the assigned diets for the duration of the experiment.
(M-4) Metformin
At 10 weeks of age (20 days before infection), a subset of mice were started on metformin (Research Grade, Sigma-Aldrich, St. Louis, MO) as indicated above. The metformin was administered daily by gavage (after weighing and blood draws) and was continued through day 71 post-infection (Table 1). No placebo and no sham gavages were utilized.
Table 1.
Experimental Design
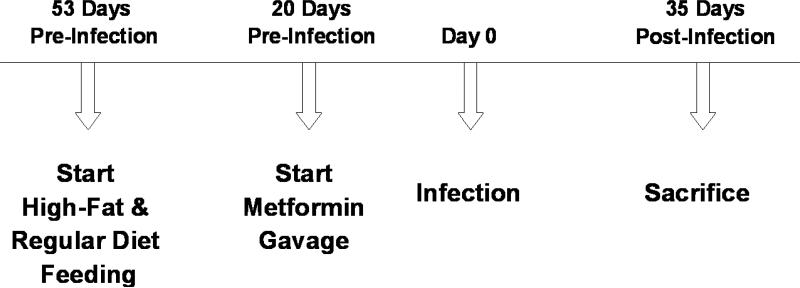
|
(M-5) Infection
After weighings, metformin administration and blood drawings, on the day of infection (designated as post-infection day zero), subsets of mice in both HFD and RD groups were infected intraperitoneally (i.p.) with 5 × 10⁴ trypomastigotes Brazil strain of T. cruzi, maintained by passage in C3H/Hej mice (Jackson Laboratories, Bar Harbor, ME), as described by Tanowitz et al. [12] (Table 1). Experimental mice were then categorized into eight subgroups.
Follow up of experimental groups
(M-6) Fasting Blood glucose
Tail blood was drawn in the morning, four hours after food was removed. Glucose was measured on whole blood with AlphaTRAK 2 blood glucose test strips and monitoring system (Abbott) [13].
(M-7) Oral glucose tolerance test (OGTT)
OGGT was performed twenty-eight days post infection. After a 6 hour fast, the mice (5 per group) were weighed and their base line glucose measured using an AlphaTRAK® Blood Glucose Monitoring System. Mice were gavaged orally with a glucose solution of 2 mg glucose/g body weight, and blood glucose was measured after 15, 30, and 60 minutes [13].
(M-8) Parasitemia
Twenty microliters of tail blood were transferred to a Neubauer hemocytometer and parasites were counted by microscopy. Data are expressed as the mean of parasites per milliliters of peripheral blood [14].
(M-9) Body composition analysis
On day 71 post- infection, we used magnetic resonance spectroscopy (MRS), employing the Echo Medical System EchoMRI-100, to determine body composition, expressed as fat mass and lean mass, in live mice unrestrained without anesthesia. Prior to scanning, EchoMRI was calibrated and weights of individual mice were determined. In this experiment, 2 mice were used for each infected group and 3 mice per uninfected (control) groups. Mice closest to the median weight of that group were selected for screening.
(M-10) Sacrifice
On day 35 post-infection, mice (n=54) were sacrificed by cervical dislocation. Liver, heart and white adipose tissue were harvested; liver and heart were weighed. All harvested tissues were stored at −80 °C and/or fixed in formalin for future studies.
Effect of metformin on cultured mammalian cells
(M-11) Mammalian cell culture
Human foreskin fibroblast (ATCC CRL 1475) cell line was maintained in Dulbecco's modified Eagle's medium (DMEM) containing 10% fetal bovine serum, and 1% penicillin-streptomycin at 37°C in 5% CO2. The fibroblasts were plated in 24-well plates (Falcon™ Tissue Culture Plates) and Nunc™ 4-Well Dishes (Sigma-Aldrich) at a density of 2.5 × 10⁵ per mL 24 hours prior to the start of the experiment to achieve 80-90% confluence. Eight hours prior to infection, half of wells in each plate were pre-treated/incubated with selected concentrations of metformin (0-50 ug/mL) (Sigma-Aldrich).
(M-12) Infection of HFF cells
Tissue culture-derived trypomastigotes were generated by weekly passage in confluent monolayers of fibroblast cells in DMEM containing 10% fetal bovine serum. Trypomastigotes harvested from cell culture supernatants were washed two times, resuspended in DMEM. Confluent monolayers of fibroblasts were infected with parasite at a density of 5 × 10⁵ and incubated with 0-50 ug/mL metformin at 37°C in 5% CO2. Infection was allowed to proceed for 24, 48 and 72 hours. The number of live parasites/trypomastigotes and infected host cells in each well was determined with a hemocytometer at 24, 48 and 72 hours post infection. Plates were washed two times with 10% phosphate buffered saline at 37°C, fixed with 4% paraformaldehyde and stained with May-Grunwald-Giemsa according to a standard protocol [16].
Immunoblot analysis
(M-13)
Heart tissues harvested from mice sacrificed 35 days post-infection were sliced, homogenized in an ice-cold lysis buffer containing a protease inhibitor cocktail (Sigma-Aldrich), and centrifuged at 10,000 rpm at 4 °C for 15 min. The protein was estimated in the supernatant using a Bradford assay according to standard protocol, and separated by using sodium dodecyl sulphate-polyacrylamide gel electrophoresis (SDS-PAGE). Proteins were transferred to nitrocellulose membranes (Whatman-GE Healthcare Life Sciences). Membranes were blocked with 5% non-fat milk and 3% bovine serum albumin in phosphate-buffered saline with 0.1% Tween for 60 minutes, and incubated with the appropriate primary antibodies at 4 °C overnight. After appropriate washing steps, membranes were incubated with horseradish peroxidase conjugated secondary antibodies for 60-90 minutes. An enhanced chemiluminescence detection system (Thermo Scientific) was used for developing the immunoblots. Photographic films were used. Scanned immunoblot images were used for densitometric quantification using ImageJ software [17]. Band intensity was normalized to guanine nucleotide dissociation inhibitor band intensity in respective columns. Results are expressed as mean plus or minus the standard error of the mean.
Antibodies
(M-14)
Primary antibodies used for the immunoblotting experiments were anti-AKT dilution-1:5000 (Cell Signaling Technology, Danvers, MA), anti-phospho-AKT (Ser473) dilution-1:5000 (Cell Signaling Technology), anti-GDI dilution-1:3000 (Invitrogen), anti-INF-γ dilution-1:2000 (MAB485, R&D Systems) and anti-TNF-alpha dilution-1:2000 (MAB410, R&D Systems). Secondary antibodies were anti-rabbit IgG, HRP-linked Antibody, anti-mouse IgG, and HRP-linked antibody (Cell Signaling Technology).
Statistical Analysis
(M-15)
The results are shown as means, +/− the standard error of the mean. Statistical analysis was performed using Student's t-test or ANOVA (Microsoft Excel) as appropriate. Due to the uneven distribution of the data, the non-parametric version of t-test (the Mann-Whitney U-test) and non-parametric version of ANOVA (the Kruskal-Wallis test) were used where appropriate. Results were considered statistically significant with a p-value < 0.05.
Results
Mortality
(R-1)
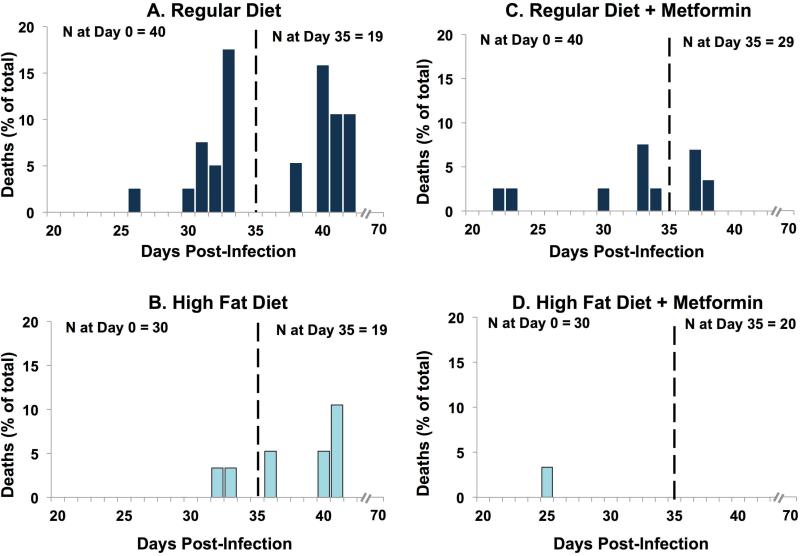
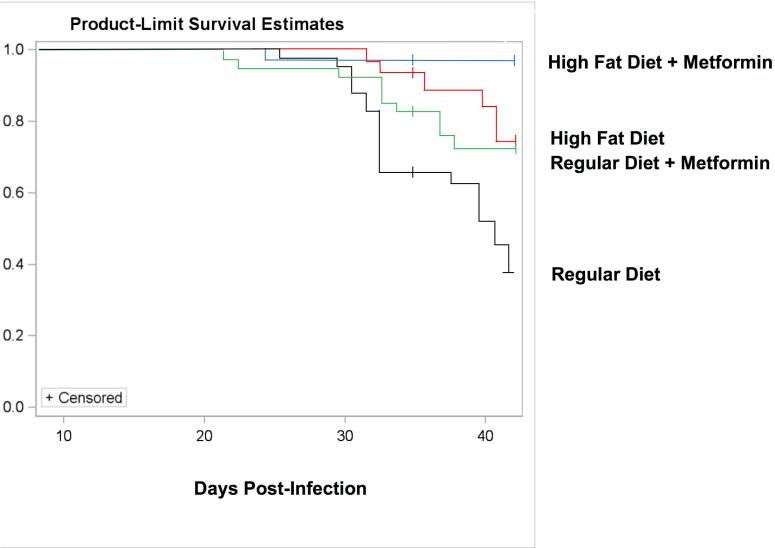
As expected, CD-1 mice fed a regular diet, infected with the Brazil strain of T. cruzi displayed a high mortality rate (Fig. 1A and Fig. 2). The first death in this group occurred on day 26 post-infection (Fig. 1A and Fig. 2). Deaths were recorded until day 42 post-infection, by which time mortality had reached 55%. CD-1 mice fed a high fat diet, which was begun 53 days prior to infection, and continued throughout the study, displayed a markedly attenuated mortality (Fig. 1B and Fig. 2). Overall, the mice on the high fat diet had a death rate of 20% as compared to the mice on the regular diet (55%).
FIGURE 1.
Figure 1. Deaths in infected mice. CD-1 mice were fed a chow diet until they were 5 weeks old. At that time, the mice were placed on either a high fat diet or a matched regular diet for the remainder of the experiment. Fifty-three days later (designated day 0), some of the mice (now 13 weeks old) were infected with Trypanosoma cruzi. Deaths were recorded on each day from day 0 to day 70. Note that on day 35 (marked by the vertical line), some animals were sacrificed for more in-depth study. The height of each bar represents the deaths that occurred on that day, expressed as a percentage of the total animals in that group on day 0 (or animals in that group on day 35 post-sacrifice). No deaths occurred in the uninfected mice. Starting 20 days prior to infection, some mice were given metformin once daily (50 mg/kg by gavage) for the remainder of the experiment.
Figure 2.
Kaplan–Meier survival plot. The same data that were presented in Figure 1 are re-expressed here as a Kaplan–Meier survival curve.
(R-2)
The co-administration of metformin resulted in a marked drop in mortality in both diet groups (Figs. 1C, 1D and 2). In regular diet mice, there was a reduction in mortality from 55% to 25%. In HFD mice, the metformin improved mortality from 20% to 3% (Figs. 1B, 1D and 2).
(R-3)
The goal of the high fat diet was to induce the metabolic syndrome, and thereby to test the hypothesis that the activation of the immune system with the metabolic syndrome would improve the outcomes of T. cruzi infection. We anticipated that the addition of metformin would produce modestly reduced weight, a modest diminution in blood glucose, and a diminution in some features of immune activation. How these and other perturbations would affect survival was difficult for us to predict, given the multiple countervailing effects of fat feeding and of metformin. The marked further improvement in survival observed here with metformin may not occur under other experimental conditions. (If metformin is uniformly effective in T. cruzi infections, we would need to search for a heretofore unknown parasiticidal effect of metformin. In our hands, no such effect was detected in cell culture - see below).
Body Weight
(R-4)
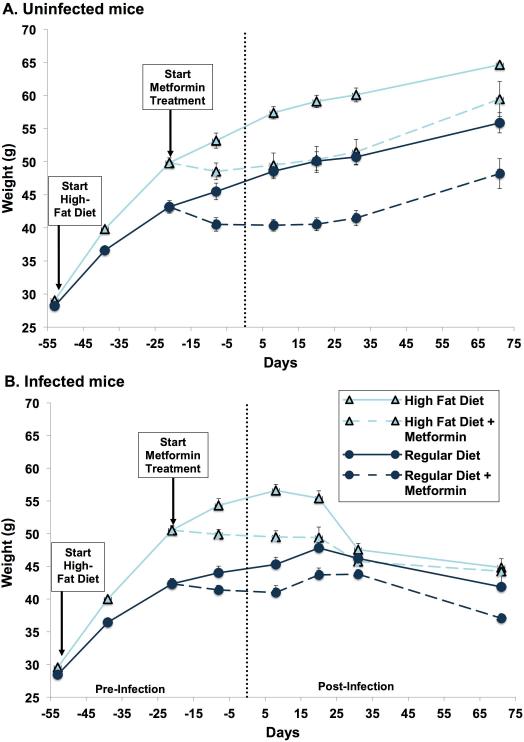
As expected, pre-infection mice fed the high fat diet revealed a much greater weight gain than those on regular diet (Figs. 3A and 3B). In accord with previous data, post-infection, the regular diet mice displayed an attenuation of weight gain and then a modest weight loss (Fig. 3B) in comparison to the uninfected mice (Fig. 3A). High fat diet mice, on day 5 post-infection, began a steep weight loss so that their weights approached those of the infected, regular diet mice (Fig. 3B). This is consistent with the effect of T.cruzi infection on adipocytes [18, 19].
Figure 3.
Body weight. Diets were started 53 days prior to infection. Metformin was started 20 days prior to infection. Both were continued throughout the remainder of the experiment. Each point represents the mean weight (+/ standard error of the mean) of all animals in a given group. (A) Uninfected mice: body weights between regular diet-fed mice and high fat diet-fed mice differed significantly at day minus 39 (p=0.0009) and day minus 11 (p=0.0011). Following metformin treatment, body weight between regular diet, regular diet+metformin, high fat diet and high fat diet+metformin groups continued to differ significantly at days minus 8 (p=0.0061), day 8 (p=0.0353), day 20 (p=0.0353) and day 31 (p=0.0323) but not on day 71 (p=0.0638). (B) Infected mice: body weights between regular diet-fed mice and high-fat diet-fed mice differed significantly at day minus 39 (p<0.0001) and day minus 11 (p<0.0001).
(R-5)
Pre-infection, mice treated with metformin had an initial fall in weight and persistently lower weights than their respective non-metformin treated mice, both with the high fat diet and regular diet (Fig. 3A-B). Post-infection, both the HFD and RD mice treated with metformin showed a gradual and modest weight loss, resulting in somewhat lower weights throughout the course of the experiment in comparison to their respective non-metformin treated mice (Fig. 3B).
Body Composition
(R-6)
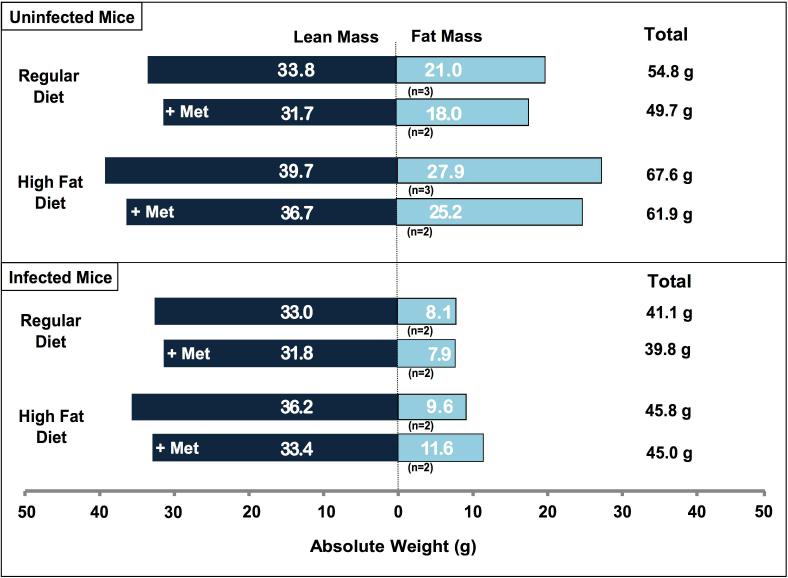
By day 71, RD infected mice weighed 25% less than their uninfected counterparts, consistent with earlier studies. Almost all of this weight loss was due to a reduction in fat mass (Fig. 4). Lean mass was almost entirely preserved. Infected animals on the HFD weighed 32.2% less than their uninfected counterparts, again partly due to a reduction in fat mass (Fig. 4).
Figure 4.
Body composition. Body composition, measured by magnetic resonance spectroscopy, was carried out on live mice (without anaesthesia) to measure fat mass and lean (fat free) mass. The measurements were conducted 70 days post-infection. Mice were selected for body composition studies by choosing those that were at or closest to median weight in each experimental group. (A) In uninfected mice, there was a statistically significant difference in lean mass (p=0.0038) and total weight (p=0.0038) amongst the four diet/treatment groups. No such difference was detected in fat mass (p=0.1208), percent fat mass (p=0.6217) or percent lean mass (p=0.5230). (B) Amongst infected mice, there was a significant difference in total weight amongst the groups (p=0.0095) but not in fat mass (p=0.4762), lean mass (p=0.5619), percent fat mass (p=0.3429) or percent lean mass (p=0.6857).
Fasting Blood Glucose
(R-7)
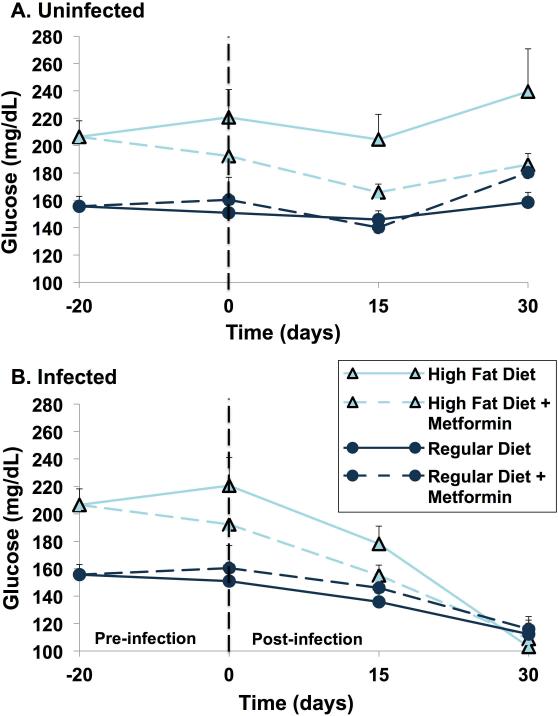
Blood glucose, after a 4 hour fast, was measured 20 days pre-infection and on days 0, 15 and 30 post-infection (Fig. 5). As expected, high fat diet mice had significantly higher four-hour fasting blood glucose levels compared with regular diet mice in both uninfected and infected groups (Fig. 5A-B). In addition, treatment with metformin resulted in a decrease in blood glucose levels in high fat diet mice, regardless of infection status (Fig. 5A-B). This effect was not detected in regular diet mice.
Figure 5.
Fasting glucose measurements. Mice were fasted for 4 h in the morning, after which blood was drawn from ten animals per group (16 animals per group at day minus 20, before the first dose of metformin) for the measurement of blood glucose. Results are expressed as a mean (+/ standard error of the mean). (A) Uninfected mice: fasting glucose levels differed significantly amongst uninfected mice groups at days minus 20 (p<0.0001), day 0 (p=0.021), day 15 (p=0.0004) and day 30 (p=0.019). Pairwise comparisons were performed for day 15 and day 30 using the Bonferroni method of correction for multiple comparisons. For day 15, the following comparisons remained statistically significant: regular diet+metformin versus high-fat diet (p=0.0007), regular diet+metformin versus high-fat diet+metformin (p=0.0036) and between regular diet versus high-fat diet (p=0.0028). For day 30, high-fat diet versus regular diet+metformin remained statistically significant (p=0.0073). (B) Infected mice: fasting glucose levels differed amongst infected mice groups at day minus 20 (p=0.0021) and at day 0 (p=0.0003) but not on day 15 (p=0.0554) or on day 30 (p=0.75).
(R-8)
In high fat diet mice, infection resulted in a progressive and substantial fall in blood glucose levels from around 220 mg/dL at day 0 to 110 mg/dL by day 30 post infection (Fig. 5B). For regular diet mice, the fall in blood glucose post-infection was more modest and gradual. By day 30 post-infection, the blood glucose levels in both groups were nearly identical, despite the slightly greater weight, which can be attributed to fat mass, in the high fat diet mice (Fig. 5B).
Oral Glucose Tolerance Test
(R-9)
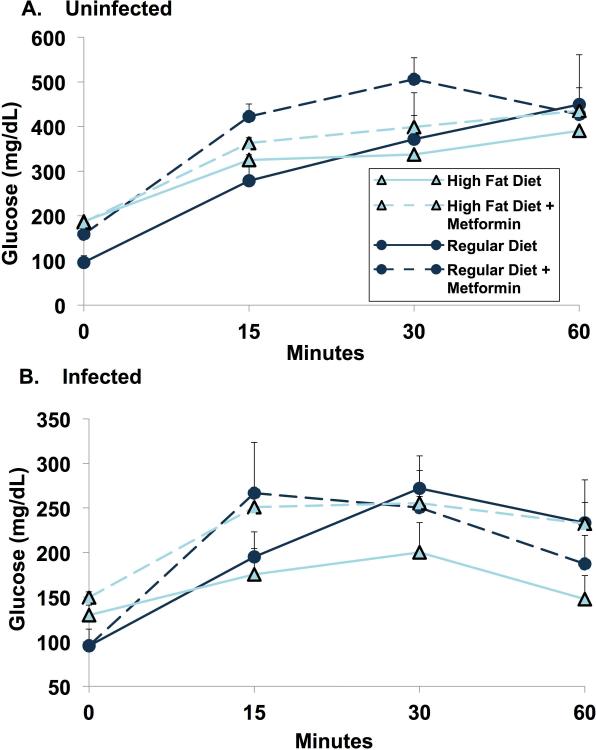
At 28 days post-infection, oral glucose tolerance was determined after a 6 hour fast. To our surprise, there was no difference in glucose tolerance in the uninfected group between regular diet and high fat diet mice. In infected animals, high fat diet mice displayed enhanced glucose tolerance when compared to regular diet mice (Fig. 6).
Figure 6.
Oral glucose tolerance test. Oral glucose tolerance test was carried out on day 28 post-infection after 6-h fasting. Five mice per group were used for each determination. Data are represented as mean glucose plotted against time at 0, 15, 30 and 60 min.
(R-10)
Consistent with four hour fasting glucose levels in post-infection day 30 (Fig. 5), the fasting glucose was highest in the HFD fed animals in both infected and uninfected animals (Fig. 6). The uninfected RD mice had fasting glucose levels about half those of the high fat fed (p = 0.009). RD + metformin had fasting glucose levels that were (to our surprise) about 50% higher than their counterparts without metformin (Fig. 6). At one hour after glucose administration, all uninfected mice showed marked elevations of blood glucose to similar levels, seemingly uninfluenced by the fasting level.
(R-11)
Infected mice (28 days after infection) on RD had fasting blood glucose levels around 100 mg/dL, irrespective of metformin administration (Fig. 6). With HFD, fasting blood glucose was slightly higher (p = 0.028). With HFD, metformin had little effect. Following oral glucose administration (infected mice) with RD, results were similar, with and without metformin. The HFD fed mice, to our surprise, had post glucose levels that were below their normal diet counterparts. Again, unexpectedly, the metformin treated animals were more hyperglycemic (p = 0.226) (Fig. 6).
Day 35 Heart Tissue Cytokine
(R-12) Heart Tissue AKT
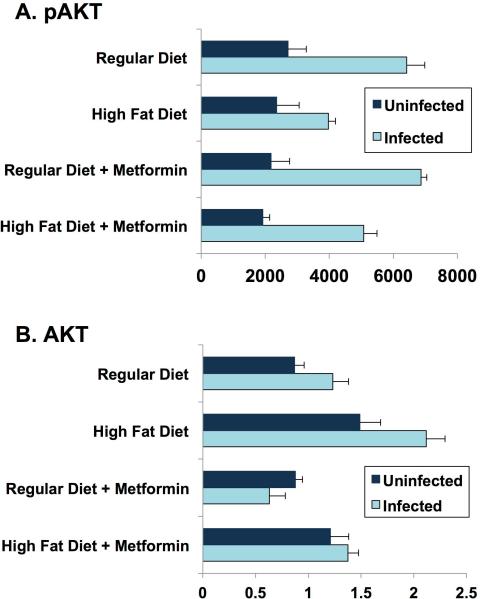
The heart, a classical target for insulin, is a major target of T. cruzi. Akt is a major step downstream of the insulin and IGF-1 receptors, typically associated with the metabolic (rather than growth promoting) effects of these hormones. Previous studies in adipocytes [20] showed two-fold or greater increases in total AKT and phosho-AKT four days post-infection of normal fed mice. In our study at 35 days post-infection, heart tissue displayed a significant increase in pAKT, irrespective of diet or metformin treatment (Fig. 7). Regular diet mice had higher levels of pAKT than high fat diet mice at 35 days post-infection. The effect of metformin was not significant on pAKT. Measurements of total AKT showed much less difference between infected and uninfected. Interestingly, metformin treated infected mice demonstrated a significant reduction of total AKT in both diet groups (Fig. 7). Inflammation is typically linked to insulin resistance. However, it is important to note that with inflammation, insulin sensitivity varies widely from normal to impaired from tissue to tissue and from pathway to pathway in the same tissue.
Figure 7.
AKT/pAKT day 35 post-infection. Quantification of western blot, measuring pAKT and AKT expression in heart tissue at day 35 post-infection, using IMAGEJ software.
(R-13) Interferon gamma
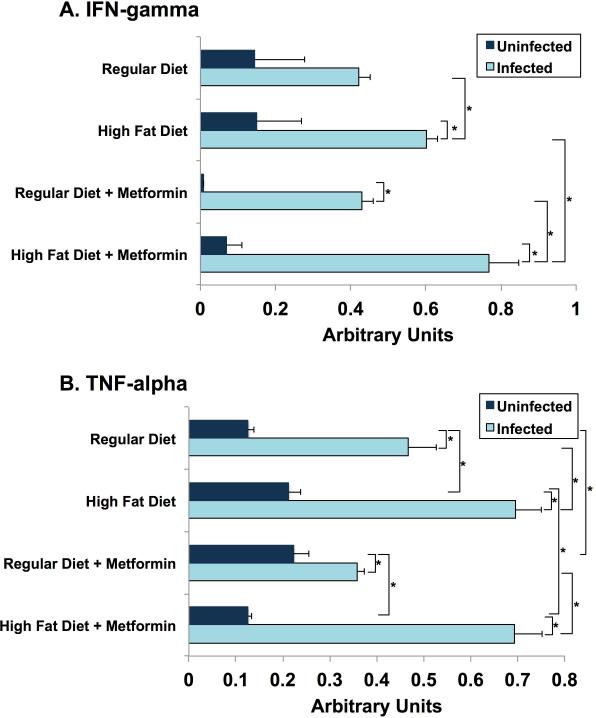
IFN-gamma in hearts obtained from mice sacrificed on day 30 post-infection were several fold (at least 3X) higher in infected mice compared to uninfected mice. Metformin treatment substantially lowered IFN-gamma in the uninfected mice but had no effect in tissue of infected mice (Fig. 8A).
Figure 8.
Cytokine levels in heart tissue day 35 post-infection. Quantification of western blot measuring (A) interferon (IFN)- gamma and (B) tumour necrosis factor (TNF)-alpha expression in heart tissue, using IMAGEJ software.
(R-14) Tumor Necrosis Factor alpha
TNF-alpha levels in hearts on day 30 post-infection were elevated to levels 1.5 to 5 times greater than in uninfected animals. High fat diet in both infected and uninfected mice displayed a significant increase. Metformin did not alter this observation (Fig. 8B).
Hormone Levels at Day 70
Insulin
(R-15)
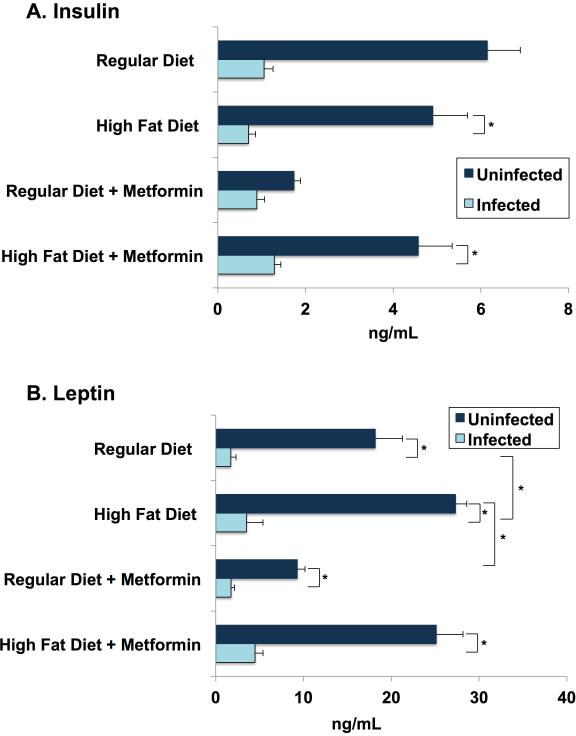
Day 70 plasma hormone levels are reported. In uninfected animals, plasma levels of insulin (4 hour fasting) on post-infection day 70 were very similar for regular diet and high fat diet mice. Metformin in regular diet mice produced a marked lowering of plasma insulin but had no discernible effect in high fat diet mice (Fig. 9A).
Figure 9.
Hormone levels at day 70 post- infection. On day 70 post-infection, blood was collected and processed as described earlier for cytokines. Leptin and insulin levels were determined using mouse leptin and insulin ELISA kits. Each bar represents the mean (+/ standard error of the mean) concentration in nanogramme per millilitre of each experimental group. (A) Insulin: infected mice had significantly lower insulin levels when compared with uninfected mice. (B) Leptin: infected mice had significantly lower leptin levels when compared with uninfected mice. High-fat diet-fed mice also had elevated leptin levels compared with mice on a regular diet, irrespective of metformin treatment.
(R-16)
In the infected mice 70 days post infection, plasma insulin levels were markedly diminished to levels 50% or less than their uninfected counterpart (Fig. 9A). The decreased insulin levels in the infected groups irrespective of the diets fed or drug treatment is likely due to disrupted pancreatic islets (beta-cells) as demonstrated earlier [21]. In addition, leptin levels fell mainly due to the loss in fat cells in infected mice [21]. One possibility is that the very low leptin levels in T. cruzi infected mice mimics the leptin levels found in severe starvation. We suggest that, possibly, with starvation, the low leptin levels we observe cue the fall in plasma insulin to protect against hypoglycemia and prevent shutting down ketone production.
Leptin
(R-17)
At 70 days post-infection, plasma leptin concentrations in the uninfected mice followed the expected pattern (Fig. 9B). The high fat diet mice, who were heavier (Fig. 3) and fatter (Fig. 4), and also had higher leptin levels than their regular diet counterparts (Fig. 9B). The metformin-treated mice weighed less (Fig. 3A-B) and were leaner (Fig. 4) than their non-drug counterparts, but leptin levels reflected this difference only for regular diet mice (Fig. 9B).
(R-18)
With the infected mice, plasma leptin levels were markedly reduced below levels compared with their uninfected counterparts, probably reflecting the dramatic shrinkage of fat stores (Fig. 4). Leptin levels in infected mice fed a high fat diet were about twice as high as in the regular diet infected group (Fig. 9B). These differences in plasma leptin were greater than the differences in weights and body composition in the subgroups of infected animals.
Day 70 Blood Cytokine
(R-19)
Previous studies have shown that the acute phase of T.cruzi infection is associated with higher plasma levels of IL-6, TNF-alpha and IFN-gamma, compared to uninfected mice [22, 23].
(R-20)
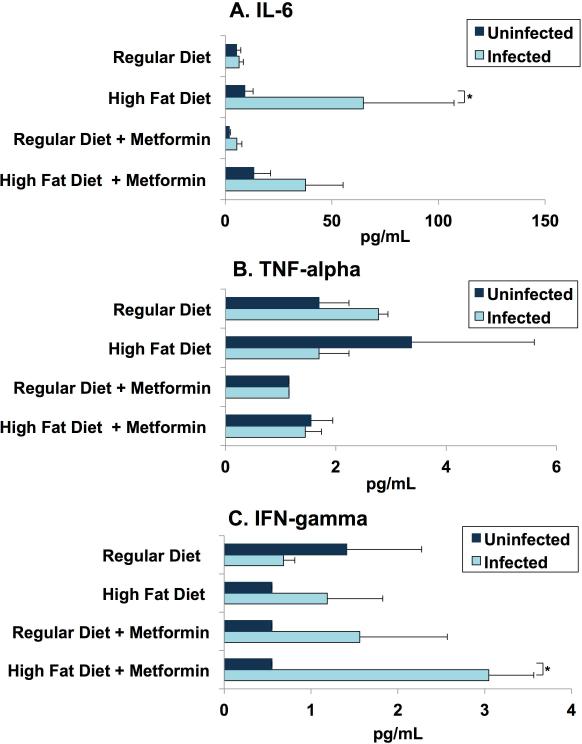
Typically IL-6 production increases during obesity. In our study, CD-1 mice fed a high fat diet, irrespective of their infection status, have elevated serum IL-6 and as expected, infected mice on high fat diet have increased level of IL-6 compared to uninfected mice fed a high (Fig. 8A). There was no significant difference in the regular diet mice irrespective of their infection status. Metformin did not have a significant effect on IL-6 in regular diet mice (Fig. 10A).
Figure 10.
Serum cytokine levels day 70 post-infection. On day 70 post-infection, blood was collected and processed as described earlier. Minimum levels of detection in picogramme per millilitre are 1.1 for interleukin 6 (IL-6), 1.1 for interferon (IFN)-gamma and 2.3 for tumour necrosis factor (TNF)-alpha. Each bar represents the mean (+/ standard error of the mean) concentration in picogramme per millilitre. The number of pools (n=5) is listed for each group. Serum IL-6 (A), TNF-alpha (B) and IFN-gamma (C) levels were determined using Luminex XPONENT for Magpix. (A) IL-6: infected mice fed with an HFD have increased IL-6 levels compared with uninfected mice fed with a HFD and to infected RD-fed mice. No difference is observed between RD-fed infected and RD-fed non-infected groups. (B) TNF-alpha: TNF-alpha levels did not alter significantly between any of the groups, regardless of diet/treatment or infection status. (C) IFN-gamma: serum levels of IFN-gamma were significantly higher in infected HFD mice treated with metformin. Several in vivo and in vitro studies have demonstrated that IFN-gamma enhances macrophage killing of Trypanosoma cruzi and resistance to T. cruzi (Note: our protocol included measuring serum cytokines at day 30, but these specimens were lost during processing).
(R-21)
No significant differences in serum TNF-alpha of uninfected mice in both diet groups were observed at day 70 post infection. Infected mice fed with RD have elevated serum TNF-alpha. No difference is observed in metformin treated mice fed with a high fat diet or a regular diet irrespective of their infection status (Fig. 10B).
(R-22)
IFN-gamma production is shown to correlate with effective control of T. cruzi parasitism [24, 25]. It enhances macrophage killing of T. cruzi in vitro and enhances resistance to T. cruzi. Infected mice fed with a HFD and treated with metformin displayed a significant increase in IFN-gamma especially when compared to metformin treated uninfected mice fed with HFD (Fig. 10C).
Parasitemia
(R-23)
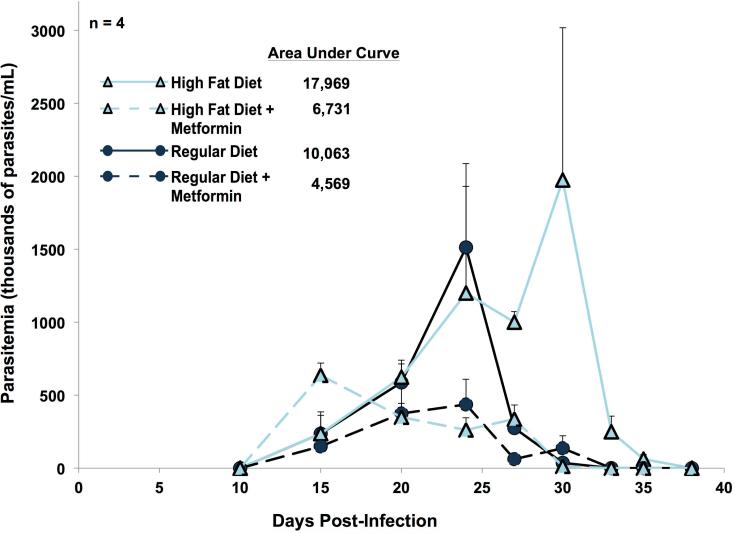
In regular diet mice, parasite levels in blood began to increase 15 days post-infection, reached a peak at day 25, and then fell slowly to undetectable levels by day 33 (Fig. 11). In high fat diet mice, parasitemia reached its peak later (at day 30 post-infection) and cleared the blood rapidly, becoming undetectable by day 38 post-infection. A non-parametric comparison Krustal-Wallis test demonstrated statistical significance (p < 0.01) amongst all four groups on days 27, 30, 33, and 35 post-infection. The high fat diet group had a higher total parasite burden, demonstrated by the higher area under the curve (Fig. 11).
Figure 11.
Parasitaemia. Blood was drawn from four mice per group at intervals from post-infection day 10 to day 38 for measurements of parasites. Each point represents the mean (+ standard error of the mean). The numbers in the key represent the relative areas under each curve. A non-parametric version of analysis of variance, the Kruskal–Wallis test, demonstrated that there was a statistically significant difference in the parasitaemia levels amongst all groups on post-infection days 27 (p=0.0001), day 30 (p=0.0035), day 33 (p=0.0286) and day 35 (p=0.0286).
(R-24)
In both diet groups, parasite levels in blood (expressed as areas under the curve) were about 40% as high with metformin as in its absence (Fig. 11).
Effects of Metformin in Vitro
(R-25)
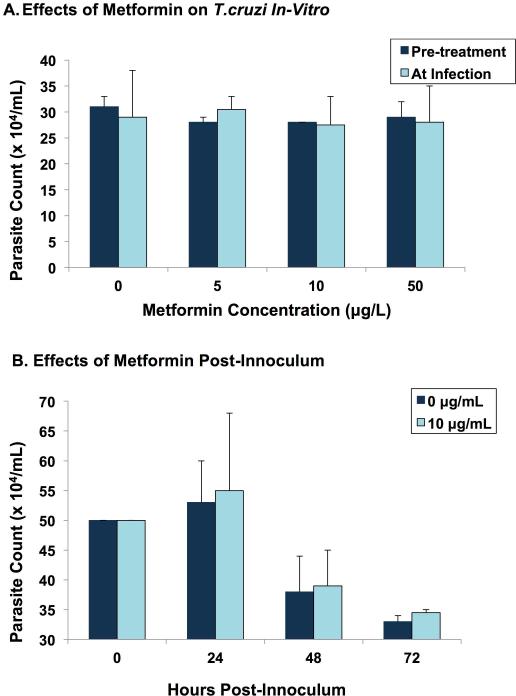
Metformin in vitro had no effect on parasites growing on human fibroblasts when cells were exposed to metformin (up to 50 ug/L) for up to 72 hours (Fig. 12).
Figure 12.
In vitro effects of metformin. (A) Cultured human foreskin fibroblast cell lines were incubated with four different concentrations of metformin (0–50 μg/L). Half of the plates were pre-treated with metformin for 8 h before adding the parasites. In the other half, metformin was added to the plates at the same time parasites were added. Each bar represents the average number of live trypomastigotes in the culture medium (determined by haemocytometer) at 24 h post-inoculum. (B) With metformin at 0 and 10 μg/L, parasite counts were determined after 24, 48 and 72 h. Each bar represents the average number of live trypomastigotes in the medium at each time point after innoculum.
Discussion
(D-1)
The present study constitutes an experiment to test our overarching hypothesis about the close ties that exist between nutrition and host defenses. We hypothesize that the metabolic syndrome represents one part of a rich program that we term the immuno-metabolic coalition that protects the host against infectious invaders. The magnitude of the defense effort is linked to the host's internal measurements regarding availability of calories. With low levels of calorie stores, the host defenses are likely reduced. This phenomenon is often associated with the well-described immune-deficiency of under nutrition; indeed, death from starvation is often due to infection. As calorie stores increase, host defenses likewise increase. With a surfeit of calories, mostly deposited in omentum and viscera, greater activation of the immune system occurs, and brings with it a complex of findings, including those grouped under the rubric of the metabolic syndrome.
(D-2)
Persistence of high levels of the inflammation and other features of the syndrome (hypertension, insulin resistance, disorders of lipids, et al.) over years produces a high prevalence of cardiovascular complications, hyperglycemia, cancer, and other disorders characteristic of the metabolic syndrome and premature aging. Paradoxically, the emergence of hyperglycemia or severe vascular disease may undermine the heightened defenses of the metabolic syndrome.
(D-3)
In the present study, we showed that eight weeks of overfeeding, in the form of a high fat diet, diminished the lethality of T. cruzi in mice from 55% to 20%. This result is consistent with the recently published article from our group; high fat diet mice starting on the day of infection reduced mortality from 60% to 15% [3]. High fat diet started 30 days before infection dropped mortality from 60% to 8% [3]. The benefits of overfeeding were clear, despite the moderate hyperglycemia that accompanied the high fat diet. In our mice, metformin, a medication widely used to control hyperglycemia (and weight gain) in patients with diabetes, further reduced mortality.
(D-4)
We chose CD-1 mice because the course of T. cruzi infection in them is well described [13] and because CD-1 mice mimic the metabolic syndrome when fed a high fat diet [26]. One note of caution: typical high fat diets (as used in experiments here) are exceptionally rich in saturated fats which strongly activate TLR4 receptors [27], probably to a much greater degree than might be observed with more mixed diets of overweight humans.
(D-5)
We avoided congenitally obese rodents e.g. ob/ob; Zucker; db/db, and knockouts in whom leptin or the leptin receptor system was disrupted because leptin action may play a key role in nutrition-related immune activation [28]. Also it has been demonstrated that the disruption in leptin signaling during acute T.cruzi infection increases mortality [29]. We also tried to minimize pathologic hyperglycemia (as may have happened here), fearing that the abnormal glycemia might undermine body defenses.
(D-6)
At the start of the experiment, mice were fed a pre-selected diet for 53 days prior to infection. Their respective diets were continued throughout the course of the experiment. On the day of infection, mice on the high fat diet had an estimated average weight of 55 grams, which was about 25% more than the mice fed a regular diet. After infection, weights of the high fat diet mice fell precipitously but always remained higher than the weights of infected regular diet mice. We failed to track individual animals and therefore do not know whether those destined to die differed in weight from those that survived.
(D-7)
On day of infection, high fat diet mice (after 4 hour fast) on average had higher blood glucose levels (220 mg/dL) compared to regular diet mice (150 mg/dL), consistent with our conclusion that by the time of infection, high fat diet mice had well developed metabolic syndrome, including hyperglycemia. Over the 30 days following infection, glucose levels in blood fell continuously so that blood glucose in high fat diet and regular diet mice converged. In many bacterial infections, there is a stress-induced increase in blood glucose, which was absent here. In T. cruzi infection in mice, hypoglycemia is a well-described observation [21, 30]. There are several possible explanations for these observations. It is possible that the parasite takes up glucose. In addition, Nagajyothi et al. has demonstrated that there is a marked impairment in hepatic gluconeogenesis in the setting of murine Chagas disease, which may help explain the reduction in blood glucose observed here [13]. In our study, in high fat diet mice, with and without infection, metformin treated mice showed modest reductions in blood glucose that did not reach statistical significance.
(D-8)
Our hypothesis was that the metabolic syndrome, brought on by a high fat diet, produces a concatenation of immunological, inflammatory, and metabolic changes that act in congruence to improve the host's defenses to infectious diseases such as T. cruzi infection. In particular, the increase in adipogenesis with the high fat diet presumably contributes to the increased activation of immune system [31]. That the high fat diet mice had less than half the death rate of regular diet mice supports this hypothesis.
(D-9)
Interestingly, despite protecting against mortality, high fat diet is also associated with higher parasitemia. Previously, we demonstrated that infection alone is associated with increased lipolysis and a reduction in fat mass; both processes are reduced by feeding a HFD [3]. In mice infected with T. cruzi and fed a HFD, there is an increase in parasite load in the white adipose tissue and a reduction in parasite load in the heart. Thus, we believe that adipose tissue may potentially act as a “sponge” to take up the parasites, reducing parasite load in the heart.
(D-10)
A weakness in our interpretation derives from the fact that the trypomastigotes use the low-density lipoprotein (LDL) receptor for entry into its major host tissue target, the adipocyte [32]. The metabolic syndrome typically includes elevation in circulating LDL levels [4]; this elevation typically down-regulates the cell surface level of LDL receptors [33]. It is possible that a reduction in LDL receptors contributed to the easing of the infection.
(D-11)
Metformin, very widely used in the treatment of type 2 diabetes, typically reduces blood glucose levels and the effects of the metabolic syndrome. Metformin's best-studied target molecule is AMP-activated protein kinase (AMPK) but other targets have emerged. We treated select mice with metformin to reduce the severity of the metabolic syndrome. The dramatic reduction in mortality in metformin treated mice was unexpected (Fig. 1). That mice treated with metformin had reduced levels of parasites in blood raised the possibility of a direct toxic effect of the drug on the parasites (Fig. 11). That metformin had no effect on the viability of trypanosome in vitro (Fig. 12) suggests that metformin itself is not toxic to the parasites but does not exclude the possibility that in vivo metabolites of metformin might have deleterious effects on the parasite.
(D-12)
Evidence suggests that metformin alters the host organism's production and release of specific cytokines involved in inflammatory responses. Note that metformin activates AMP-activated protein kinase (AMPK) in macrophages [34], and that this activation leads to an inhibition of release of HMGB1, a master cytokine. HMGB1, high mobility group box 1, in addition to being an inflammatory cytokine on its own, is also a stimulator of other mediators of inflammation. It acts downstream on an array of other inflammatory cytokines to orchestrate an organized inflammatory response [35]. Tsoyi et al., 2011 showed that metformin attenuated a pro-inflammatory response in a mouse model of lethal endotoxemia, and therefore improved the survival rate of these mice, through inhibition of HMGB1 protein release [36]. Zhang et al., 2014 demonstrated that metformin protects against cardiomyocyte injuries through inhibiting the expression of high mobility group box 1 (HMGB1) protein and the expression of receptors for advanced glycation end products (RAGE), a signal transduction ligand for HMGB1 [37]. High glucose levels increase the expression of RAGE and HMGB1 through increasing the production of reactive oxygen species (ROS) [38]. Metformin significantly inhibits the production of ROS [39], which suggests that metformin may inhibit the expression of HMGB1 by limiting the production of ROS.
(D-13)
Andrews et al. explain that obese patients treated with metformin had lower levels of C-reactive protein (hsCRP), a marker of inflammation, and decreased expression of tumor-necrosis factor alpha (TNF-alpha), another canonical inflammatory cytokine [40]. This suggests that metformin may alter the mix of inflammatory cytokines to a level that is favorable yet balanced in regards to (i) mounting an immune response against the T. cruzi parasite, while (ii) limiting cell, tissue, and organ damage that result from self-perpetuated inflammation.
(D-12) Future path
Current treatments for Chagas disease, such as nifurtimox and benznidazole, are often only effective in the very early stages of acute infection. These agents can be highly toxic, and resistance to these drugs has been reported. Because metformin as a drug has a long history, few side effects, and low toxicity, it should be considered as an adjunctive therapy. While our studies showed efficacy with acute infection, we have no data beyond the acute stage. Note that most Chagas disease patients are diagnosed in the indeterminate or chronic stage of infection.
(D-13) Conclusions
Our finding that a high fat diet (HFD) producing the metabolic syndrome markedly reduced mortality among mice infected with T. cruzi is consistent with our broadly based hypothesis that immuno-metabolic interactions (or “coalition”) and the associated metabolic syndrome appear to protect against the consequences of many serious infections.
(D-14)
With respect to T. cruzi infection, specifically, additional factors are likely contributors to the effect of high fat diet on this infection. Adipose tissue and heart are two major targets of this infection. The high fat diet, as expected, caused a significant weight gain, largely in the form of expanded fat tissue. The enlarged fat compartment may have acted, figuratively, as a “sponge” (i.e. a preferential site for T. cruzi infection) thereby reducing the parasite load in the heart. Another effect of HFD relates to the LDL receptor, which has been shown to be involved in the mechanism of cell invasion by this parasite. The metabolic syndrome is typically associated with elevated circulating levels of LDL. Elevated LDL typically results in a down regulation of the number of LDL receptors on the surface of cells, a process that can be expected to diminish parasite cell invasion and its pathology. The T. cruzi-specific mechanisms interact with the full menu of events promoted by the high fat diet, both the broad immune activation and the metabolic syndrome.
(D-15)
We hypothesize that the immuno-metabolic interactions including the elements of the metabolic syndrome represent adaptive host responses in times of plenty that allow the host to enhance its response to infections, in particular to chronic infections such as T. cruzi. (We remind the reader that chronic hyperglycemia, deficiencies in leptin signaling, and other conditions that undermine immune function can vitiate this benefit, even in the presense of marked obesity). Before the 20th century, the benefits of the immune activation program far outweighed the untoward effects because of the high prevalence of infections and the shorter life span. Since the advent of the 20th century in developed countries, lethal infections have become much less common, food is more abundant, exercise has become optional, and lifespan has lengthened considerably, reversing the longstanding benefit/harm of these processes.
Acknowledgements
This study was supported by funds from the Feinstein Institute for Medical Research of the North Shore-Long Island Jewish Health System; The Alan and Tatyana Forman Family; and the Russell Berrie Foundation. This work was supported by grants from the National Heart, Lung and Blood Institute (National Institutes of Health HL-112099) to Fnu Nagajyothi.
We are indebted to Yang Fen Ma for expert assistance with tissue culture experiments. We are grateful to Meghan Dancho, Betsy Herold, Ashley Huber, Huan Huang, Regina Kuliawat, Hafiz Basit Mahboob, Gary J. Schwartz, Robin Sgueglia, Hardik Shah, Henry Shikani, Daniel Stein, Mark Westlake, Licheng Wu, and Rama R. Yakubu for their assistance and support. We also thank Simeon Taylor for critical review of the manuscript.
References
- 1.Ribeiro AL, et al. Diagnosis and management of Chagas disease and cardiomyopathy. Nat Rev Cardiol. 2012;9(10):576–89. doi: 10.1038/nrcardio.2012.109. [DOI] [PubMed] [Google Scholar]
- 2.Tanowitz HB, Weiss LM, Montgomery SP. Chagas disease has now gone global. PLoS Negl Trop Dis. 2011;5(4):e1136. doi: 10.1371/journal.pntd.0001136. [DOI] [PMC free article] [PubMed] [Google Scholar]
- 3.Nagajyothi F, et al. High fat diet modulates Trypanosoma cruzi infection associated myocarditis. PLoS Negl Trop Dis. 2014;8(10):e3118. doi: 10.1371/journal.pntd.0003118. [DOI] [PMC free article] [PubMed] [Google Scholar]
- 4.Grundy SM, et al. Definition of metabolic syndrome: Report of the National Heart, Lung, and Blood Institute/American Heart Association conference on scientific issues related to definition. Circulation. 2004;109(3):433–8. doi: 10.1161/01.CIR.0000111245.75752.C6. [DOI] [PubMed] [Google Scholar]
- 5.Sarafidis PA, Nilsson PM. The metabolic syndrome: a glance at its history. J Hypertens. 2006;24(4):621–6. doi: 10.1097/01.hjh.0000217840.26971.b6. [DOI] [PubMed] [Google Scholar]
- 6.Roth J. Evolutionary speculation about tuberculosis and the metabolic and inflammatory processes of obesity. Jama. 2009;301(24):2586–8. doi: 10.1001/jama.2009.930. [DOI] [PubMed] [Google Scholar]
- 7.Roth J, Szulc AL, Danoff A. Energy, evolution, and human diseases: an overview. Am J Clin Nutr. 2011;93(4):875s–83. doi: 10.3945/ajcn.110.001909. [DOI] [PubMed] [Google Scholar]
- 8.Singanayagam A, Singanayagam A, Chalmers JD. Obesity is associated with improved survival in community-acquired pneumonia. Eur Respir J. 2013;42(1):180–7. doi: 10.1183/09031936.00115312. [DOI] [PubMed] [Google Scholar]
- 9.Robert V, et al. Malaria and obesity: obese mice are resistant to cerebral malaria. Malar J. 2008;7:81. doi: 10.1186/1475-2875-7-81. [DOI] [PMC free article] [PubMed] [Google Scholar]
- 10.Beleigoli AM, et al. The “obesity paradox” in an elderly population with a high prevalence of Chagas disease: the 10-year follow-up of the Bambui (Brazil) Cohort Study of Aging. Int J Cardiol. 2013;166(2):523–6. doi: 10.1016/j.ijcard.2012.09.126. [DOI] [PubMed] [Google Scholar]
- 11.Leung CC, et al. Lower risk of tuberculosis in obesity. Arch Intern Med. 2007;167(12):1297–304. doi: 10.1001/archinte.167.12.1297. [DOI] [PubMed] [Google Scholar]
- 12.Hassan GS, et al. Trypanosoma cruzi infection induces proliferation of vascular smooth muscle cells. Infect Immun. 2006;74(1):152–9. doi: 10.1128/IAI.74.1.152-159.2006. [DOI] [PMC free article] [PubMed] [Google Scholar]
- 13.Nagajyothi F, et al. Alterations in glucose homeostasis in a murine model of Chagas disease. Am J Pathol. 2013;182(3):886–94. doi: 10.1016/j.ajpath.2012.11.027. [DOI] [PMC free article] [PubMed] [Google Scholar]
- 14.Nagajyothi F, et al. Curcumin treatment provides protection against Trypanosoma cruzi infection. Parasitol Res. 2012;110(6):2491–9. doi: 10.1007/s00436-011-2790-9. [DOI] [PMC free article] [PubMed] [Google Scholar]
- 15.Morris SA, et al. Verapamil ameliorates clinical, pathologic and biochemical manifestations of experimental chagasic cardiomyopathy in mice. J Am Coll Cardiol. 1989;14(3):782–9. doi: 10.1016/0735-1097(89)90126-5. [DOI] [PubMed] [Google Scholar]
- 16.Ishida Y. Fine structure of primary reticulum cell sacroma of the brain. Acta Neuropathol Suppl. 1975;(Suppl 6):147–53. doi: 10.1007/978-3-662-08456-4_25. [DOI] [PubMed] [Google Scholar]
- 17.Johndrow C, et al. Trypanosoma cruzi infection results in an increase in intracellular cholesterol. Microbes Infect. 2014;16(4):337–44. doi: 10.1016/j.micinf.2014.01.001. [DOI] [PMC free article] [PubMed] [Google Scholar]
- 18.Nagajyothi F, et al. Response of adipose tissue to early infection with Trypanosoma cruzi (Brazil strain). J Infect Dis. 2012;205(5):830–40. doi: 10.1093/infdis/jir840. [DOI] [PMC free article] [PubMed] [Google Scholar]
- 19.Nagajyothi F, et al. Mechanisms of Trypanosoma cruzi persistence in Chagas disease. Cell Microbiol. 2012;14(5):634–43. doi: 10.1111/j.1462-5822.2012.01764.x. [DOI] [PMC free article] [PubMed] [Google Scholar]
- 20.Nagajyothi F, et al. Trypanosoma cruzi infection of cultured adipocytes results in an inflammatory phenotype. Obesity (Silver Spring) 2008;16(9):1992–7. doi: 10.1038/oby.2008.331. [DOI] [PMC free article] [PubMed] [Google Scholar]
- 21.Combs TP, et al. The adipocyte as an important target cell for Trypanosoma cruzi infection. J Biol Chem. 2005;280(25):24085–94. doi: 10.1074/jbc.M412802200. [DOI] [PubMed] [Google Scholar]
- 22.Basso B, et al. Acute Trypanosoma cruzi infection: IL-12, IL-18, TNF, sTNFR and NO in T. rangelivaccinated mice. Vaccine. 2004;22(15-16):1868–72. doi: 10.1016/j.vaccine.2003.11.013. [DOI] [PubMed] [Google Scholar]
- 23.Zhang L, Tarleton RL. Characterization of cytokine production in murine Trypanosoma cruzi infection by in situ immunocytochemistry: lack of association between susceptibility and type 2 cytokine production. Eur J Immunol. 1996;26(1):102–9. doi: 10.1002/eji.1830260116. [DOI] [PubMed] [Google Scholar]
- 24.Antunez MI, Cardoni RL. IL-12 and IFN-gamma production, and NK cell activity, in acute and chronic experimental Trypanosoma cruzi infections. Immunol Lett. 2000;71(2):103–9. doi: 10.1016/s0165-2478(99)00172-8. [DOI] [PubMed] [Google Scholar]
- 25.Rodrigues AA, et al. IFN-gamma plays a unique role in protection against low virulent Trypanosoma cruzi strain. PLoS Negl Trop Dis. 2012;6(4):e1598. doi: 10.1371/journal.pntd.0001598. [DOI] [PMC free article] [PubMed] [Google Scholar]
- 26.Bartolomucci A, et al. Metabolic consequences and vulnerability to diet-induced obesity in male mice under chronic social stress. PLoS One. 2009;4(1):e4331. doi: 10.1371/journal.pone.0004331. [DOI] [PMC free article] [PubMed] [Google Scholar]
- 27.Shi H, et al. TLR4 links innate immunity and fatty acid-induced insulin resistance. J Clin Invest. 2006;116(11):3015–25. doi: 10.1172/JCI28898. [DOI] [PMC free article] [PubMed] [Google Scholar]
- 28.Faggioni R, Feingold KR, Grunfeld C. Leptin regulation of the immune response and the immunodeficiency of malnutrition. Faseb j. 2001;15(14):2565–71. doi: 10.1096/fj.01-0431rev. [DOI] [PubMed] [Google Scholar]
- 29.Nagajyothi F, et al. Crucial role of the central leptin receptor in murine Trypanosoma cruzi (Brazil strain) infection. J Infect Dis. 2010;202(7):1104–13. doi: 10.1086/656189. [DOI] [PMC free article] [PubMed] [Google Scholar]
- 30.Holscher C, et al. Tumor necrosis factor alpha-mediated toxic shock in Trypanosoma cruzi-infected interleukin 10-deficient mice. Infect Immun. 2000;68(7):4075–83. doi: 10.1128/iai.68.7.4075-4083.2000. [DOI] [PMC free article] [PubMed] [Google Scholar]
- 31.Wen JJ, et al. Markers of oxidative stress in adipose tissue during Trypanosoma cruzi infection. Parasitol Res. 2014;113(9):3159–65. doi: 10.1007/s00436-014-3977-7. [DOI] [PMC free article] [PubMed] [Google Scholar]
- 32.Nagajyothi F, et al. Trypanosoma cruzi utilizes the host low density lipoprotein receptor in invasion. PLoS Negl Trop Dis. 2011;5(2):e953. doi: 10.1371/journal.pntd.0000953. [DOI] [PMC free article] [PubMed] [Google Scholar]
- 33.Brown MS, Goldstein JL. Regulation of the activity of the low density lipoprotein receptor in human fibroblasts. Cell. 1975;6(3):307–16. doi: 10.1016/0092-8674(75)90182-8. [DOI] [PubMed] [Google Scholar]
- 34.Nath N, et al. Metformin attenuated the autoimmune disease of the central nervous system in animal models of multiple sclerosis. J Immunol. 2009;182(12):8005–14. doi: 10.4049/jimmunol.0803563. [DOI] [PMC free article] [PubMed] [Google Scholar]
- 35.Lu B, et al. JAK/STAT1 signaling promotes HMGB1 hyperacetylation and nuclear translocation. Proc Natl Acad Sci U S A. 2014;111(8):3068–73. doi: 10.1073/pnas.1316925111. [DOI] [PMC free article] [PubMed] [Google Scholar]
- 36.Tsoyi K, et al. Metformin inhibits HMGB1 release in LPS-treated RAW 264.7 cells and increases survival rate of endotoxaemic mice. Br J Pharmacol. 2011;162(7):1498–508. doi: 10.1111/j.1476-5381.2010.01126.x. [DOI] [PMC free article] [PubMed] [Google Scholar]
- 37.Zhang T, et al. Metformin protects against hyperglycemia-induced cardiomyocytes injury by inhibiting the expressions of receptor for advanced glycation end products and high mobility group box 1 protein. Mol Biol Rep. 2014;41(3):1335–40. doi: 10.1007/s11033-013-2979-3. [DOI] [PubMed] [Google Scholar]
- 38.Yao D, Brownlee M. Hyperglycemia-induced reactive oxygen species increase expression of the receptor for advanced glycation end products (RAGE) and RAGE ligands. Diabetes. 2010;59(1):249–55. doi: 10.2337/db09-0801. [DOI] [PMC free article] [PubMed] [Google Scholar]
- 39.Nishikawa T, et al. Normalizing mitochondrial superoxide production blocks three pathways of hyperglycaemic damage. Nature. 2000;404(6779):787–90. doi: 10.1038/35008121. [DOI] [PubMed] [Google Scholar]
- 40.Andrews M, Soto N, Arredondo M. [Effect of metformin on the expression of tumor necrosis factor-alpha, Toll like receptors 2/4 and C reactive protein in obese type-2 diabetic patients]. Rev Med Chil. 2012;140(11):1377–82. doi: 10.4067/S0034-98872012001100001. [DOI] [PubMed] [Google Scholar]


