Summary
Monocytes/macrophages respond to external stimuli with rapid changes in the expression of numerous inflammation-related genes to undergo polarisation towards the M1 (pro-inflammatory) or M2 (anti-inflammatory) phenotype. We have previously shown that, independently of Toll-like receptor activation, extracellular RNA (eRNA) could exert pro-thrombotic and pro-inflammatory properties in the cardiovascular system and provoked cytokine mobilisation. Here, mouse bone marrow-derived-macrophages (BMDM) differentiated with mouse macrophage-colony-stimulating factor (M-CSF) were found to be skewed towards the M1 phenotype when exposed to eRNA. This resulted in up-regulated expression of inflammatory markers such as Tnf-α and Il-6, together with Il-12 and iNOS, whereas anti-inflammatory genes such as chitinase-like proteins (Ym1/2) and macrophage mannose receptor-2 (Cd206) were significantly down-regulated. Human peripheral blood monocytes were treated with eRNA and analysed by micro-array analysis of the whole human genome, revealing an up-regulation of 79 genes by at least four-fold; 27 of which are related to signal transduction and 15 genes associated with inflammatory response. In accordance with the proposed actions of eRNA as a pro-inflammatory “alarm signal”, these data shed light on the role of eRNA in the context of chronic inflammatory diseases such as atherosclerosis.
Keywords: Extracellular RNA, inflammation, microarray technology, gene expression, monocyte/macrophage polarisation
Introduction
As a major component of the innate defense machinery, monocytes/macrophages respond to external stimuli with rapid changes in their expression of many inflammation-related genes to undergo polarisation towards the M1 (pro-inflammatory) or M2 (anti-inflammatory) phenotype (1). This unique property of macrophages allows these cells to modulate chronic inflammatory processes associated with, for example, vessel degeneration in the context of atherogenesis or to foster immune responses (2). Based on the micro-environment and the type of stimuli, the responses of macrophages are dictated by the primary agonist(s) and their receptor(s) involved (3).
We have previously shown that, independent of Toll-like receptor activation (4, 5), self-induced extracellular RNA (eRNA) could exert pro-thrombotic and pro-inflammatory properties in the cardiovascular system or upon tumour progression and provoked cytokine mobilisation (6). This is exemplified in the context of tumour progression and atherosclerosis (4, 7). However, the specific effects of eRNA on monocytes/macrophages in terms of their polarisation and inflammatory response have not been studied in detail.
Given our recent data showing the association of eRNA with macrophages within atherosclerotic lesions (4), the aims of this study were: (i) to investigate whether eRNA induces inflammatory responses and polarisation changes in human and murine macrophages, (ii) to identify eRNA-triggered gene expression in monocytes by microarray analysis, and (iii) to analyse cytokine secretion profile following eRNA treatment in monocytes/macrophages. Our new data provide strong evidence that exposure to eRNA promotes a robust differentiation of macrophages towards the M1-polarisation and the associated inflammatory response.
Materials and methods
Preparation of human peripheral blood monocytes
Buffy coats from blood donations (Blood Bank of the University Hospital UKGM, Giessen, Germany) were used as source of peripheral blood mononuclear cells (PBMCs), which were isolated by density gradient centrifugation using Ficoll-Paque PLUS (GE Healthcare, Uppsala, Sweden) (8). Subsequently, cells were incubated with micro-beads coated with an anti-CD14 monoclonal antibody (MACS; Miltenyi Biotech, Bergisch-Gladbach, Germany), and monocytes were isolated using a magnetic cell separation system. More than 95 % of the cells were judged to be monocytes by positive staining for CD14 in a flow cytometric analysis using a FACScalibur flow cytometer (Becton-Dickinson, Heidelberg, Germany). Freshly isolated monocytes (1.5 × 10⁶ cells/ml) were allowed to attach by preincubation with RPMI 1640 medium containing 1 % fetal calf serum (FCS) and 1 % penicillin/streptomycin in 5 % CO2 at 37 °C for 2 hours (h) before any treatment. Monocytes were treated for 24 h in the absence (control) or presence of various concentrations of extracellular RNA (eRNA, 1–50 µg/ml), prepared as previously described (4). Briefly, total RNA was isolated from freshly obtained human monocytes or BMDM with GenElute Mammalian Genomica RNA Miniprep Kit (Sigma-Aldrich, Taufkirchen, Germany). Cells were washed once with PBS and extraction was performed according to the manufacturer’s instructions. Extent of cytotoxicity was measured in the supernatants of corresponding cultures by lactate dehydrogenase-detection kit (Roche Diagnostics, Mannheim, Germany) according to the manufacturer’s instructions, and cytotoxicity index was calculated as described (9, 10). Experimental conditions are also outlined in the figure legends.
Cell culture of murine bone marrow-derived macrophages (BMDM)
BMDM were generated from bone marrow cells of C57BL/6J mice in the presence of M-CSF-containing L929-conditioned medium or in the presence of recombinant mouse M-CSF (50 ng/ml) (PeproTech, Rocky Hill, NJ, USA) as described (4). Experiments were carried out as described in figures legends in 6-well trays (1.5 × 10⁶ cells/ml; Costar, Cambridge, MA, USA) in the absence (control) or presence of eRNA (10 µg/ml) (4), LPS (100 ng/ml) (11), IL-4 (10 ng/ml) (12), neutralising antibodies against TNF-α (1 µg/ml) (13) or with the TNF-α-converting enzyme (TACE/ADAM17) inhibitor TAPI (10 µM) (14) as indicated. Control cells were treated with growth medium alone (vehicle). Following treatment for 24 hours (h) in the absence (control) or presence of various concentrations of eRNA (1–50 µg/ml), cell viability in corresponding cultures was assayed using the resazurin assay, as previously described (15). Specific experimental conditions are outlined in the corresponding legends to figures.
Quantification of extracellular RNA (eRNA)
Cell supernatant eRNA was isolated from human peripheral blood monocytes or from BMDM either left untreated or treated with TNF-α (50 ng/ml) (4) and/or IL-6-treated (10 ng/ml) (16) using the Master Pure™ RNA Purification kit (Epicentre Biotechnologies, Madison, WI, USA), including an additional DNA-digestion step. Total RNA concentration was quantified with NanoDrop ND-2000 (peqLab Biotechnologie GmbH, Erlangen, Germany) (17). Quality of cell lysate RNA or supernatant eRNA was determined with the 2100 Bioanalyser using “Eukaryote total RNA Nano Assay” (Agilent Technologies, Böblingen, Germany). All chips were analysed as duplicates.
Quantification of secreted cytokines
Following the indicated incubations under various conditions and at different time intervals, the conditioned medium from each human monocyte or BMDM culture was collected, filtered through a 0.2 µm porous membrane (Sigma-Aldrich, Taufkirchen, Germany) to remove any residual debris and stored at –80 °C. Protein quantification of TNF-α, IL-6, CCL3 and CCL4 was performed in triplicate samples with a commercial ELISA (R&D Systems, Minneapolis, MN, USA). Mouse TNF-α ELISA was performed with commercially available kits from eBioscience (Frankfurt, Germany) according to the manufacturer’s protocol (17). The lower limit of TNF-α, IL-6, CCL3 and CCL4 detection was 5.0 pg/ml. Absorbance values for individual assays were measured with VersaMax™ Microplate Reader, equipped with SoftmaxPro 3.0 data processing software. Total protein concentration was determined using the BCA kit from Thermo-Fisher Scientific (Bonn, Germany). All reagents used were endotoxin-free, as determined by Endosafe Gel-clot LAL Test (Charles River Laboratories, Wilmington, NC, USA), with a sensitivity of 0.03 EU/ml.
Following treatment of human monocytes in the absence (control) or presence of 10 µg/ml eRNA for 6 h, a supernatant proteome/cytokine profiler array (R&D Systems) was performed according to the manufacturer’s protocol.
Stimulation of primary human monocytes and isolation of total RNA
Primary human monocytes isolated from healthy donors were treated for 6 h with eRNA (10 µg/ml) or were left untreated. Monocytes were washed with PBS and total RNA was isolated from stimulated or unstimulated cells using the RNeasy Mini Kit (Qiagen, Hilden, Germany) according to the manufacturer´s instructions.
Microarray hybridisation and data analysis
The Whole Human Genome Oligo Microarray Kit 4×44K v2 (G4845A, design ID 026652, Agilent Technologies) was utilised in this study. Microarrays of this design type contain 44495 probes, covering roughly 26,000 transcripts. Synthesis of Cy3– or Cy5-labelled cRNA was performed with the ‘Amino Allyl Message Amp™ II aRNA Amplification Kit’ (#5190–0444, Life Technologies), according to the manufacturer’s recommendations (applying one round of amplification) except that the proportion of aminoallyl-UTP/UTP was adjusted to 1+11 (instead of 1+1). cRNA fragmentation, hybridisation and washing steps were carried-out exactly as recommended in the ‘Two-Color Microarray-Based Gene Expression Analysis Protocol V5.7’ (Agilent Technologies). Slides were scanned on the Agilent Micro Array Scanner G2565CA (pixel resolution 5 µm, bit depth 20). Data extraction and processing of raw fluorescence intensity values was performed with the ‘Feature Extraction Software V10.7.3.1’ by using the recommended default extraction protocol file: GE2_107_Sep09.xml.
For inter-array normalisation, processed intensity values as generated in the Feature Extraction process, ‘gProcessedSignal’ (gPS) and ‘rProcessedSignal’ (rPS), were further transformed as follows: All PS values (gPS and rPS) of one particular microarray (‘Array i’ in the formula shown below) were multiplied with a microarray-specific scaling factor. This factor was calculated by dividing a ‘reference 75th Percentile value’ (set as 1500 for the whole series) by the 75th Percentile of the gPS values calculated by Feature Extraction software for that microarray. Accordingly, normalised PS values for all samples (microarray data sets) were calculated by the following formula: normalized PSArray i = PSArray i × (1500/75th Percentile gPSArray i)
Finally, a lower intensity threshold was defined as 1 % of the reference 75th Percentile value (= 15). All of those normalised PS values that fell below this intensity border were substituted by the respective surrogate value of 15.
Data were filtered according to the following criteria: 1) More than four-fold up- or down-regulation with eRNA-treatment and a ‘PValueLogRatio’ of < 0.0007 as calculated by Feature Extraction software (each of 4 experiments). 2) Arithmetic mean intensity of nPS values calculated from both channels that define ratio values > 50 (each of 4 experiments). 3) QC flag entries ‘gIsNonUnifOL’ (determined by Feature Extraction software) equals ‘0’ (indicating reliable performance) (each of eight channels of the 4 experiments). Just one representative probe is selected for visualisation in Figure 3 if many probes directed against the same transcript match the applied criteria. The DAVID database (http://david.abcc.ncifcrf.gov), was used to attribute significantly regulated genes to Gene Ontology (GO) biological-process categories (18).
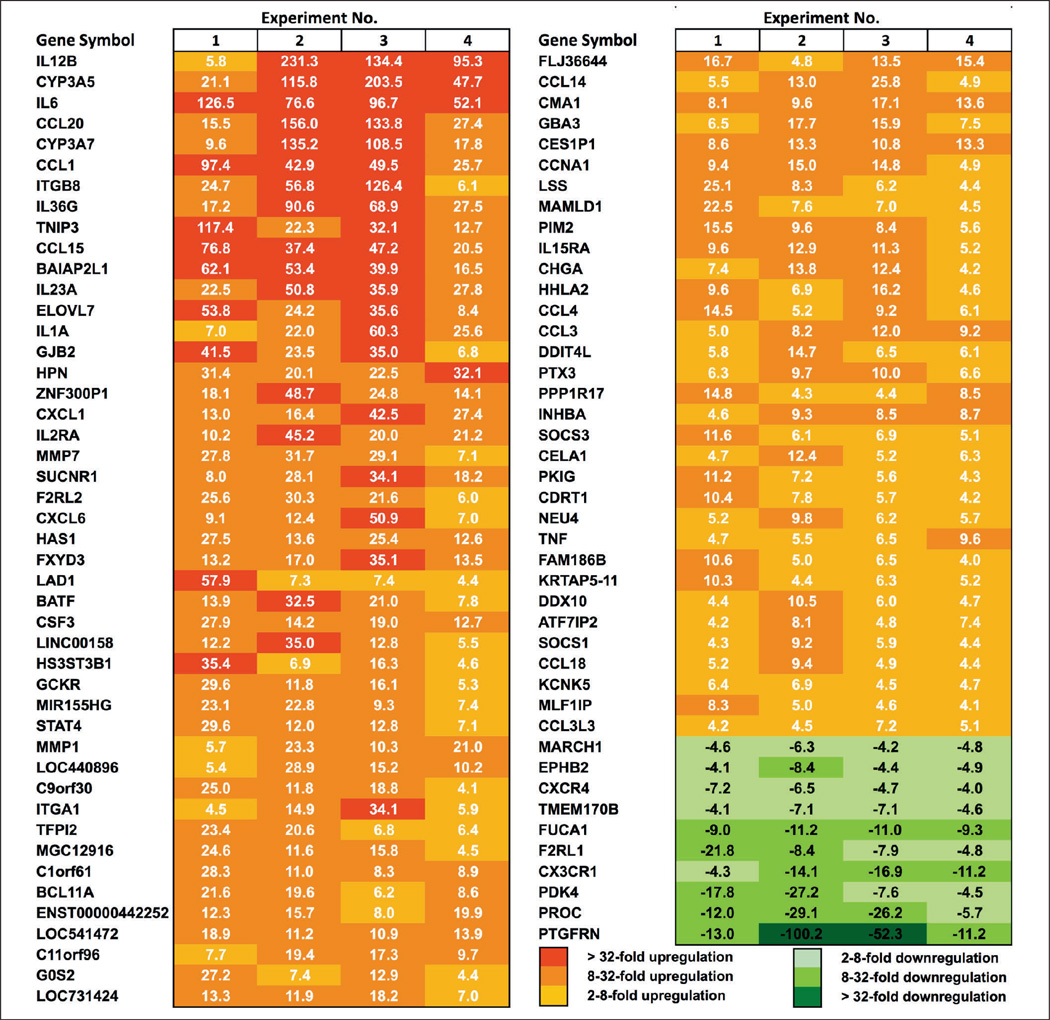
Figure 3. Microarray analysis of genes differentially expressed in eRNA-stimulated vs unstimulated human monocytes.
Monocytes were treated with 10 µg/ml eRNA for 6 h or were left untreated. Total RNA was isolated, labelled cRNA was prepared and hybridised to whole genome Agilent microarrays. Depicted are the top-ranking transcripts most strongly up- or down-regulated upon eRNA-stimulation with at least four-fold difference and p<0.0007 as compared to the control (n=4). Please note that genes of inflammatory cytokines and chemokines in particular are induced more than 20-fold.
Quantitative real time PCR (qRT-PCR)
One µg of DNase-treated total cellular RNA was reverse-transcribed using GoScript™ Reverse Transcription System (Promega, Madison, WI, USA). cDNA fragments were amplified by 45 cycles of PCR (denaturation at 95 °C for 15 seconds (s), annealing at 58 °C for 30 s, and extension at 72 °C for 30 s); the last extension was performed at 50 °C for 2 minutes. The gene products were quantified using SYBR Green assays (Applied Biosystems, Foster City, CA). To determine the differences in expression, the CT values were normalised to reference gene using the ΔΔCt method, normalised for the expression of the reference gene and related to the control treatment. The mRNA signal from β-actin was used for normalisation. For each primer 50 pmol of sample was used (Table 1).
Table 1.
Real-time rat and mice primer-probe sets used for RT-PCR analysis.
| Primer | Forward | Reverse |
|---|---|---|
| h-β-actin | 5’-AGGAAGGAAGGCTGGAAGAG-3´ | 5’-TCCCTGGAGAAGAGCTACGA-3´ |
| h-Il-12 | 5’-CATTCGCTCCTGCTGCTTCAC-3’ | 5’-TACTCCTTGTTGTCCCCTCTG –3’ |
| h-iNos | 5’-ACAAGCTGGCCTCGCTCTGGAAAGA-3’ | 5’-TCCATGCAGACAACCTTGGGGTTGAAG-3’ |
| h-Il-6 | 5’- GGCACTGGCAGAAAACAACC –3’ | 5’- GCAAGTCTCCTCATTGAATCC –3’ |
| h-Mmp-1 | 5’-AGCTAGCTCAGGATGACATTGATG-3’ | 5’- GCCGATGGGCTGGACAG –3’ |
| h-Il-1β | 5’- GAATGACGCCCTCAATCAAAGT –3’ | 5’- TCATCTTGGGCAGTCACATACA –3’ |
| h-Il-1β | 5’- ACAGATGAAGTGCTCCTTCCA –3’ | 5’- GTCGGAGATTCGTAGCTGGAT –3’ |
| h-Il-23 | 5’- TGCAAAGGATCCACCAGGGTCTGA –3’ | 5’- TGAGTGGGATCCTTGAGCTGCTGC –3’ |
| h-Tnf-α | 5’- GTGATCGGCCCCCAGAGGGA –3’ | 5’- ACTGGAGCTGCCCCTCAGCT –3’ |
| h-Ccl3 | 5´-ACTACTTTGAGACGAGCAGCCAG-3´ | 5´-GCCGGCTTCGCTTGGT-3´ |
| h-Ccl4 | 5’- CCGTGTTATTGTATTAGGTG –3’ | 5’- GAATCAAATGTGTTATCCATGT –3’ |
| h-Cxcl2 | 5’- AGCTTGTCTCAACCCCGCATC –3’ | 5’- GGGCAGGGCCTCCTTCAGG –3’ |
| h-Cxcl3 | 5’- CCCCATGGTTCAGAAAATCA –3’ | 5’- ACCCTGCAGGAAGTGTCAAT –3’ |
| m-Cd206 | 5’- CTGCTGCTGAGTCCAGTTTTCTGTC-3’ | 5’-AGCCACTTCCCTTCAACATTTCGG-3’ |
| m-Ym1/2 | 5’- CAGGGTAATGAGTGGGTTGG-3’ | 5’- CACGGCACCTCCTAAATTGT-3’ |
| m-Stat-1 | 5’-ACGCTGGGAACAGAACTAATGA-3’ | 5’-TCTGTCACCAGCATGTTGTACC-3’ |
Primers for m-Tnf-α, m-Il-6, m-Il-12, m-iNos were designed as described (4).
Abbrevations: h- (human), m- (mouse), Il- (Interleukin-), iNos (inducible nitric oxide synthase), Mmp-1 (Matrix metalloproteinase-1), TNF-α (tumour necrosis factor-α), Ccl3 (macrophage inflammatory protein-1β), Ccl3 (macrophage inflammatory protein-1β), Cxcl2 (macrophage inflammatory protein 2-α), Cxcl3 (macrophage inflammatory protein 2-β), Cd206 (mannose receptor).
Statistics
Data were analysed by unpaired one-way ANOVA analysis of variance followed by Tukey’s, Dunnett’s or Bonferroni’s multiple comparisons test, when appropriate, to determine statistical significance of the differences using GraphPad Prism version 6.00 for Mac OS X, GraphPad Software (La Jolla, CA, USA) (www.graphpad.com). Differences with p<0.05 were considered to be statistically significant.
Results and discussion
Inflammatory stimuli induce the release of extracellular RNA (eRNA) in human monocytes and BMDM
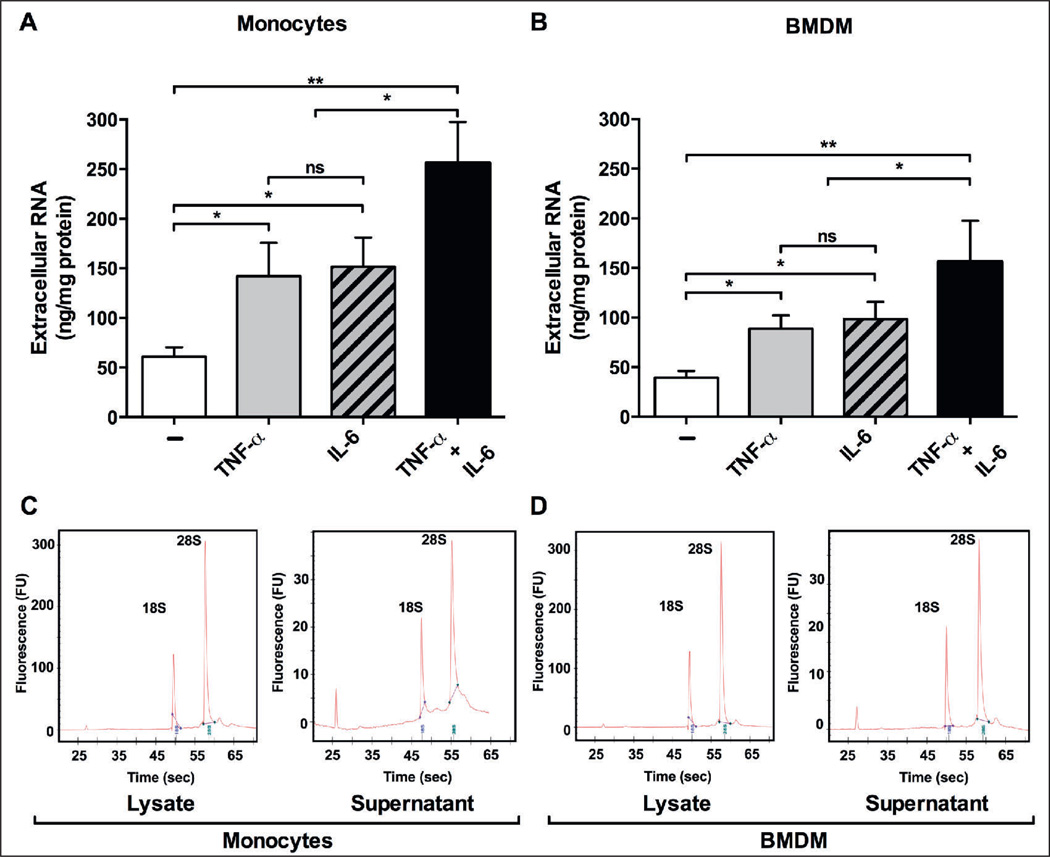
Based on our previous data pertaining to the liberation of eRNA from different tissue cell types upon stimulation with various agonists (4, 7), stimulation of human monocytes (Figure 1A) or murine bone marrow-derived macrophages (BMDM) (Figure 1B) for 6 h with TNF-α and/or IL-6 resulted in a significant increase of eRNA in cell supernatants. The released eRNA was composed predominantly of 18S and 28S ribosomal RNA, and no major differences in the composition were found between cell lysate-derived (intracellular) RNA and cell supernatant eRNA for both cell types (Figure 1C and D). Thus, under stimulatory conditions, monocytes/macrophages may contribute to the amplification of inflammatory responses with the release of eRNA, which in turn may promote production and release of cytokines, particularly TNF-α (14).
Figure 1. Release of eRNA under inflammatory conditions.
eRNA was quantified using the NanoDrop ND-2000 under normoxia (6 h) in supernatants of untreated (−) and TNF-α and/or IL-6-treated monocytes (A) or bone marrow-derived macrophages (BMDM) (B). Values represent mean ± SD (n=6); *p<0.05, **p<0.01. Quality of cell lysate or supernatant RNA, isolated from monocytes (C) or BMDM (D), was determined with the 2100 Bio - analyzer (Agilent Technologies). All chips were analysed as duplicates. Representative analysis reveals high RNA stability, indicated by the 28S and 18S rRNA bands.
eRNA promotes the release of TNF-α, IL-6, CCL3 and CCL4 in human monocytes
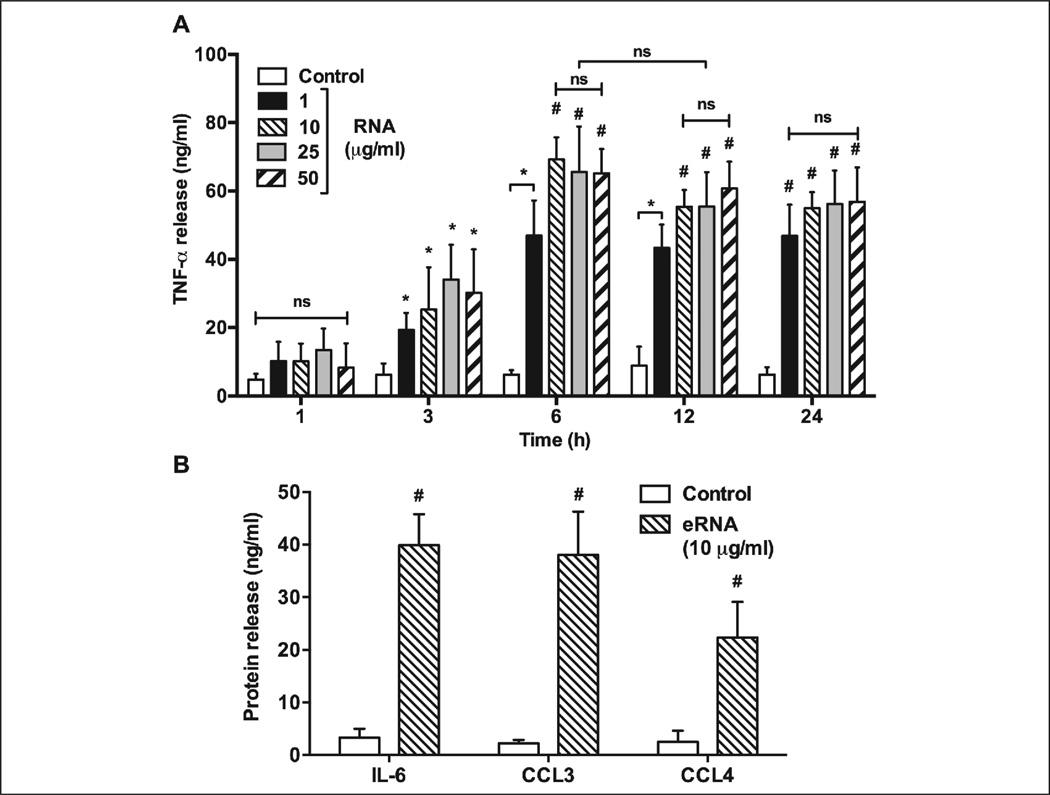
Addition of eRNA led to increased secretion of TNF-α from monocytes over time in a concentration-dependent manner (Figure 2A). While basal levels of TNF-α were already detectable under non-stimulatory conditions (14 ± 2 ng/ml), exposure to eRNA (1–50 µg/ml) followed over time for 24 h resulted in massive increase of TNF-α release, reaching the highest value (70 ± 7 ng/ml vs 15 ± 9 ng/ml for unstimulated cells; p<0.0001) after 6 h treatment with 10 µg/ml eRNA (Figure 2A). Based on this, treatment of monocytes with 10 µg/ml eRNA for 6 h was selected for the following experimental settings. Because eRNA caused increased secretion of IL-6 (40 ± 6 ng/ml vs 3 ± 1 ng/ml for unstimulated cells; p<0.0001), CCL3 (38 ± 8 ng/ml vs 2 ± 0.5 ng/ml for unstimulated cells; p<0.0001) and CCL4 (22 ± 6 ng/ml vs 3 ± 1 ng/ml for unstimulated cells; p<0.0001) simultaneously in the same cell culture supernatants, we expanded the panel of cytokines to be detected from monocytes/macrophages. Using a cytokine profile array system, more than 10 pro-inflammatory cytokines were found to be mediated by eRNA under normoxic conditions (Suppl. Figure 1, available online at www.thrombosis-online.com). Importantly, eRNA treatment (1–50 µg/ml) for 24 h did not induce monocyte cytotoxicity (Suppl. Figure 2, available online at www.thrombosis-online.com).
Figure 2. eRNA-induced release of pro-inflammatory mediators in human monocytes.
A) Monocytes were treated under normoxia in the absence (Control) or presence of different concentrations of eRNA and at various time points as indicated, followed by analysis of TNF-α in corresponding cell supernatants. B) Following 6 h incubation of monocytes in the absence (Control) or presence of eRNA, the release of IL-6, CCL3 and CCL4 was quantified by ELISA in cell supernatants. Values represent mean ± SD (n=5); *p<0.05, #p<0.001 vs Control.
Microarray analysis of eRNA-stimulated human monocytes
To identify the entire panel of eRNA-stimulated genes in human monocytes, a microarray analysis was conducted. Monocytes were stimulated with 10 µg/ml eRNA for 6 h, followed by hybridisation to full genome microarrays (Figure 3). This analysis allowed the identification of 79 genes that were up-regulated and 10 genes that were down-regulated by eRNA stimulation by at least four-fold or more with a p<0.0007 significance level compared to controls in 4 independent experiments. To investigate the functional category of eRNA-regulated genes, a gene ontology analysis was performed using the David database (18). The RNA-induced genes could be arranged into different functional categories with some genes being members of more than one group (Table 2). The largest group contained 27 genes related to signal transduction and a core set of 15 genes that was associated with inflammatory response. Genes related to chemotactic response, regulation of programmed cell death and cell communication, haematopoiesis and haemostasis were also differentially expressed upon exposure of monocytes to eRNA, indicative of the universal nature of this molecular alarm signal in promoting a strong inflammatory response in concert with other microbial and host agonists.
Table 2.
Various biological functional clusters of eRNA-regulated genes in human monocytes.
| Functional annotation |
Number of genes |
eRNA-regulated genes |
|---|---|---|
| Signal transduction | 27 | F2RL2, CXCL1, CSF3, CCL1, CCL3, TNF, F2RL1, IL15, CXCL6, CCL4, STAT4, CCL20, CXCR4, IL15RA, SUCNR1, IL1A, IL6, SOCS3, BAIAP2L1, PKIG, PDK4, SOCS1, ITGA1, CCL15, CCL18, CCL14, CX3CR1 |
| Signal transduction | 15 | CXCL1, CCL3, IL6, IL2RA, TNF, IL15, CXCL6, CCL4, CCL18, IL23A, CCL20, CXCR4, CCL3L3, PTX3, IL1A |
| Chemotaxis | 14 | CCL1, CXCL1, CCL3, IL6, ITGA1, CXCL6, CCL4, CCL15, CCL18, CCL14, CCL20, CXCR4, CX3CR1, CCL3L3 |
| Regulation of programmed cell death | 11 | INHBA, IL6, TNF, IL2RA, SOCS3, ITGA1, PIM2, IL12B, BCL2L11, IL1A, PROC |
| Regulation of cell communication | 10 | INHBA, IL6, TNF, CXCR4, SOCS3, SOCS1, ITGA1, DDIT4L, PIM2, EPHB2 |
| Haematopoiesis | 6 | CSF3, INHBA, TNF, BCL11A, IL15, IL12B |
| Haemostasis | 5 | F2RL2, IL6, F2RL1, TFPI2, PROC |
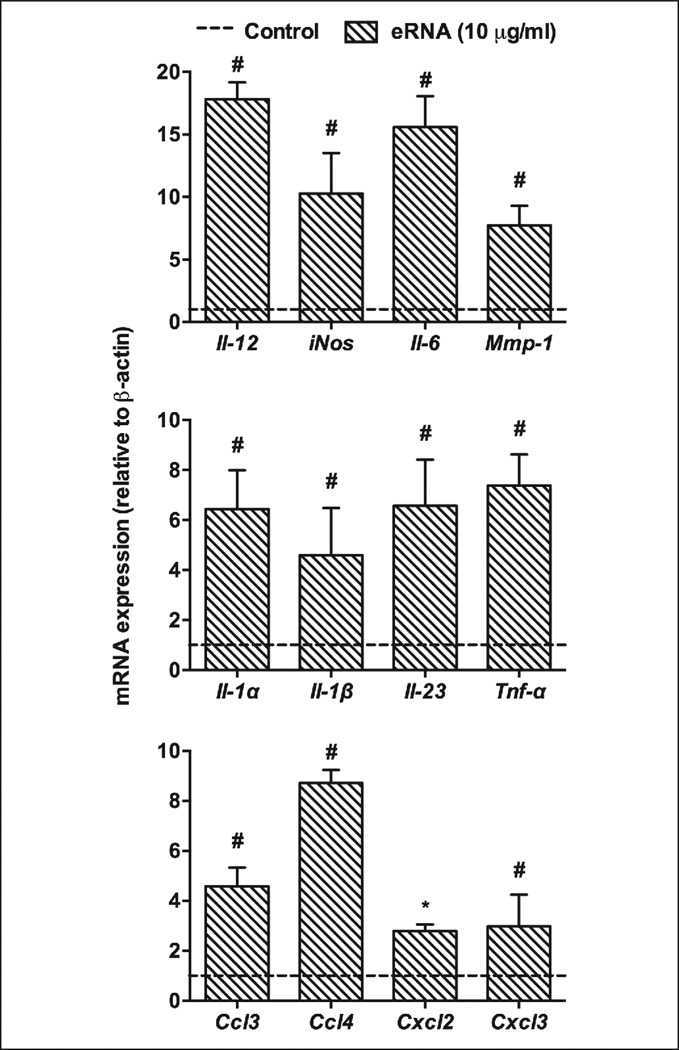
The data obtained from microarray analysis were confirmed by RT-PCR for selected pro-inflammatory genes, Il-12, iNos, Il-6, Mmp-1, Il-1α, Il-1β, Il-23, Tnf-α, Ccl3, Ccl4,Cxcl2 or Cxcl3 (Figure 4). These findings, which corresponded well with the microarray data, demonstrate that eRNA may selectively up-regulate a set of genes that are involved in polarisation of macrophages towards the M1-phenotype to mount a robust inflammatory response. Moreover, in a positive feedback fashion, activated macrophages may also contribute additional eRNA to amplify this process.
Figure 4. Quantitative PCR analysis of pro-inflammatory genes, up-regulated by eRNA in human monocytes.
Following treatment of monocytes with 10 µg/ml eRNA for 6 h, changes in cellular mRNA levels of representative pro-inflammatory mediators were quantified by RT-PCR. The dotted line indicates untreated controls. Data indicate changes in the ratio between target and β-actin mRNA expression relative to the levels in control cells under non-stimulatory conditions and represent mean ± SD from five independent experiments performed in triplicates; *p<0.05, #p<0.01.
eRNA-induced macrophage M1-polarisation
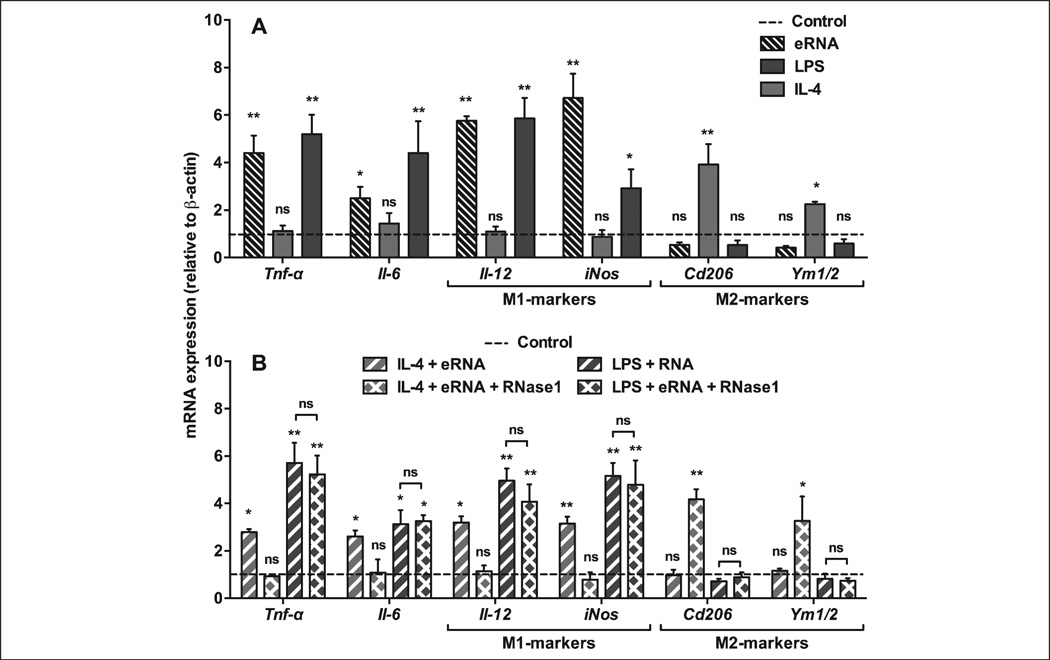
In previous studies, we have demonstrated that exposure of monocytes to eRNA resulted in the induction of TNF-α release, which largely relied on the sheddase “TNF-α-converting enzyme” (TACE/ADAM17) (6). Similarly, in the current study eRNA-mediated TNF-α shedding in BMDM was fully blocked in the presence of the TACE-inhibitor TAPI (Suppl. Figure 3, available online at www.thrombosis-online.com). Upon exposure to e-RNA, M-CSF-mediated differentiation of BMDM into the anti-inflammatory M2-phenotype was switched to the M1-phenotype, resulting in up-regulation of inflammatory markers such as Tnf-α, Arg2, Il-1β, Il-6, Ifn-γ together with Il-12 and inducible nitric oxide synthase (iNos) (4). In BMDM, 10 µg/ml eRNA as well as LPS induced M1-polarisation and up-regulation of pro-inflammatory genes to the same extent (Figure 5A). The combination of eRNA together with LPS either in the absence or presence of RNase1 did not result in different expression levels of pro-inflammatory genes (Figure 5B), indicating that both agonists can interact independently with macrophages to promote M1-polarisation. In comparison, exposure of M2-polarised BMDM to the anti-inflammatory cytokine IL-4 induced the prototypic M2-markers, CD206 and Ym1/2 (Figure 5A, B). However, eRNA in combination with IL-4 was able to promote an inflammatory response that was abolished by RNase1 (Figure 5B). Together, these findings underline the nature of eRNA as a robust pro-inflammatory agonist, although its exact mode of action which may engage several pathways of signal transduction (6, 14) remains to be characterised.
Figure 5. eRNA treatment alters macrophage polarisation markers and pro-inflammatory mediators in BMDM.
A) BMDM were differentiated in the presence of M-CSF-containing L929-conditioned medium and exposed to medium only (Control, dotted line) or to LPS (100 ng/ml), IL-4 (10 ng/ml), or eRNA (10 µg/ml) for 24 h as indicated. B) BMDM were differentiated in the presence of M-CSF-containing L929-conditioned medium and exposed to medium only (Control, dotted line) or to combinations of IL-4 + eRNA and LPS + eRNA in the absence or presence of 1 µg/ml RNase1 (to obtain hydrolysed eRNA) for 24 h as indicated. In all cases, mRNA expression of Tnf-α, Il-6, Il-12, iNos, Cd206 and Ym1/2 was analysed by real-time PCR. Data are expressed as changes in the ratio between target gene and β-actin mRNA expression. The results were obtained from six independent experiments carried out in duplicates. Values represent mean ± SD; ns=non-significant, *p<0.05, **p<0.01 vs control.
Since stimulation of human monocytes (6) and BMDM (4) by eRNA resulted in the release of several cytokines that may act in an autocrine and/or paracrine fashion to amplify an inflammatory response, BMDM were treated with eRNA together with TAPI or antibodies against TNF-α (Suppl. Figure 3, available online at www.thrombosis-online.com). This resulted in a partial (albeit significant) reduction in the expression of representative M1 genes, indicating that not only TNF-α shedding and subsequent autocrine processes are involved, but that eRNA apparently operates via different signalling pathways (6, 14). As controls, treatment of BMDM with various concentrations of eRNA (1–50 µg/ml) for 24 h did not influence cell viability (Suppl. Figure 4, available online at www.thrombosis-online.com).
We next assessed if these effects could be transmitted by Toll-like receptor (TLR)-mediated signalling. Upon stimulation with eRNA, however, no changes in macrophage Stat1 expression (down-stream target of TLR-signalling [19]) were found (Suppl. Figure 5, available online at www.thrombosis-online.com), suggesting that self-eRNA may not be engaged in TLR-2 or TLR-4 signalling. Likewise, no alterations in the mRNA expression of the cytokines studied were observed after poly-IC treatment (data not shown), indicating that TLR-3 did not contribute to eRNA-mediated cytokine induction either. These results are compatible with our previous data that ruled out any contribution of TLR-7 or TLR-8 in eRNA-mediated cell stimulation (14). Thus, eRNA functions as a powerful inducer of inflammatory cytokine responses in macrophages, independent of TLR-activation.
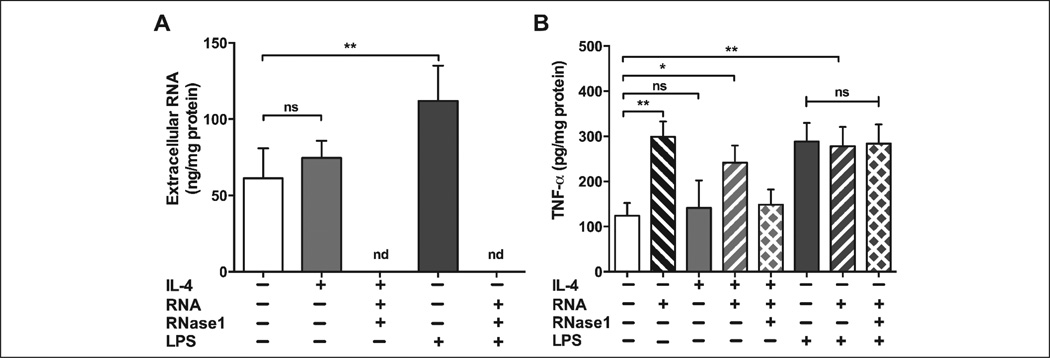
We next questioned whether macrophage polarisation would affect the release of eRNA or TNF-α. Therefore, macrophages were polarised with either IL-4 or with LPS to induce M1 or M2 phenotype, respectively, and assessed for the secretion of eRNA or TNF-α. As shown in Figure 6A, treatment with LPS significantly raised the release of eRNA whereas IL-4 did not induce eRNA release at all. Similarly, TNF-α secretion was significantly augmented by treatment with LPS (to the same level as treatment with eRNA), but not by IL-4 treatment. Although adding eRNA (but not hydrolysed eRNA) boosted the release of TNF-α in M2 macrophages, adding eRNA to M1 macrophages did not affect the release of TNF-α above and beyond that achieved by adding LPS alone (Figure 6B).
Figure 6. Influence of pro- and anti-inflammatory agonists on the release of eRNA and TNF-α from BMDM.
A) Following treatment of BMDM (M2-phenotype) for 6 h with IL-4, eRNA or LPS in the absence or presence of RNase1 (1 µg/ml) as indicated, eRNA in cell supernatants was quantified using the NanoDrop ND-2000. Values represent mean ± SD (n=3), **p<0.01; ns=non-significant, nd=not detectable. B) Following treatment of BMDM for 24 h with IL-4, LPS, eRNA or hydrolysed eRNA (eRNA + RNase1) alone or in combination as indicated, TNF-α protein in cell supernatants was quantified by ELISA. Values correspond to mean ± SD from three independent experiments, each carried out in triplicate, *p<0.05, **p<0.01; ns=non-significant.
In essence, our study shows for the first time that eRNA, derived from various cell types under stress conditions, acts as an alarm signal by mobilising the expression of a plethora of pro-inflammatory genes in monocytes/macrophages that were studied by complementary methods, including microarray analysis. Based on these analytical data, the underlying mechanisms of eRNA recognition by macrophages as well as the subsequent signal transduction pathways can now be investigated.
Supplementary Material
Acknowledgements
We thank Baerbel Fuehler and Juri Schklarenko for their excellent technical assistance, Drs. Laureano de la Vega, Adrian Stachowicz, Barbara Griemert and Oliver Dittrich for helpful discussions. Microarray raw data used or referred to in this publication were generated by the Research Core Unit Transcriptomics of Hannover Medical School. This work was in part supported by the Deutsche Forschungsgemeinschaft (DFG, Bonn, Germany): PROMISEIRTG-1566 and the Excellence Cluster Cardiopulmonary System to K. T. P.; NIH grants HL75677 and HL081863, and Hawaii Community Foundation grant 47037 to W. A. B. Core facilities at the University of Hawaii were supported by NIH grants P20GM103516, P20RR016453, G12RR003061, and G12MD007601.We are grateful for the support of a Fellowship for Experienced Researchers from the Alexander von Humboldt Foundation to M. L. and for the support of a stipend (lab-rotation fellowship) from the “International Giessen-Graduate Centre for the Life Sciences” (GGL) to H. A. C. F. This work was performed within the Russian Government Program of Competitive Growth of Kazan Federal University.
Footnotes
Conflicts of interest
None declared.
References
- 1.Neu C, Sedlag A, Bayer C, et al. CD14-dependent monocyte isolation enhances phagocytosis of listeria monocytogenes by proinflammatory, GM-CSF-derived macrophages. PloS one. 2013;8:e66898. doi: 10.1371/journal.pone.0066898. [DOI] [PMC free article] [PubMed] [Google Scholar]
- 2.Leitinger N, Schulman IG. Phenotypic polarisation of macrophages in atherosclerosis. Arterioscl Thromb Vasc Biol. 2013;33:1120–1126. doi: 10.1161/ATVBAHA.112.300173. [DOI] [PMC free article] [PubMed] [Google Scholar]
- 3.Davis MJ, Tsang TM, Qiu Y, et al. Macrophage M1/M2 polarisation dynamically adapts to changes in cytokine microenvironments in Cryptococcus neoformans infection. mBio. 2013;4:e00264–e00213. doi: 10.1128/mBio.00264-13. [DOI] [PMC free article] [PubMed] [Google Scholar]
- 4.Simsekyilmaz S, Cabrera-Fuentes HA, Meiler S, et al. Role of extracellular RNA in atherosclerotic plaque formation in mice. Circulation. 2014;129:598–606. doi: 10.1161/CIRCULATIONAHA.113.002562. [DOI] [PMC free article] [PubMed] [Google Scholar]
- 5.Simsekyilmaz S, Cabrera-Fuentes HA, Meiler S, et al. Response to letter regarding article „role of extracellular RNA in atherosclerotic plaque formation in mice“. Circulation. 2014;130:e144–e145. doi: 10.1161/CIRCULATIONAHA.114.012346. [DOI] [PubMed] [Google Scholar]
- 6.Fischer S, Grantzow T, Pagel JI, et al. Extracellular RNA promotes leukocyte recruitment in the vascular system by mobilising proinflammatory cytokines. Thromb Haemost. 2012;108:730–741. doi: 10.1160/TH12-03-0186. [DOI] [PubMed] [Google Scholar]
- 7.Fischer S, Cabrera-Fuentes HA, Noll T, et al. Impact of extracellular RNA on endothelial barrier function. Cell Tissue Res. 2014 doi: 10.1007/s00441-014-1850-8. Epub ahead of print. [DOI] [PubMed] [Google Scholar]
- 8.Lopez ML, Bruges G, Crespo G, et al. Thrombin selectively induces transcription of genes in human monocytes involved in inflammation and wound healing. Thromb Haemost. 2014;112:992–1001. doi: 10.1160/TH14-01-0034. [DOI] [PubMed] [Google Scholar]
- 9.Cabrera-Fuentes HA, Aslam M, Saffarzadeh M, et al. Internalisation of Bacillus intermedius ribonuclease (BINASE) induces human alveolar adenocarcinoma cell death. Toxicon. 2013;69:219–226. doi: 10.1016/j.toxicon.2013.03.015. [DOI] [PubMed] [Google Scholar]
- 10.Saffarzadeh M, Juenemann C, Queisser MA, et al. Neutrophil extracellular traps directly induce epithelial and endothelial cell death: a predominant role of histones. PloS one. 2012;7:e32366. doi: 10.1371/journal.pone.0032366. [DOI] [PMC free article] [PubMed] [Google Scholar]
- 11.Whyte CS, Bishop ET, Ruckerl D, et al. Suppressor of cytokine signalling (SOCS)1 is a key determinant of differential macrophage activation and function. J Leuk Biol. 2011;90:845–854. doi: 10.1189/jlb.1110644. [DOI] [PubMed] [Google Scholar]
- 12.Gao S, Wang L, Liu W, et al. The synergistic effect of homocysteine and lipopolysaccharide on the differentiation and conversion of raw264.7 macrophages. J Inflam. 2014;11:13. doi: 10.1186/1476-9255-11-13. [DOI] [PMC free article] [PubMed] [Google Scholar]
- 13.Dreschers S, Gille C, Haas M, et al. Infection-induced bystander-apoptosis of monocytes is TNF-alpha-mediated. PloS one. 2013;8:e53589. doi: 10.1371/journal.pone.0053589. [DOI] [PMC free article] [PubMed] [Google Scholar]
- 14.Fischer S, Gesierich S, Griemert B, et al. Extracellular RNA liberates tumour necrosis factor-alpha to promote tumour cell trafficking and progression. Cancer Res. 2013;73:5080–5089. doi: 10.1158/0008-5472.CAN-12-4657. [DOI] [PubMed] [Google Scholar]
- 15.Colak G, Johnson GV. Complete transglutaminase 2 ablation results in reduced stroke volumes and astrocytes that exhibit increased survival in response to ischemia. Neurobiol Dis. 2012;45:1042–1050. doi: 10.1016/j.nbd.2011.12.023. [DOI] [PMC free article] [PubMed] [Google Scholar]
- 16.Biswas P, Delfanti F, Bernasconi S, et al. Interleukin-6 induces monocyte chemotactic protein-1 in peripheral blood mononuclear cells and in the U937 cell line. Blood. 1998;91:258–265. [PubMed] [Google Scholar]
- 17.Cabrera-Fuentes HA, Ruiz-Meana M, Simsekyilmaz S, et al. RNase1 prevents the damaging interplay between extracellular RNA and tumour necrosis factor-alpha in cardiac ischaemia/reperfusion injury. Thromb Haemost. 2014;112:1110–1119. doi: 10.1160/TH14-08-0703. [DOI] [PubMed] [Google Scholar]
- 18.Dennis G, Jr, Sherman BT, Hosack DA, et al. DAVID: Database for Annotation, Visualisation, and Integrated Discovery. Genome Biol. 2003;4:P3. [PubMed] [Google Scholar]
- 19.Rhee SH, Jones BW, Toshchakov V, et al. Toll-like receptors 2 and 4 activate STAT1 serine phosphorylation by distinct mechanisms in macrophages. J Biol Chem. 2003;278:22506–22512. doi: 10.1074/jbc.M208633200. [DOI] [PubMed] [Google Scholar]
Associated Data
This section collects any data citations, data availability statements, or supplementary materials included in this article.


