Abstract
Systems biology addresses challenges in the analysis of genomics data, especially for complex genes and protein interactions using Meta data approach on various signaling pathways. In this paper, we report systems biology and biological circuits approach to construct pathway and identify early gene and protein interactions for predicting GPR142 responses in Type 2 diabetes. The information regarding genes, proteins and other molecules involved in Type 2 diabetes were retrieved from literature and kinetic simulation of GPR142 was carried out in order to determine the dynamic interactions. The major objective of this work was to design a GPR142 biochemical pathway using both systems biology as well as biological circuits synthetically. The term ‘synthetically’ refers to building biological circuits for cell signaling pathway especially for hormonal pathway disease. The focus of the paper is on logical components and logical circuits whereby using these applications users can create complex virtual circuits. Logic gates process represents only true or false and investigates whether biological regulatory circuits are active or inactive. The basic gates used are AND, NAND, OR, XOR and NOT gates and Integrated circuit composition of many such basic gates and some derived gates. Biological circuits may have a futuristic application in biomedical sciences which may involve placing a micro chip in human cells to modulate the down or up regulation of hormonal disease.
Electronic supplementary material
The online version of this article (doi:10.1007/s11693-015-9163-0) contains supplementary material, which is available to authorized users.
Keywords: Biological circuits, BioLogic, GPR142, Systems biology, Type 2 diabetes
Introduction
Biological circuit, which encompasses components of electronics, genomics, proteomics, bioinformatics and biotechnology, has evolved as a cross disciplinary field in bioinformatics. A combined approach involving biological circuits and systems biology can aid in modulating complete pathway system, thereby, controlling regulatory disease. Recent research of cell behavior together with progress in the underlying regulatory genotypic networks has led to new understanding of three way switch (Lu et al. 2014; Jolly et al. 2014; Kiel et al. 2010). The engineering of biological circuits especially in circuit designing for signaling pathway is emerging as a thrust area (Becskei and Serrano 2000). The major difference between biological circuits and systems biology is that systems biology works on cell signal transduction while biological circuits are based on biological network represented by GATEs connecting one another and generating a Boolean output (Kierzek et al. 2001). Manipulating DNA can be harder to implement on biological circuits while protein manipulation is moderately easier. Therefore, the up and down regulation of proteins, involved in regulatory disorders, can be modulated using three –way switches in biological circuits allowing not only for phenotypes but also for a hybrid approach (Huang et al. 2014;. Krishnan and Purdy 2005, 2013). For example, Rac1 and RhoA (small GTPases) act as molecular switches by changing between their active and inactive forms. Rac1/RhoA regulatory circuit can act as a three-way switch: high active RhoA/low active Rac1, low active RhoA/high active Rac1, and both high active RhoA and Rac1. (Huang et al. 2014) Activation and deactivation of signaling pathway is also dependent upon the biological circuits (Huang et al. 2014; Kiel et al. 2010). Massive biological data is being generated by genomic research. Biological circuits have emerged as a new discipline that addresses the need to manage these data and interpret the signals in form of circuits. General biological model represents a novel principle for linking regulatory circuits (Andrecut et al. 2011; Goldental et al. 2014). Biochemical signaling networks exhibit integration of signals across multiple time scales (Bhalla and Iyengar 1999). Using such type of tool user can create a regulatory system on the basis of logical Gates and input Boolean type value for all sub unit as well as large unit, followed by simulation of entire system (McMillen et al. 2002). This can facilitate the researchers in predicting and validating the presence or absence of ions, genes and proteins for signaling pathway and converting it to an analog output which can generate continuous levels of gene expression as well as protein expression (Densmore and Hassoum 2012). Artificial synthetic circuits could suggest better control of biological expression over the production of regulatory system, genes expression, proteins expression, chemical signals, cells, organs or entire system. Particularly, in the area of drug discovery it can be applied for the target specification as well as drug specification on the basis of interactions in virtual circuits (Hasty et al. 2001; Davidson et al. 2002). Researchers can also create environmental sensors based on biological circuits. Logic based circuits that generate more complex state dependent responses are of significance. (Ozbudak et al. 2002). In this paper, we report the designing of a synthetic signal transduction pathway of G protein-coupled receptor (GPCR) circuits and implementation of Boolean logic functions for its validation. The results of the systems biology and biological circuits have been correlated and are in agreement. We have developed a Java based application of this strategy to create biological circuits based on regulatory system, assignment of Boolean logic input for all unit and sub unit, simulation and finally generation of valid output in form of analog. The main objective of this paper is to construct a GPR142 regulatory pathway using system biology and biological circuits approach.
Methodology
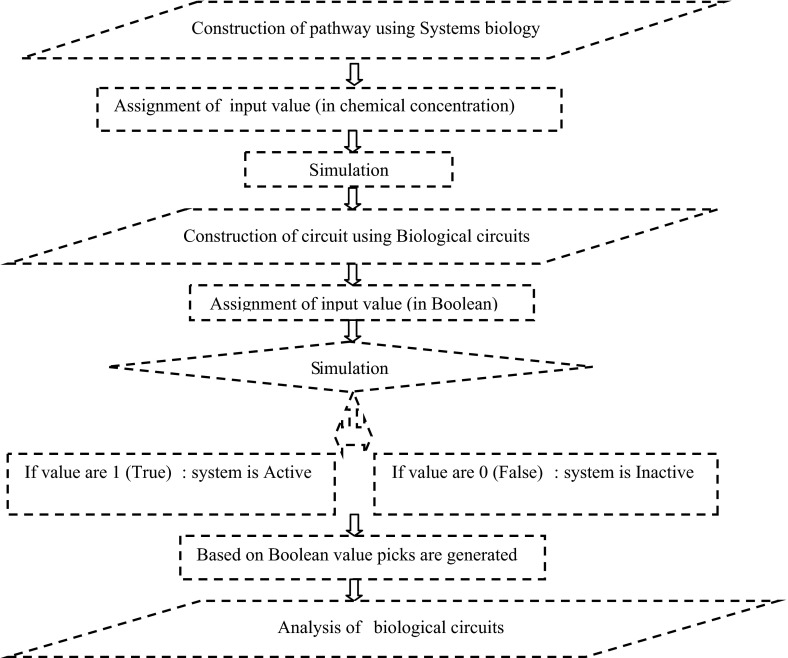
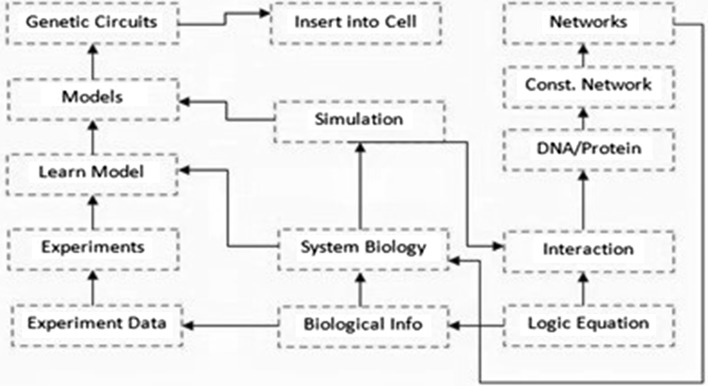
The methodology followed is depicted in the flow chart in Fig. 1
GPCRs data and information regarding concentration of all species (genes, truncating proteins, generic proteins, some GPCR proteins, other proteins, ions and other molecules) was collected from databases like IUPHAR (Harmar et al. 2009), KEGG (Kanehisa and Goto 1999; Kanehisa et al. 2014) and from other literature (Muto et al. 2013; Moriya et al. 2007, 2010; Yamanishi et al. 2009; Kanehisa 1996, 1997; Kanehisa et al. 2002, 2004, 2006, 2008; 2010, 2012, 2014; Kanehisa 2002; Goto et al. 1997; Ogata et al. 1999; Okuda et al. 2008; Kotera, et al. 2012; Nakaya et al. 2013; Hattori et al. 2003, 2010; Oh et al. 2007).
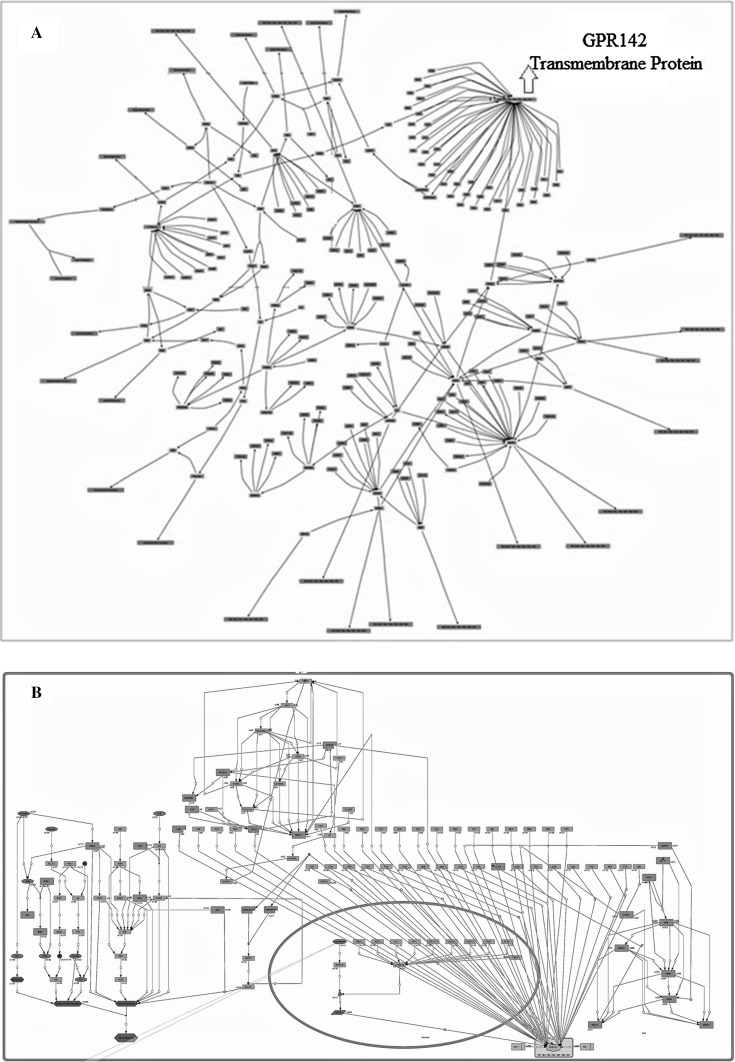
A complete pathway of GPR142 was constructed (Fig. 2a, b) using information involving different genes, truncating proteins, generic proteins, ions and other molecules which interact with GPR142 receptor against Type 2 diabetes within cell compartment. Green nodes in the pathway represent the entities of genes, truncating proteins, generic proteins, ions and other molecules; gray lines represent the connectivity of one node to another node and sub branches represent the attributes which are closely related to each other. The nucleus of the cell indicating the transcription process within cells or virtual pathway construction in whole system is represented as small rectangular part. GPR142 genes which are transformed into mRNA via transcription, move outside the nucleus and get attached to cell membrane (receptor) and interact with other proteins and genes, thus, making up a biochemical pathway within cell which is involved in signal transduction. The whole pathway was constructed using Cell Designer (Funahashi et al. 2003, 2007, 2008) software.
In order to carry out kinetic simulation the input values were assigned in form of chemical concentration and either kinetic irreversible simple Michaelis–Menten equation or mass action kinetics equation was applied.
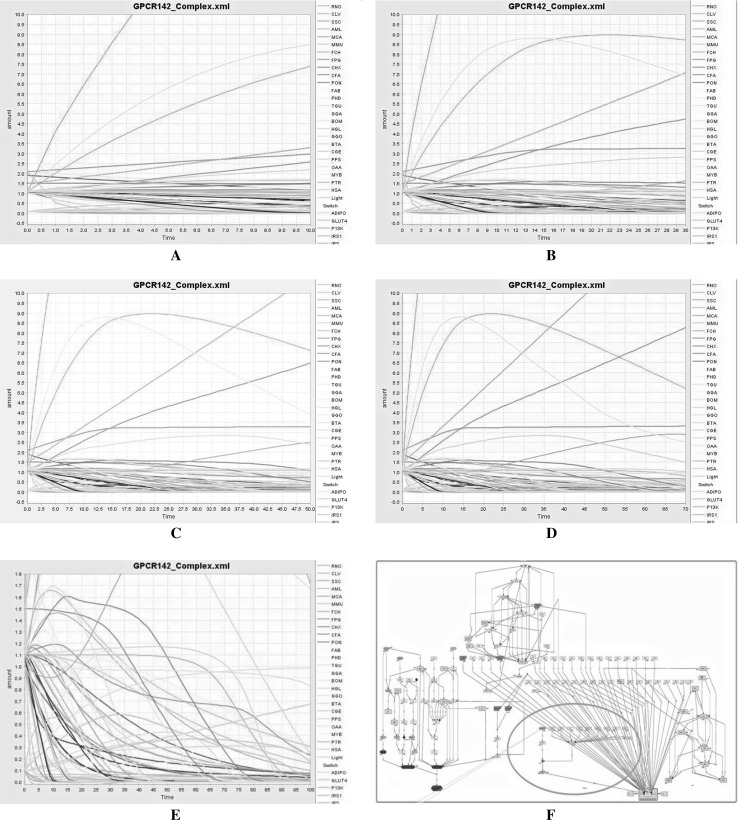
The kinetic simulation was carried out with respect to transition time of all species and those kinetic simulation responses in which genes and proteins interact with each other were identified using systems biology approach. Interaction of GPR142 protein with GPR139, GPR39, GPR78 were identified using GEPASI (Arkin and McAdams 1998; Mendes 1993) approach. Kinetic simulation graph is described below in (Fig. 3). The simulation graph between amount of species and time is represented in different colors. X axis represents the time of the species which is species transition time with respect to amount of species, whereas Y axis represents the amount (concentration) of the species which is concentration rate with respect to time of the species.
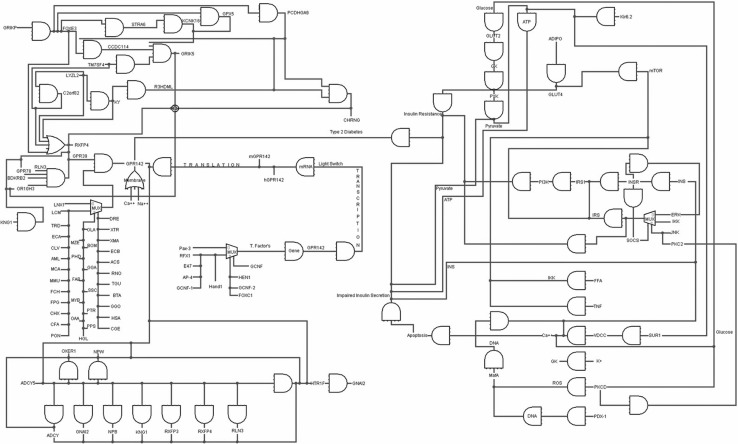
BioLogic circuit of whole system was constructed showing the interactions of GPR142 receptor within cell with other proteins/genes (Fig. 4), using Logisim (Burch 2002).
The input values were assigned in form of Boolean, the basic input and output tables are described in (Table 1).
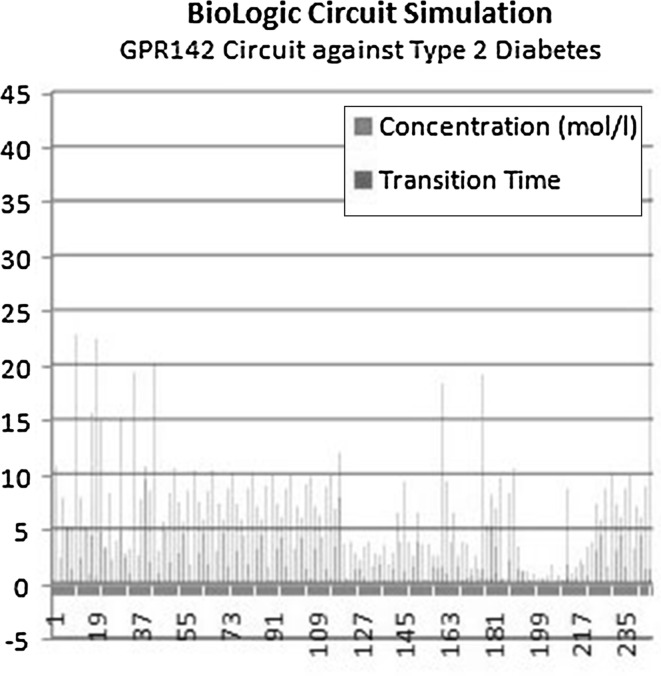
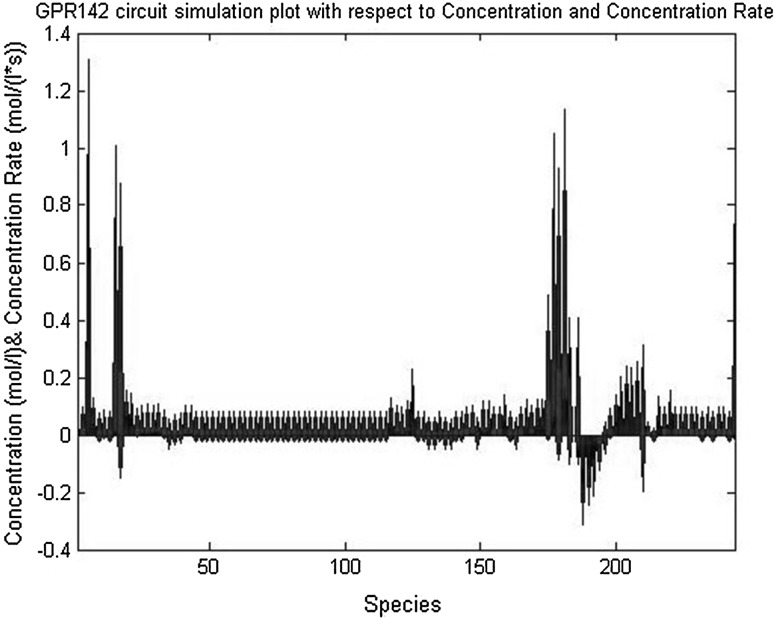
The BioLogic circuit simulation with respect to transition time of all species and concentration was carried out as shown in (Fig. 5). GPR142 circuit simulation with respect to concentration rate time and concentration was carried out as shown in (Fig. 6).
The true values indicated that BioLogic circuit was active otherwise false that is circuit was in inactive form.
Fig. 1.
Flow diagram of pathway construction using both system and biological circuits approach
Fig. 2.
a Complete pathway of GPR142 which are involved into Type 2 diabetes diseases. b GPR142 whole pathway system (native state) which are interact into Type 2 diabetes diseases
Fig. 3.
Kinetic simulation of whole systems where GPR142 protein interact to Type 2 diabetes, different–different lines are represents the concentration amount of different species, where X axis represents the time of simulation and Y axis represents the concentration amount of species (gene, proteins and other molecules). (Color figure online)
Fig. 4.
BioLogic circuits of whole system where Type 2 diabetes are interact to GPR142 receptor
Table 1.
Comparative analysis between systems biology and biological circuits
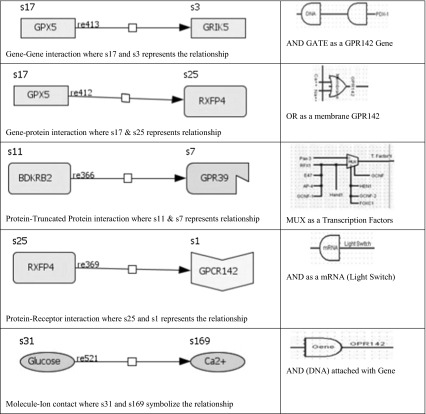
Fig. 5.
GPR142 circuit against Type 2 diabetes simulation with respect to transition time and concentration, where X axis represents the total number of species and Y axis represents the concentration (mol/l) in blue bars and transition time in red bars. (Color figure online)
Fig. 6.
GPR142 circuit simulation with respect to concentration rate time and concentration
Results
Pathway construction and simulation using systems biology
Systems biology approach
A total of 117 genes, proteins, ions and receptors were used for constructing the pathway as shown in Fig. 2a using Cell Designer (Funahashi et al. 2003, 2007, 2008). The major features of Cell Designer includes construction of biochemical gene regulatory model, visual representation of regulatory network model, comprehensive SBGN (Systems Biology Graphical Notation) diagram of model, SBML (Systems Biology Markup Language) Compatibility, integration with simulation software like COPASI (Hoops et al. 2006) and GEPASI, self simulation module, database connectivity with constructed model, and export of image.
The procedure of a biological pathway involves arranging and pulling out information computationally and brings together useful information using system biology software tools to identifying network behaviour. The topological based and dynamical based analysis was done for the pathway. Figure 2a demonstrates the foremost interactions of GPR142 both with proteins and genes that are involved in the Type 2 diabetes pathways.
Formats standards and pathway construction and simulation tools
Different object oriented based softwares are available for constructing pathway, storage of whole system, exchange to another format, and parsing of pathway. Significant pathway and pathway associated formats are based on XML, include SBML, SBGN, PSIM (Proteomics Standards Initiative Molecular), and BioPAX formats. COPASI and GEPASI are self simulation module for whole pathway at different time scales. Figure 2b represents a snapshot of the pathway showing the interacting genes/proteins with GPR142 in Type 2 diabetes pathway. The schematic representation used is as follows: genes (yellow), truncating proteins (pink), generic proteins (green), GPCRs proteins (pink), ions (blue), receptor protein (light yellow), domains (light green) and other molecules (dark green) interacting with GPR142 receptor protein within square cell compartment (light yellow). Black colored edges symbolize the connectivity of one node to another node and sub compartment represents the nucleus shown as oval compartment (light yellow). Large rectangular circle represents the cell and small oval circle in whole compartment represents the nucleus of the cell which involves transcription process of the cell. The interaction with other proteins and genes helped in building a biological pathway within cell for signal transduction. GPR39, GPR142, GPR78, LNX1, INS, GLUT4, KNG1, RXFP3 and RXFP4 have been identified to play a crucial role in this pathway and are responsible for activation of this pathway and in Type 2 diabetes.
Kinetic simulation
Kinetic simulation with respect to varying transition time and concentration of the mass is described in Fig. 3. The species (gene, proteins, ions and other molecules) have been shown in specific colors. The details are given in Supplementary Table S1a, S1b and S2. Panel A shows the 10 s (Time) simulation results of GPR142 pathway and is more stable compared to other time frames while in Panel B the 30 s (Time) simulation results of GPR142 pathway against Type 2 diabetes is shown. Panel C shows the 50 s (Time) simulation results of GPR142 pathway and is less stable as compared to Panel B, whereas Panel D shows the 70 s (Time) simulation results of GPR142 pathway and is more unstable compared to Panel C. The Panel E in (Fig. 3) shows the 100 s (Time) simulation results of GPR142 pathway against Type 2 diabetes and depicts higher stability. These results are indicative of dynamic perturbations occurring in different states of all species over a period of time frame ranging from 0 to 100 s. Panel F represent the results after the completion of the 100 s simulation and in this all the genes, proteins and others molecules involved into Type 2 diabetes disease are interacting with each other and GPR142.
Comparative analysis
Systems biology and Biological circuits both are techniques of signifying gene to gene interaction, gene to generic protein interaction, Generic protein-Truncated Protein interaction, Generic protein-Receptor interaction and other molecule-Ion interaction, how these interactions can be represented in form of biological circuits and how to make a BioLogic circuit for biological pathway system and simulate them in form of true (1) and false (0). Table 1 shows the nomenclature and description used to define various interactions in systems biology and biological circuits.
Boolean network construction and simulation using biological circuits
Biological circuit’s approach
Biological Logic circuit designing and Simulation for GPR142 against Type 2 Diabetes using basic digital systems constructed by logic gates is described below in Table 2.
Table 2.
Input and output process of gates (AND, OR, NOT, NAND, NOR, XOR, XNOR)

Engineering of GPR142 Signal Transduction Pathways appearance in Artificial Boolean signalling Networks
Using biological circuits it is possible to construct artificial Boolean network or synthetic pathways that can’t traverse endogenous mechanism parts and construct completely artificial cells. Engineering of Gene and protein circuits against signalling pathways is indicative of transduction pathways which may be conflicting to gene circuits in regard to two main characteristics—one being the properties of the pathway and the other being its mechanism as shown in (Fig. 4). Signalling pathways activate in time frame ranging from milliseconds to nanoseconds as in case of prokaryotes transcriptional process or minutes to hours as in case of eukaryotes transcriptional process, even though phase changes might occur more rapidly. We constructed the BioLogic circuit of the complete system for Type 2 diabetes, wherein, many genes, truncating proteins, generic proteins, some GPCR proteins, other proteins, ions and other molecules are interacting with GPR142 receptor in form of logic GATEs using Logisim. In Fig. 4 blue line represent the active genes and proteins and red lines represent the inactive genes, proteins and ions. The complete circuits is a combination of logic GATEs as shown in Fig. 4. In Fig. 4 blue line represent the active genes and proteins and red lines represent the inactive genes, proteins and ions. Logisim is a software for designing and simulating biological logic circuits having graphical interface. Logisim execute the entire logic circuits on any machine supporting the Java application.
GPR142 circuit simulation with respect to concentration (mol/l) and concentration Rate [mol/(l*s)], GPR142 circuit simulation with respect to transition time and concentration, where 1.#INF = Dividing +ve# by 0 and produces a +ve infinity output same as dividing −ve# by 0 produces a −ve infinity output. If input would generate a larger +ve# than could be stored in a double, the input return 1.#INF described below in Fig. 5 and again GPR142 circuit simulation with respect to input and output GATE described below in (Figs. 5, 6).
In the direction of relevance in Biotechnology and Drug discovery
Artificial synthetic signalling networks have been effectively designed for precise purpose in drug discovery and industrial biotechnology (Kaushik 2013). GPR142 artificial Boolean circuit involving GPR142 engineered signalling pathways makes an artificial cell and investigates the responses of their signals in Type 2 diabetes. Some researchers have been engineering proteins and peptides to build new proteins for combinatorial libraries. Comparative analysis of systems biology and biological circuits indicate their interrelatedness in living system (Fig. 7) and may be helpful in finding out the cure against the hormonal disease (Shannon et al. 2003).
Fig. 7.
Comparative analysis between wet lab and computational approach and systems biology and biological circuits
Conclusions
Artificial living systems respond to their environment. For designing of biological circuits first of all exhaustive information regarding cell signal regulation, how cells interact with each other and how cells work at pathway level is required. Systems biology has also played important role in assessing these information and is helpful for the designing the switching circuits. Systems biology has helped in deciphering genes and proteins artificial networks in large scale experiments. The major hurdle in biological circuits approach is unique characteristics of proteins and domains that make them difficult to design and extrapolate from one to another. The aim of this paper is how to design, simulate and test the control of biological circuits. This control circuit can be used to control the switching circuit of biological pathway. Biological circuits design methodology, composition; standardization and abstraction carry great promise in deciphering biological regulatory networks. Using BDA tools designing of switching biological circuits and pathways that specifying desired biological behaviors to understanding biological system in form of devices is feasible, cells respond to their environment by sensing signals. In recent years biological circuit’s networks have been designed in both prokaryotes as well as eukaryotes. The living system has the ability to respond the intracellular signals responsible for phenotypic or genotypic changes. We report a GPR142 biochemical pathway based regulatory system which is involved in Type 2 diabetes diseases using both approach systems biology as well as biological circuits.
Electronic supplementary material
References
- Andrecut M, Halley JD, Winkler DA, Huang S. A general model for binary cell fate decision gene circuits with degeneracy: indeterminacy and switch behavior in the absence of cooperativity. PLoS One. 2011;6(5):e19358. doi: 10.1371/journal.pone.0019358. [DOI] [PMC free article] [PubMed] [Google Scholar]
- Arkin JR, McAdams HH. Stochastic kinetic analysis of developmental pathway bifurcation in phage λ-infected Escherichia coli cells. Genetics. 1998;149:1633–1648. doi: 10.1093/genetics/149.4.1633. [DOI] [PMC free article] [PubMed] [Google Scholar]
- Becskei A, Serrano L. Engineering stability in gene networks by autoregulation. Nature. 2000;405(6786):590–593. doi: 10.1038/35014651. [DOI] [PubMed] [Google Scholar]
- Bhalla US, Iyengar R. Emergent properties of networks of biological signaling pathways. Science. 1999;283:381–387. doi: 10.1126/science.283.5400.381. [DOI] [PubMed] [Google Scholar]
- Burch C. Logisim: a graphical system for logic circuit design and simulation. J Educ Resour Comput. 2002 [Google Scholar]
- Davidson EH, Rast JP, Oliveri P, Ransick A, Calestani C, Yuh CH, Minokawa T, Amore G, Hinman V, Arenas-Mena C, Otim O, Brown CT, Livi CB, Lee PY, Revilla R, Rust AG, Pan ZJ, Schilstra MJ, Clarke PJC, Arnone MI, Rowen L, Cameron RA, McClay DR, Hood L, Bolouri H. A genomic regulatory network for development. Science. 2002;295(5560):1669–1678. doi: 10.1126/science.1069883. [DOI] [PubMed] [Google Scholar]
- Densmore D, Hassoum S. Design automation for synthetic biological systems. IEEE. 2012;29:7–20. [Google Scholar]
- Funahashi A, Tanimura N, Morohashi M, Kitano H. CellDesigner: a process diagram editor for gene-regulatory and biochemical networks. Biosilico. 2003;1:159–162. doi: 10.1016/S1478-5382(03)02370-9. [DOI] [Google Scholar]
- Funahashi A, Jouraku A, Matsuoka Y, Kitano H. Integration of cell designer and SABIO-RK. In Silico Biol. 2007;7(2 Suppl):S81–S90. [PubMed] [Google Scholar]
- Funahashi A, Matsuoka Y, Jouraku A, Morohashi M, Kikuchi N, Kitano H. CellDesigner 35: a versatile modeling tool for biochemical networks. IEEE. 2008 [Google Scholar]
- Goldental A, Guberman S, Vardi R, Kanter I. A computational paradigm for dynamic logic-gates in neuronal activity. Front Comput Neurosci. 2014;29:8–52. doi: 10.3389/fncom.2014.00052. [DOI] [PMC free article] [PubMed] [Google Scholar]
- Goto S, Bono H, Ogata H, Fujibuchi W, Nishioka T, Sato K, and Kanehisa M (1997) Organizing and computing metabolic pathway data in terms of binary relations. Pac Symp Biocomput 175–186 [PubMed]
- Harmar AJ, Hills RA, Rosser EM, Jones M, Buneman OP, Dunbar DR, Greenhill SD, Hale VA, Sharman JL, Bonner TI, Catterall WA, Davenport AP, Delagrange P, Dollery CT, Foord SM, Gutman GA, Laudet V, Neubig RR, Ohlstein EH, Olsen RW, Peters J, Pin JP, Ruffolo RR, Searls DB, Wright MW, Spedding M. IUPHAR-DB: the IUPHAR database of G protein-coupled receptors and ion channels. Nucleic Acids Res. 2009;37:680–705. doi: 10.1093/nar/gkn728. [DOI] [PMC free article] [PubMed] [Google Scholar]
- Hasty J, Isaacs F, Dolnik M, McMillen D, Collins JJ. Designer gene networks: toward fundamental cellular control. Chaos. 2001;11(1):207–220. doi: 10.1063/1.1345702. [DOI] [PubMed] [Google Scholar]
- Hattori M, Okuno Y, Goto S, Kanehisa M. Development of a chemical structure comparison method for integrated analysis of chemical and genomic information in the metabolic pathways. J Am Chem Soc. 2003;125(39):11853–11865. doi: 10.1021/ja036030u. [DOI] [PubMed] [Google Scholar]
- Hattori M, Tanaka N, Kanehisa M, Goto S. Chemical structure search servers for network analyses. Nucleic Acids Res. 2010 doi: 10.1093/nar/gkq367. [DOI] [PMC free article] [PubMed] [Google Scholar]
- Hoops S, Sahle S, Gauges R, Lee C, Pahle J, Simus N, Singhal M, Xu L, Mendes P, Kummer U. COPASI—a complex pathway simulator. Bioinformatics. 2006;22(24):3067–3074. doi: 10.1093/bioinformatics/btl485. [DOI] [PubMed] [Google Scholar]
- Huang B, Lu M, Jolly MK, Tsarfaty I, Onuchic J, Ben-Jacob E. The three-way switch operation of Rac1/RhoAGTPase-based circuit controlling amoeboid-hybrid-mesenchymal transition. Sci Rep. 2014;4:6449. doi: 10.1038/srep06449. [DOI] [PMC free article] [PubMed] [Google Scholar]
- Jolly MK, Huang B, Lu M, Mani SA, Levine H, Ben-Jacob E. Towards elucidating the connection between epithelial-mesenchymal transitions and stemness. J R Soc Interface. 2014;11(101):20140962. doi: 10.1098/rsif.2014.0962. [DOI] [PMC free article] [PubMed] [Google Scholar]
- Kanehisa M. Toward pathway engineering: a new database of genetic and molecular pathways. Sci Technol Jpn. 1996;59:34–38. [Google Scholar]
- Kanehisa M. A database for post-genome analysis. Trends Genet. 1997;13(9):375–376. doi: 10.1016/S0168-9525(97)01223-7. [DOI] [PubMed] [Google Scholar]
- Kanehisa M. The KEGG database. Novartis Found Symp. 2002;247:91–103. doi: 10.1002/0470857897.ch8. [DOI] [PubMed] [Google Scholar]
- Kanehisa M, Goto S. KEGG: Kyoto encyclopedia of genes and genomes. Nucleic Acids Res. 1999;27(1):29–34. doi: 10.1093/nar/27.1.29. [DOI] [PMC free article] [PubMed] [Google Scholar]
- Kanehisa M, Goto S, Kawashima S, Nakaya A. The KEGG databases at GenomeNet. Nucleic Acids Res. 2002;30(1):42–46. doi: 10.1093/nar/30.1.42. [DOI] [PMC free article] [PubMed] [Google Scholar]
- Kanehisa M, Goto S, Kawashima S, Okuno Y, Hattori M. The KEGG resources for deciphering the genome. Nucleic Acids Res. 2004;32:277–280. doi: 10.1093/nar/gkh063. [DOI] [PMC free article] [PubMed] [Google Scholar]
- Kanehisa M, Goto S, Hattori M, Aoki-Kinoshita KF, Itoh M, Kawashima S, Katayama T, Araki M, Hirakawa M. From genomics to chemical genomics: new developments in KEGG. Nucleic Acids Res. 2006;34:354–357. doi: 10.1093/nar/gkj102. [DOI] [PMC free article] [PubMed] [Google Scholar]
- Kanehisa M, Araki M, Goto S, Hattori M, Hirakawa M, Itoh M, Katayama T, Kawashima S, Okuda S, Tokimatsu T, Yamanishi Y. KEGG for linking genomes to life and the environment. Nucleic Acids Res. 2008;36(1):D480–D484. doi: 10.1093/nar/gkm882. [DOI] [PMC free article] [PubMed] [Google Scholar]
- Kanehisa M, Goto S, Furumichi M, Tanabe M, Hirakawa M. KEGG for representation and analysis of molecular networks involving diseases and drugs. Nucleic Acids Res. 2010 doi: 10.1093/nar/gkp896. [DOI] [PMC free article] [PubMed] [Google Scholar]
- Kanehisa M, Goto S, Sato Y, Furumichi M, Tanabe M. KEGG for integration and interpretation of large-scale molecular datasets. Nucleic Acids Res. 2012;40:D109–D114. doi: 10.1093/nar/gkr988. [DOI] [PMC free article] [PubMed] [Google Scholar]
- Kanehisa M, Goto S, Sato Y, Kawashima M, Furumichi M, Tanabe M. Data, information, knowledge and principle: back to metabolism in KEGG. Nucleic Acids Res. 2014;42:D199–D205. doi: 10.1093/nar/gkt1076. [DOI] [PMC free article] [PubMed] [Google Scholar]
- Kaushik AC. Logisim operon circuits. Int J Sci Eng Res. 2013;10:1312–1316. [Google Scholar]
- Kiel C, Yus E, Serrano L. Engineering signal transduction pathways. Cell. 2010;140:33–47. doi: 10.1016/j.cell.2009.12.028. [DOI] [PubMed] [Google Scholar]
- Kierzek AM, Zaim J, Zielenkiewicz P. The effect of transcription and translation initiation frequencies on the stochastic fluctuations in prokaryotic gene expression. J Biol Chem. 2001;276(11):8165–8172. doi: 10.1074/jbc.M006264200. [DOI] [PubMed] [Google Scholar]
- Kotera M, Yamanishi Y, Moriya Y, Kanehisa M, Goto S. GENIES: gene network inference engine based on supervised analysis. Nucleic Acids Res. 2012;40:W162–W167. doi: 10.1093/nar/gks459. [DOI] [PMC free article] [PubMed] [Google Scholar]
- Krishnan R, Purdy C (2005), Bio-inverter model and interface to digital hardware. In: 48th International IEEE mid west symposium on circuits and systems, pp 766–769
- Krishnan R, Purdy C (2013) Circuit development using biological components-principles, models and experimental feasibility. In: IEEE, pp 1–9
- Lu M, Jolly MK, Ben-Jacob E. Toward decoding the principles of cancer metastasis circuits. Cancer Res. 2014;74(17):4574–4587. doi: 10.1158/0008-5472.CAN-13-3367. [DOI] [PubMed] [Google Scholar]
- McMillen D, Kopell N, Hasty J, Collins JJ. Synchronizing genetic relaxation oscillators by inter cell signaling. Proc Nat Acad Sci. 2002;99(2):679–684. doi: 10.1073/pnas.022642299. [DOI] [PMC free article] [PubMed] [Google Scholar]
- Mendes P. GEPASI: a software package for modelling the dynamics, steady states and control of biochemical and other systems. Bioinformatics. 1993;9(5):563–571. doi: 10.1093/bioinformatics/9.5.563. [DOI] [PubMed] [Google Scholar]
- Moriya Y, Itoh M, Okuda S, Yoshizawa A, Kanehisa M. KAAS: an automatic genome annotation and pathway reconstruction server. Nucleic Acids Res. 2007;35:182–185. doi: 10.1093/nar/gkm321. [DOI] [PMC free article] [PubMed] [Google Scholar]
- Moriya Y, Shigemizu D, Hattori M, Tokimatsu T, Kotera M, Goto S, Kanehisa M. PathPred: an enzyme-catalyzed metabolic pathway prediction server. Nucleic Acids Res. 2010;38:W138–W143. doi: 10.1093/nar/gkq318. [DOI] [PMC free article] [PubMed] [Google Scholar]
- Muto A, Kotera M, Tokimatsu T, Nakagawa Z, Goto S, Kanehisa M. Modular architecture of metabolic pathways revealed by conserved sequences of reactions. J Chem Inf Model. 2013;53(3):613–622. doi: 10.1021/ci3005379. [DOI] [PMC free article] [PubMed] [Google Scholar]
- Nakaya A, Katayama T, Itoh M, Hiranuka K, Kawashima S, Moriya Y, Okuda S, Tanaka M, Tokimatsu T, Yamanishi Y, Yoshizawa AC, Kanehisa M, Goto S. KEGG OC: a large-scale automatic construction of taxonomy-based ortholog clusters. Nucleic Acids Res. 2013;41:D353–D357. doi: 10.1093/nar/gks1239. [DOI] [PMC free article] [PubMed] [Google Scholar]
- Ogata H, Goto S, Sato K, Fujibuchi W, Bono H, Kanehisa M. KEGG: Kyoto encyclopedia of genes and genomes. Nucleic Acids Res. 1999;27(1):29–34. doi: 10.1093/nar/27.1.29. [DOI] [PMC free article] [PubMed] [Google Scholar]
- Oh M, Yamada T, Hattori M, Goto S, Kanehisa M. Systematic analysis of enzyme-catalyzed reaction patterns and prediction of microbial biodegradation pathways. J Chem Inf Model. 2007;47(4):1702–1712. doi: 10.1021/ci700006f. [DOI] [PubMed] [Google Scholar]
- Okuda S, Yamada T, Hamajima M, Itoh M, Katayama T, Bork P, Goto S, Kanehisa M. KEGG Atlas mapping for global analysis of metabolic pathways. Nucl Acids Res. 2008;36:W423–W426. doi: 10.1093/nar/gkn282. [DOI] [PMC free article] [PubMed] [Google Scholar]
- Ozbudak EM, Thattai M, Kurtser I, Grossman AD, Oudenaarden AV. Regulation of noise in the expression of a single gene. Nat Genet. 2002;31(1):69–73. doi: 10.1038/ng869. [DOI] [PubMed] [Google Scholar]
- Shannon P, Markiel A, Ozier O, Baliga NS, Wang JT, Ramage D, Amin N, Schwikowski B, Ideker T. Cytoscape: a software environment for integrated models of biomolecular interaction networks. Genome Res. 2003;13(11):2498–2504. doi: 10.1101/gr.1239303. [DOI] [PMC free article] [PubMed] [Google Scholar]
- Yamanishi Y, Hattori M, Kotera M, Goto S, Kanehisa M. Enzyme predicting potential EC numbers from the chemical transformation pattern of substrate-product pairs. Bioinformatics. 2009;25(12):i179–i186. doi: 10.1093/bioinformatics/btp223. [DOI] [PMC free article] [PubMed] [Google Scholar]
Associated Data
This section collects any data citations, data availability statements, or supplementary materials included in this article.


