Abstract
In this paper, we investigate the abnormalities of electroencephalograph (EEG) signals in the Alzheimer’s disease (AD) by analyzing 16-scalp electrodes EEG signals and make a comparison with the normal controls. The power spectral density (PSD) which represents the power distribution of EEG series in the frequency domain is used to evaluate the abnormalities of AD brain. Spectrum analysis based on autoregressive Burg method shows that the relative PSD of AD group is increased in the theta frequency band while significantly reduced in the alpha2 frequency bands, particularly in parietal, temporal, and occipital areas. Furthermore, the coherence of two EEG series among different electrodes is analyzed in the alpha2 frequency band. It is demonstrated that the pair-wise coherence between different brain areas in AD group are remarkably decreased. Interestingly, this decrease of pair-wise electrodes is much more significant in inter-hemispheric areas than that in intra-hemispheric areas. Moreover, the linear cortico-cortical functional connectivity can be extracted based on coherence matrix, from which it is shown that the functional connections are obviously decreased, the same variation trend as relative PSD. In addition, we combine both features of the relative PSD and the normalized degree of functional network to discriminate AD patients from the normal controls by applying a support vector machine model in the alpha2 frequency band. It is indicated that the two groups can be clearly classified by the combined feature. Importantly, the accuracy of the classification is higher than that of any one feature. The obtained results show that analysis of PSD and coherence-based functional network can be taken as a potential comprehensive measure to distinguish AD patients from the normal, which may benefit our understanding of the disease.
Keywords: Alzheimer’s disease (AD), Electroencephalograph (EEG), Power spectral density (PSD), Coherence, Functional connectivity, Classification
Introduction
Alzheimer’s disease (AD) is a progressive, disabling neuro-degenerative disorder that affects mainly older persons beyond the age of 70. Experimental studies show that it is may be caused by the degeneration of synapses and death of neurons in the brain regions, such as hippocampus, entorhinal cortex, neocortex. It usually results in a loss in cognition, memory, judgment, even language and functional skills (Dauwels et al. 2010a, b, 2011; Mattson 2004). It is asserted that a definite diagnosis is only possible by necropsy (Dauwels et al. 2010a, b). For the symptoms in early state are easily neglected as normal consequences of aging, discriminating AD patients from the normal is difficult.
Investigation of neuropsychiatric disorder using neuroscientific approaches, such as functional magnetic resonance imaging (fMRI) (Chang and Glover 2010; Vemuri et al. 2012; Zhou et al. 2010), magnetoencephalography (MEG) (Stam et al. 2006; Zhang et al. 2014), electroencephalography (EEG) (Dauwels et al. 2010a, b, 2013; Jelles et al. 2008; Vialatte et al. 2012) and so on, attracts more interests. As a noninvasive, simple, and relatively low cost approach, resting-state EEG indirectly measures brain neural electric activity from the scalp of the head. It is considered as an integrated appearance of different brain functions, such as depth of anesthesia (Shalbaf et al. 2014), Parkinson’s disease (Han et al. 2013), brain death (Chen et al. 2008), even under manual acupuncture (Pei et al. 2014; Yi et al. 2013). Despite it has been around for decades, using EEG as cognitive biomarker to detect and assess AD in individuals is a relatively new effort (Baker et al. 2008; Czigler et al. 2008; Fraga et al. 2013; Hidasi et al. 2007; Jelles et al. 2008). According to the rather widely held view, the development of AD is associated with the slowing of the EEG (Czigler et al. 2008; Dauwels et al. 2010a, b; Moretti et al. 2009), reduction of complexity in EEG (Dauwels et al. 2011) and perturbations in EEG synchrony (Dauwels et al. 2010a, b; Wang et al. 2014).
Generally, the traditional power spectral density (PSD) can be applied to measure the activity of cortical cells arranged in parallel and space averaged over cortex physiologically (Akin and Kiymik 2000; Nunez et al. 2001). EEG PSD is commonly computed based on parametric autoregressive (AR) model which provides information on the signal power at each relatively narrow frequency sub-band. Compared with classical spectrum estimation methods (e.g. FFT), AR Burg method can reduce the spectral losses and give better frequency resolution (Akin and Kiymik 2000; Han et al. 2013). Nowadays, quantitative studies have shown that AD causes EEG signals to slow down. Czigler et al. (2008) have found a significant decrease of the alpha band and increase of the theta power in the AD patients. Gianotti et al. (2007) and Jeong (2004) have further proved that AD patients show an increase in low frequencies bands (delta and theta band) power with a simultaneous decrease in high frequencies (alpha and beta) power in AD patients along with the development of the disease. Moreover, it has been shown that the amount of power in various frequency bands supposedly correlated with the severity of AD (Bennys et al. 2001; Jeong 2004; Sanz-Arigita et al. 1994).
Although EEG PSD could characterize the group differences between AD group and the control group in frequency domain, it only focuses on single-channel EEG and cannot reflect the relation between different EEG series, i.e. the connection between different brain areas. However, it is extensively reported that AD is considered as a ‘disconnection syndrome’, characterized by widespread degeneration of synapses and the death of neurons (Cook and Leuchter 1996; Delbeuck et al. 2003; Tijms et al. 2013). EEG coherence is a promising approach to evaluate functional cortical connections between different cortical areas of the brain (Dauwels et al. 2010a, b; Koenig et al. 2005; Pereda et al. 2005; Stam et al. 2003, 2005). The higher the coherence is, the higher the linear synchrony is, which indicates a strong functional linkage (Dauwels et al. 2010a, b; Pereda et al. 2005), and even the information transmission, synergies and collaborative activity between different brain areas. It has been extensively reported that EEG coherence of AD patients is characterized by a pattern of statistically significant decrease among cortical regions in the alpha frequency band (Adler et al. 2003; Hogan et al. 2003; Jeong 2004; Jiang 2005; Koenig et al. 2005; Locatelli et al. 1998; Sankari et al. 2011; Uhlhaas and Singer, 2006). Knott et al. (2000) have further demonstrated that the significantly decreased EEG coherence located in temporo-parietal brain areas can be taken as a discriminant variable between AD patients and the normal. However, most of these studies are based on the feature of coherence estimated from multi-electrodes EEG signals. Whether the combination of both single and multi-electrodes features could improve the classification of AD patients and the normal controls is still unclear.
In order to explore this problem, in this work we aim to detect and assess the abnormalities of AD by characterizing the alteration of both PSD and degree of the functional network extracted from coherence between multiple cortical regions on EEG signals. We first explore the group differences of the relative PSD as a feature to make a preliminary distinction between AD patients and the controls. We further estimate the coherence of different brain areas in certain frequency bands. In particular, the global pattern of coherence and the local pair-wise coherence in inter-hemisphere and intra-hemisphere are explored. Moreover, the functional connectivity is extracted from coherence, and the normalized network degree is characterized as another feature. We also seek to combine the two features to discriminate the spontaneous EEG recordings of the two groups by applying a support vector machine model. Accordingly, the subsequent parts of this paper are organized as follows: in “Experiment design and EEG recording” section, we give a description of experiment design and EEG recording, including the subjects, the EEG data recording and preprocessing; in “Analysis methods” section, we formulate the estimation of PSD and coherence, and explain the statistical analysis in detail; in “Results” section, analysis results of the two groups are presented; which is followed by discussion in “Discussion” and “Conclusion” sections.
Experiment design and EEG recording
Subjects
Experiments were performed in two groups of subjects. (a) Fourteen right-handed patients with a diagnosis of probable AD (age 74–78 years old; eight females and six males). All patients recruited from the Department of Neurology of Beijing Hospital were determined according to the international Classification of diseases (ICD-10) of the world health organization and the diagnostic criteria of dementia in the Diagnostic and Statistical Manual of Psychiatric Disorders (DSM-IV) (Cooper 1995). Moreover, all of them had undergone a thorough clinical neuroimaging and neurological examination to evaluate cognitive function, which included computed tomography (CT), structural MRI, cerebellar testing, cranial nerve examination and Mini-Mental-Status examination (MMSE). The MMSE scores were ranged from 11.7 to 14.9. In addition, clinical history was also considered. Exclusion criteria included use of drugs of antipsychotics, antidepressants, and anxiolytics, and presence of other neurological or psychiatric illness, such as vascular dementia (VD), other cerebrovascular diseases (i.e. cerebral infarction, cerebral hemorrhage), metabolic disorder, and severe depression. (b) Fourteen healthy age-matched subjects served as the controls (age 70–76 years old; ten females and four males). Their MMSE scores were ranged from 28.1 to 30.0. They were healthy and intellectual, with no symptoms or personal history of neurological or psychiatric disorders. Besides, they were not abusing alcohol or illicit drugs. All of them were normal by these examinations.
Our study was performed with the approval of the Ethics Committee of Health Department of Beijing hospital. All the subjects or their legal representatives had been provided with informed consent with the adequate understanding of the purpose and procedure of the study. In addition, their informed written consent was obtained according to the declaration of Helsinki.
EEG recordings and preprocessing
The continuous EEG data were collected for 10 min with the subjects in a relaxed state and under the eyes-closed condition in order to avoid the additional artifacts caused by visual input and attention. During the experiment, all the subjects were seated upright in a dedicated semi-dark quiet room which was electromagnetic shielded. Additionally, they were told in advance to avoid any movements, such as body actions, eye movements and blinks. To keep adequate alertness of subjects, their state and ongoing EEGs were continuously monitored by experimenters during the experiment.
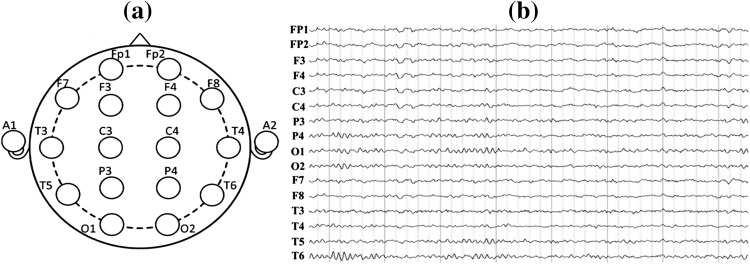
EEGs were recorded from the 16 active shielded scalp loci of the international standard 10–20 system using Symtop recorder (model: UEA-B; sampling frequency: 1,024 Hz; electrode impedances: ≤3 kΩ) which was widely used for clinical settings and research purposes. The 16 Ag–AgCl channels were Fp1, Fp2, F3, F4, C3, C4, P3, P4, O1, O2, F7, F8, T3, T4, T5, T6, with all electrodes referenced to the bilateral ear (A1, A2), as shown in Fig. 1a.
Fig. 1.
Electrode names and positions on the brain (a) and 16-channel EEG signals recorded for one AD patient (b)
The raw EEG data recorded during the experiment were shown in Fig. 1b. In order to achieve high confidence of the data, 16-channel EEGs of each subject were segmented into 5 non-overlapping epochs which last 8 s continuously by using the EEGLAB toolbox. Besides, the artifacts caused by eye movement, muscular movement or other visible disturbances were removed manually on the basis of a thorough visual inspection off-line. Then each channel of intercepted EEG was decomposed into the six EEG sub-bands of interest: delta (0.5–4 Hz), theta (4–7 Hz), alpha1 (8–10 Hz), alpha2 (10–12 Hz), beta (13–30 Hz) and gamma (30–40 Hz) via the band-passed FIR filter. Moreover, the digitized EEG data were processed and analyzed in a MATLAB environment (version 7.12.0.635, R2011a).
Analysis methods
Power spectral density estimation
Due to finite size of the EEG data, one can only have an estimate of the true spectrum via a parametric approach, thus the PSD is estimated using AR Burg method. Additionally, we take a sliding Hamming window with a length of 256 sampling points (250 ms) and overlap of 128 sampling points (125 ms) to improve the performance of the spectral estimation. There are two steps in the spectrum estimation procedure. Firstly, estimate the parameters of the model-based method from a given data sequence x(n), 0 ≤ n ≤ N − 1. Secondly, compute the PSD estimated from these estimations.
The AR method is based on modeling the data sequence x(n) as the output of a causal and discrete filter whose input is white noise, which is expressed as the follows
| 1 |
where a(k) is the AR coefficient, ω(n) is the white noise of variance equal to σ2, and p is the order of the AR model.
In this work, AR coefficients are estimated by the recursive Burg method, which is based on minimizing the forward and backward prediction errors. From the estimation of AR parameters by the Burg algorithm, PSD estimation is formed as (Akin and Kiymik 2000; Kay 1988)
| 2 |
where is the total least squares error. The model order p of AR method is determined by using Akaike information criterion (AIC). In this study, the model order is taken as p = 10. Then the PSD results of each frequency band are normalized to obtain the relative PSD of one band to the whole frequency band.
| 3 |
where [fL, fH] = [0.5, 40]and [f1, f2] is determined by the frequency sub-band selected.
Coherence estimation
Coherence represents the normalized covariance of two time series in the frequency domain. Mathematically, the coherence function Cxy(f) at a frequency f for signal x and y is obtained by the normalization of cross-spectral spectrum as follows:
| 4 |
where the notation 〈·〉 denotes the mean value over 5 epochs of time series. Pii(f),i ∊ {x, y} is the corresponding auto-spectra of signals i, Pxy (f) is the cross-power spectrum, which can be estimated from Eq. (3).
The estimated coherence ranges from 0 to 1 whereby 0 means that the corresponding frequency components of both signals are linearly independent, while 1 means the frequency components of the two signals give the maximum linear correlation. And further, high EEG coherence indicates high cooperation and more information transmission between the underlying brain regions. Thus, coherence estimation is a useful measure to monitor and quantify the synchrony property of two EEG series, especially when they are limited to some particular frequency bands (Dauwels et al. 2010a, b; Pereda et al. 2005).
The EEG coherence calculation for each electrode pair generates a 16 × 16 (16 is the number of recorded EEG channels) matrix showing the connectivity between all possible functionally independent brain areas in each frequency band. After thresholding, such a coupling structure reduces to a binary, undirected connectivity matrix. The connectivity matrix in each frequency band defines a functional network and its structural properties can be further quantified by the normalized degree of nodes (Rubinov and Sporns 2010; Gerhard et al. 2011), which is defined as follows:
| 5 |
where Ki is the degree of the node i in the functional network.
Statistical analysis
One-way ANOVA test is used to assess the statistical group differences of the relative PSD and pair-wise coherence for AD group and the control group. ANOVA returns several statistics, involving the sum of squares (SS), degrees of freedom (df), mean squares (MS = SS/df), F-value and P value. F-value which is the ratio of MS between groups (MSB) to MS within groups (MSW) indicates the degree of group difference. P-value is in inverse proportion to the F-value, and it means the error probability when the group difference is not significant. Generally, P < 0.01 is considered as the significance level in statistics. A larger F-value and a smaller P-value suggest a more significant group difference, and vice versa. Moreover, SS, df and MS are interim parameters used to calculate the value of F and P, and they could not reflect the group difference intuitively (Freund and Littell 1981). Additionally, in order to minimize the type I error and improve the accuracy of statistical analysis, Bonferroni correction is applied as the multi-comparisons are conducted (Cabin and Mitchell 2000). Therefore, the significance level is set at p < 0.01/p < 0.016.6 = 0.00167 for the relative PSD in six frequency bands and p < 0.01/0.018.8 = 0.00125 for the coherence of eight electrode-pairs after correction.
Furthermore, receiver operating characteristic (ROC) curves are applied to visually evaluate the ability of the features in discriminating AD patients from the normal controls in certain frequency bands where the group difference is significant by ANOVA. This statistical method summarizes the performance of a two-class classifier across the range of possible thresholds from 0 to 1. It is a graphical representation of the trade-offs between sensitivity and specificity. Sensitivity is the true positive rate while specificity is equal to the true negative rate:
| 6 |
where false negatives (FN) are the number of AD patients classified as the normal controls, and false positives (FP) are the number of the normal controls classified as patients. True positives (TP) and true negatives (TN) are the number of AD patients and the normal controls correctly recognized, respectively. Accuracy quantifies the total number of subjects precisely classified, which is defined as follows:
| 7 |
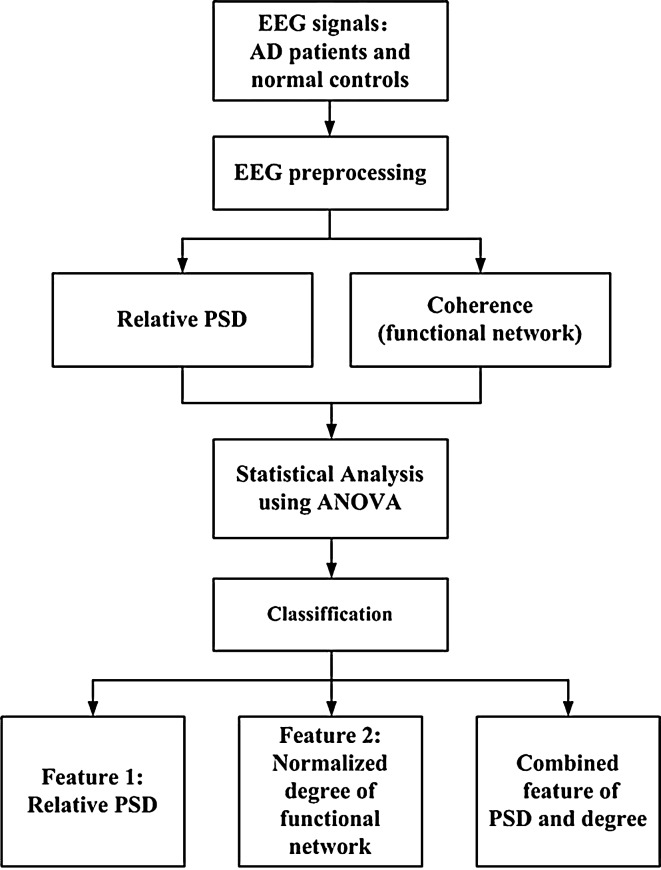
The optimum threshold is the cut-off point where the highest accuracy (minimal FN and FP) is obtained. It can be determined from the ROC curve as the closest value to the left top point (100 % sensitivity, 100 % specificity). The area under the ROC curve (AUC) characterizes the performance of classification, for a perfect classification the area is 1 while an AUC of 0.5 represents a worthless test (Abásolo et al. 2005; Zweig and Campbell 1993). Additionally, Fig. 2 shows a block diagram with the different steps followed in this study.
Fig. 2.
Block diagram of classification between AD patients and control subjects from the EEG analysis and classification
Results
Relative PSD analysis
EEG contains different specific frequency bands. Features in sub-bands are particularly important to characterize different brain states. The sub-bands of interest are: delta (0.5–4 Hz), theta (4–7 Hz), alpha1 (8–10 Hz), alpha2 (10–12 Hz), beta (13–30 Hz) and gamma (30–40 Hz). The relative PSD can be obtained by dividing the PSD of each frequency band by the total PSD of the whole frequency band estimated by the AR Burg method.
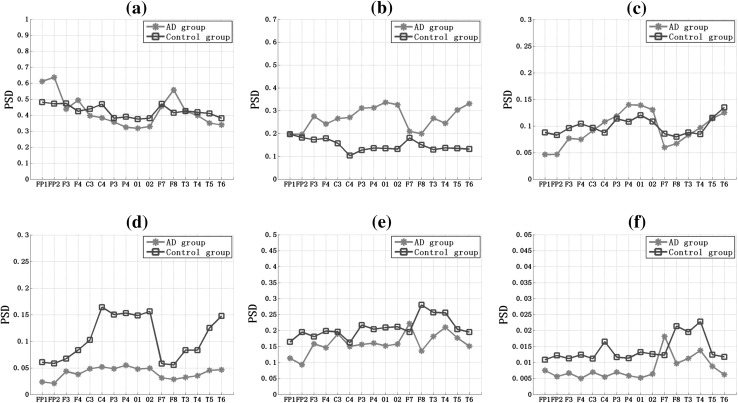
Figure 3 showed that the relative PSD of 16 EEG channels in six frequency bands for AD group and the control group. It was shown that, for the both two groups, the relative PSD decreased with the increase of the frequency. Particularly, in the delta frequency band the relative PSD values were ranged in [0.3, 0.65], while in the gamma frequency band the relative PSD fluctuated in [0.005, 0.02], indicating that most energy focused on the lower frequency when the subjects were in the resting state. Then comparing the relative PSD values for AD group and the control group, we obtained the following interesting results: (1) in the delta and alpha1 frequency bands (Fig. 3a, c), the variation trends of the relative PSD in different electrodes for the two groups were similar, and there was no significant group difference, except several electrodes, such as FP1, FP2, and F8 in the delta frequency band and C4, P4, O1, and O2 in the alpha2 frequency band; (2) in the theta frequency band (Fig. 3b), the relative PSD values of AD group were much larger than that of the control group; (3) in the higher frequency band (Fig. 3d–f), the relative PSD values of AD group were smaller than that of the control group, particularly in parietal (C3, C4, P3, P4), temporal (T3, T4, T5, T6), and occipital (O1, O2) areas in the alpha2 frequency (Fig. 4).
Fig. 3.
The overall relative power spectrum density (PSD) of 16 EEG channels in the (a) delta, (b) theta, (c) alpha1, (d) alpha2, (e) beta, and (f) gamma frequency band for AD group and the control group
Fig. 4.
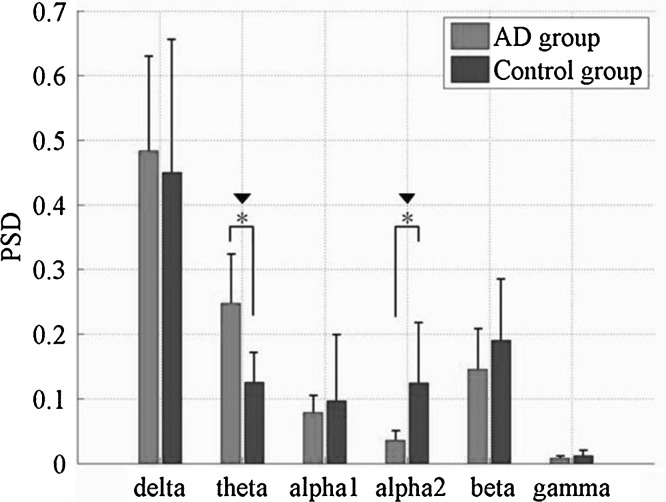
Relative PSD averaged over the 16 electrodes in six frequency bands for AD and the control group. Standard deviations are shown with error bars. Asterisk and black down-pointing triangle represent significant difference between the two groups with P < 0.01 after ANOVA and P < 0.00167 after statistical postcorrection
In order to get insight into the overall relative PSD, we further averaged the relative PSD values of all 16 electrodes in the six frequency bands, and the statistical analysis of ANOVA were shown in Fig. 4 and Table 1. It was found that, compared to the control group, the relative PSD values in the delta and theta frequency bands were increased, whereas they were decreased in the remaining four higher frequency bands, such as the alpha1, alpha2, beta and gamma frequency bands. Moreover, it was shown that the group differences of the relative PSD estimated by the AR Burg method were statistically significant in the theta (F = 17.80, P = 1.47 × 10⁻⁴ < 0.00167) and alpha2 frequency bands (F = 39.13, P = 0.25 × 10⁻⁷ < 0.00167) after statistical postcorrection.
Table 1.
Results of ANOVA for relative PSD of six frequency bands between AD and the control group
| Sub-band | F-value | P-value |
|---|---|---|
| Delta | 0.3539 | 0.5554 |
| Theta | 17.8002 | 1.4666e−004 |
| Alpha1 | 0.6122 | 0.4388 |
| Alpha2 | 39.1348 | 2.5390e−007 |
| Beta | 3.1246 | 0.0851 |
| Gamma | 5.1914 | 0.0584 |
Coherence analysis
Coherence can be considered as a measure of normalized linear synchrony of different EEG series in the frequency domain. Here, coherence analysis was applied to all pair-wise EEG channels for AD group and the control group in the alpha2 frequency band, where the relative PSD mentioned above had significant group difference.
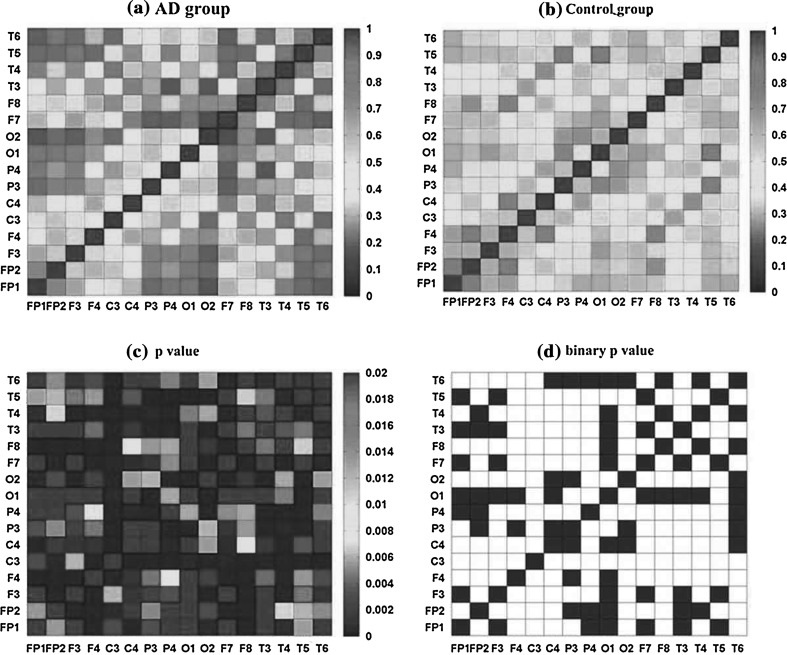
The mean coherence between 16 channels of AD and the control group in the alpha2 frequency band was shown in Fig. 5a, b). Obviously, the mean coherence distributions of the two groups were symmetry, which might indicate the presence of fast bidirectional transmission of information between brain areas. The entries on the diagonal of coherence matrix were all 1, as one EEG signal could achieve complete synchrony with itself. It was obvious that the coherence matrices of the two groups were complex and different. In the control group (Fig. 5b), there were more areas of high (red color) values of coherence than that of AD group. While in AD group (Fig. 5a), the high values of coherence were scatteredly distributed in some areas like frontal, temporo-parietal, and parieto-occipital areas (FP1/FP2-F3/F4, FP1/FP2-F7/F8, T3/T4-C3/C4, O1/O2-P3/P4) for the alpha2 band. The matrix of P values returned by ANOVA between AD and the control group (Fig. 5c) showed the significance of the group difference on coherence. It was found that P values were extremely small, which were all less than 0.02, suggesting that the group differences of coherence matrix were large enough to differentiate AD patients from the normal. A threshold was set to 0.01 which corresponded to the significant level. Then the matrix Pij of P values was transformed into a binary matrix Aij (Fig. 5d). If the entry pij was less than the threshold 0.01, the corresponding entry aij of the binary matrix Aij as set to 1 with white color, indicating the group difference of coherence between electrode i and j was significant, otherwise the entry equaled to 0 with black color. As one could see that most areas in Fig. 5d were white, indicating that the group difference of coherence was significant. It seemed that compared with the controls, the coherence between different areas in AD group would be remarkably decreased in the alpha2 frequency band.
Fig. 5.
Coherence matrix for pair-wise electrodes for (a) AD and (b) the control group in the alpha2 frequency band; (c) matrix of P value of the two groups obtained by ANOVA, in which all the diagonal entries are defined as the largest value with red color; (d) binary connectivity matrix of P value. Here, the threshold is set to 0.01, when the entry of the P value matrix is smaller than 1, it is set to 1 with white color, otherwise 0 with black color. (Color figure online)
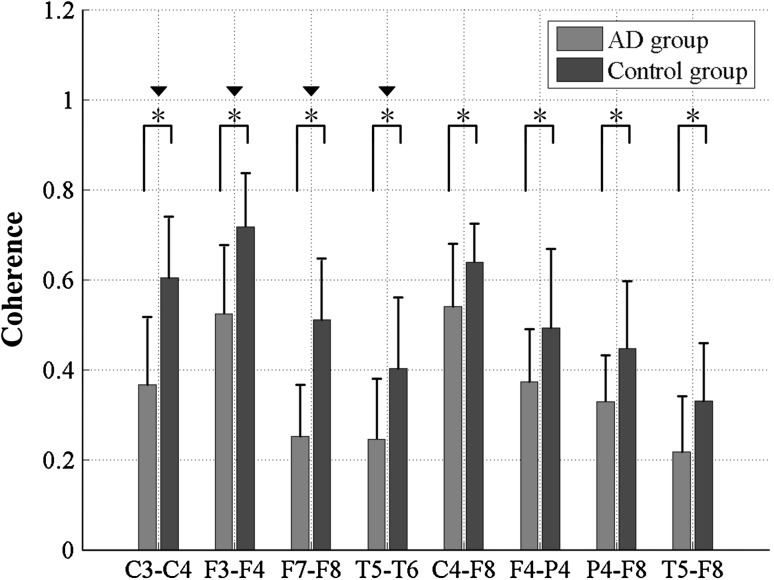
The statistical analysis results of coherence of AD patients and the controls were further analyzed for inter-hemispheric and intra-hemispheric electrode pairs which had significant group difference in the alpha2 frequency band, as shown in Fig. 6 and Table 2. These electrode-pairs covered typical scalp regions: C3–C4, F3–F4, F7–F8 and T5–T6 in inter-hemispheric areas, and C4–F8, P4–F8, P4–F4 and T6–F8 in intra-hemispheric areas. From Fig. 6, it was found that for both the inter-hemispheric and intra-hemispheric areas, the coherence values of AD patients were much lower than that of the control group. Moreover, statistical results (Table 2) revealed that group differences of coherence in inter-hemispheric areas were much more significant than that in intra-hemispheric areas, manifested as the significant difference with P < 0.00125 after statistical postcorrection. Furthermore, the largest coherences of the two groups appeared in frontal areas (F3–F4) in inter-hemispheric areas and parietal areas (C3–C4) in intra-hemispheric areas, whereas the smallest coherence emerged in temporal areas (T5–T6) in inter-hemispheric areas and fronto-temporal areas (T5–F8) in intra-hemispheric areas.
Fig. 6.
Coherence of the eight specific electrode pairs in the alpha2 frequency band for AD and the control group. Standard deviations are shown with error bars. Asterisk and black down-pointing triangle represent significant difference between the two groups with P < 0.01 after ANOVA and P < 0.00125 after statistical postcorrection
Table 2.
Results of ANOVA for coherence of eight specific electrode pairs in the alpha2 frequency band between AD and the control group
| Electrode-pairs | F-value | P-value |
|---|---|---|
| C3–C4 | 29.3156 | 3.62E−06 |
| F3–F4 | 20.84225 | 5.11E−05 |
| F7–F8 | 44.9152 | 6.24E−08 |
| T5–T6 | 11.97177 | 0.001249007 |
| C4–F8 | 7.538349 | 0.009175772 |
| F4–P4 | 6.639514 | 0.013982402 |
| P4–F8 | 8.606642 | 0.005651174 |
| T5–F8 | 8.253178 | 0.006622278 |
Based on the coherence analysis, the functional network can be reconstructed. When the entry of the coherence matrix (Fig. 5a, b) is larger than the threshold θ (Here we set θ = 0.34), the entry is set to 1, otherwise 0. By thresholding, a binary adjacency matrix Aij is obtained where a non-zero entry aij represented a connection is existed between electrode i and electrode j. Thus, functional connectivity can be extracted from the coherence matrix for the two groups and its structural properties could be further quantified.
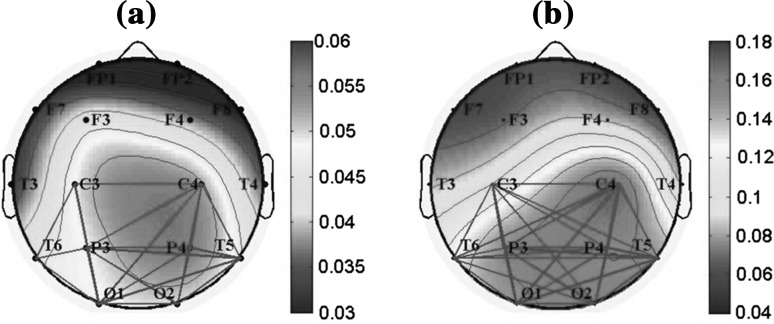
Figure 7 showed the topographic maps of the relative PSD in the alpha2 frequency band for AD and the control group. Meanwhile, the functional connections based on coherence (gray links in Fig. 7) were investigated between the electrodes with high relative PSD values in red color: C3, C4, P3, P4, O1, O2, T5, and T6. It was found that, for both groups, the electrode with high PSD values had more local functional connections. Moreover, it was suggested that, for AD group, the local functional connections in parieto-occipital areas were much sparser than that of the control group, indicating that the synchrony level, such as information transmission and synergies, were much lower.
Fig. 7.
Topographic maps of the relative PSD in the alpha2 frequency band for (a) AD group and (b) the control group. Meanwhile, the local functional connections based on coherence are shown between the electrodes with high relative PSD values in red color: C3, C4, P3, P4, O1, O2, T5, and T6. Here, the threshold is 0.34. When the coherence value between two electrodes is larger than 0.34, an edge in gray is existed. (Color figure online)
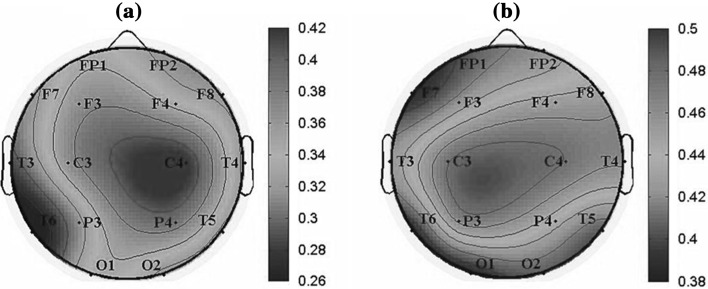
We further investigated the normalized degree of the functional network of the whole brain in the alpha2 frequency band for AD and the control group, as shown in Fig. 8. The node with red color was with high degree. It was found that the values of normalized degree range in the interval [0.26, 0.46] for AD group, while they ranged in the interval [0.38, 0.5] for the control group, suggesting that the functional connections in AD groups decreased markedly. Moreover, it was revealed that the important regions in the brain network of the two groups were both parietal regions. For the control group, the electrode with the largest degree was C3 (left-parietal region) and with relatively low degree in T5, T6, O1 and O2. While for AD group, the electrode with the largest degree was shifted to C4 (right-parietal region) and the smallest degree was T6.
Fig. 8.
Topographic maps of the normalized degree of functional connectivity extracted from coherence matrix in the alpha2 frequency band for (a) AD group and (b) the control group. The color marked the degree value of each corresponding electrode (blue a low value; red a high value). (Color figure online)
Analysis of the combined feature
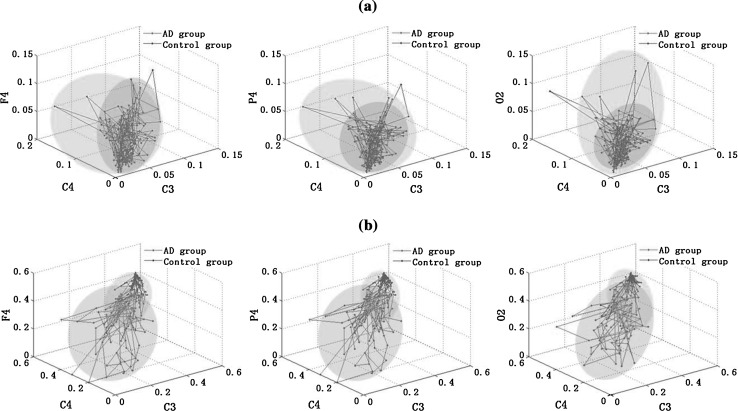
The average values of relative PSD and the normalized degree for three electrodes were calculated in each moving window in the alpha2 frequency band, as shown in Fig. 9a, b). The three electrodes were C3, C4 and F4/P4/O2. C3 and C4 were chosen as they show significant changes of the normalized degree between the two groups, and F4, P4, O2 were chosen from frontal, parietal and occipital brain areas respectively. Then taking these average relative PSD or the normalized degree of three electrodes as coordinates, we could draw a 3D figure for the two groups. Seen from Fig. 9a, it was found that the average relative PSD of two groups was mainly distributed in two shaded areas. Moreover, the shading areas of AD group were smaller than that of the control group, as the relative PSD values were much more concentrated in a smaller range in the alpha2 frequency band. Although the 3D PSD distribution of the two groups were different, the overlapped shading areas were too large, thus it was difficult to discriminate AD patients from the controls only with this parameter. And similar results could also be obtained with the normalized degree (Fig. 9b). In sum, the classification of AD patients and the controls with only one feature might be less efficient. Thus we considered the combination of the two features in the next work.
Fig. 9.
3D figures of (a) the relative PSD; and (b) the normalized degree of functional connectivity extracted from coherence for three electrodes in the alpha2 frequency band. The three electrodes chosen are C3, C4 and F4/P4/O2, respectively. Here, the moving window is set to 128 sampling points (125 ms)
In this part, cluster analysis was used for the primary classification in the feature space consisting of relative PSD value, normalized degree value, and the both in the alpha2 frequency band, as shown in Fig. 10. The dimensionality of features was first reduced via principal components analysis (PCA), a well-known technique for dimensionality reduction (Jolliffe 1986). We found the first two principal components provided 88.6 % of the total variance explained, while each of the remaining components explains less than 5 %. Thus the first two principal components were retained and the two scores, projections of the original data onto the two principal component axes, were calculated. Seen from Fig. 10, the combined feature of the relative PSD and normalized degree achieved a better result in the clustering compared with the results classified with only one feature, manifested as smaller overlap area between AD group and the control group.
Fig. 10.
Clustering analysis based on PCA for AD group and the control group with (a) the relative PSD; (b) the normalized degree of the functional connectivity extracted from coherence; and (c) the combined feature
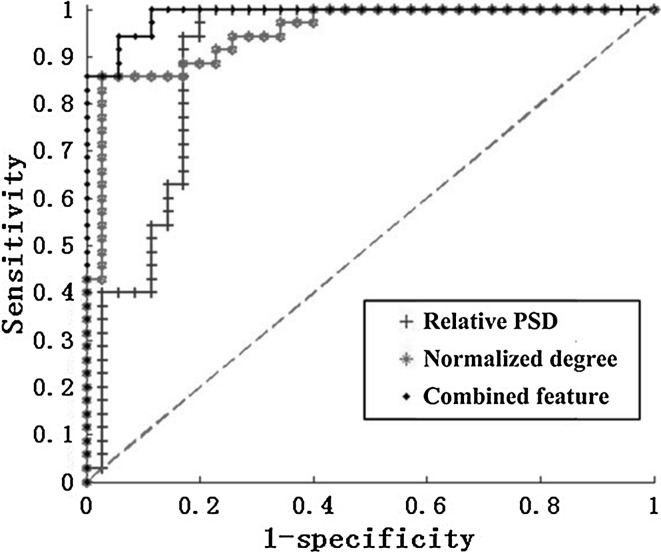
Finally, the corresponding ROC curves which summarized the performance of a two-class classifier for different threshold were shown in Fig. 11. We calculated the areas under the ROC curve (AUC) of the three features in the figure. Generally, the larger the AUC is, the better the classification. From Fig. 11, it was shown that the AUC of the combined feature was larger than the other two cases with only one feature. In addition, the results of the threshold, sensitivity, specificity, AUC and accuracy for the three features were shown in Table 3. It was found that the best classification was achieved using the combined feature with an accuracy of 91.4 % corresponding to the optimum threshold 0.5104. Moreover, the highest sensitivity, specificity and AUC were reached, which are 100, 82.9 % and 0.9886, respectively. It could be concluded that the combined feature provided a better classification between the two groups than any other features.
Fig. 11.
ROC curves which assesses the classification performance between AD patients and the normal controls in the alpha2 frequency band with the relative PSD, the normalized degree, and the combined feature. Moreover, the green dotted line is known as the “no-discrimination line” and corresponds to a classifier which returns random guesses. (Color figure online)
Table 3.
Results of the ROC analysis for the relative PSD, the normalized degree of the functional connectivity and the combined feature, which includes threshold, sensitivity, specificity, area under the ROC curve (AUC) and accuracy
| Threshold | Sensitivity (100 %) | Specificity (100 %) | AUC | Accuracy (100 %) | |
|---|---|---|---|---|---|
| Relative PSD | 0.4644 | 97.1 | 80.0 | 0.8955 | 88.5 |
| Degree of network | 0.4937 | 91.4 | 74.3 | 0.9478 | 82.9 |
| The combined feature | 0.5104 | 100.0 | 82.9 | 0.9886 | 91.4 |
Discussion
In this study, we have analyzed the EEG signals of 14 AD patients and 14 age-matched normal controls during resting conditions. It has been shown that EEG analysis could give information and reflects the disturbed brain functions of patients with advanced AD (Claus et al. 1999; Dauwels et al. 2010a, b; Hidasi et al. 2007; Jelles et al. 2008). Relative PSD and functional connectivity extracted from coherence were calculated to quantify the abnormalities of spectrum and synchrony in AD patients. The PSD of EEG has been widely applied to show the power of different brain areas (Akin and Kiymik 2000), and the coherence measures the synchrony between two cortical regions of the brain in frequency domain (Dauwels et al. 2010a, b; Koenig et al. 2005; Pereda et al. 2005; Stam et al. 2003, 2005).
As for spectrum analysis, compared to the normal controls, the relative PSD values of AD patients were higher in the delta and theta frequency bands, and lower in the alpha1, alpha2, beta, and gamma frequency bands. Considering the fact that the relative PSD is positively correlated with the energy (Elgendi et al. 2011; Vecchio et al. 2003), the results obtained suggest that brains affected by AD show a much slower physiological behavior. These abnormalities could reflect two different pathophysiological changes: the relative PSD decrease for higher frequencies could be related to alterations in cortico-cortical connections, whereas the increase for lower frequencies could be related to the lack of influence of subcortical cholinergic structures on cortical electrical activity (Jeong 2004; Molnár et al. 2006; Moretti et al. 2009). And the loss of cholinergic neurons in the basal forebrain projecting to the hippocampus and the neocortex may play an important role in this process (Dringenberg 2000). In addition, the relative PSD values were increased in the theta frequency band and significantly decreased in the alpha2 frequency band for AD patients. From the view of global cognition, decreased alpha2 reactivity is associated with the worse performance on memory (Jelic et al. 2000; van der Hiele et al. 2007). Thus, only the alpha2 frequency band where the group difference was significant was chosen to further assess the abnormalities of AD brain in this work.
Our findings are in accordance with other studies showing spectral “slowing” in AD (Czigler et al. 2008; Dauwels et al. 2010a, b, 2011; van der Hiele et al. 2007). For instance, Jeong (2004) have observed a slowing of the resting EEG in AD patients, reflected by a higher power in the theta frequency band. Dauwels et al. (2010a, b) have further demonstrated that AD patients showed an increase of delta and theta spectrum and a decrease of alpha and/or beta spectrum. The increase in theta power generally appears during the early stage of AD, whereas the decrease in the alpha frequency is regarded as a characteristic of the developed stage of AD (Ponomareva et al. 2003). Moreover, Fernández et al. (2006) have drawn the similar conclusion by the analysis of spontaneous magnetoencephalography (MEG) signals. However, van Deursen et al. (2008) have indicated the increased oscillations in the gamma frequency band in AD patients, while in this work the relative PSD in the gamma frequency was slightly decreased. The possible explanation of the difference may be that the gamma frequency band we set was narrow, which was just ranged from 30 to 40 Hz here, thus few spectral information was obtained. In spite of this, the results of relative PSD estimated from recorded EEG signals in AD group observed by the AR Burg method might be used as a potential method to discriminate between AD patients and the controls.
It is generally accepted that there are alterations of EEG rhythms in the AD brain: (1) EEG slowing; that is, a shift of the power spectrum toward the lower frequency bands (delta and theta band) along with a decrease of oscillations in the higher frequency bands (alpha and beta); (2) decreased complexity, which is strongly related to the slowing of EEG; and (3) decreased synchrony, from which the functional network can be extracted (Dauwels et al. 2010a, b, 2011, 2013; Stam et al. 2003, 2005, 2007). Notably, AD has been described as a disconnection syndrome, where functional interactions in the brain are strongly affected by anatomical abnormalities among different cortical areas (Jelles et al. 1999) and altered cholinergic coupling interactions among cortical neurons (Jeong 2004). Thus, nowadays, several studies about functional networks have been carried out to explore the dysconnectivity of AD from neurophysiological signals (He et al. 2009; Joudaki et al. 2012; Stam et al. 2007, Stam 2010). Recent studies have proposed that AD is characterized by the conversion from small-world network architecture to less optimal functional topologies (Sanz-Arigita et al. 1994; He et al. 2008; Supekar et al. 2008). Our findings also support this idea. It was found that the functional connections of different brain areas in AD group were significantly decreased in the alpha2 frequency band, which may be associated with the AD deficiencies in information processing physiologically (Delbeuck et al. 2003; Reid and Evans 2013). Moreover, a lower level of synchronization in alpha band has been reported consistently by the most earlier EEG and MEG studies (Adler et al. 2003; Dauwels et al. 2010a, b; Koenig et al. 2005; Knott et al. 2000; Locatelli et al. 1998; Stam et al. 2006). The main reasons for the lower synchrony might be the widespread degeneration of synapses and death of neurons, a general effect of neurotransmitter deficiency or a decrease in the connectivity of local neural networks due to nerve cell death (Jelles et al. 1999; Jeong 2004). While the results of EEG synchrony obtained from other frequency bands are different, for instance, Gallego-Jutglà et al. (2012) have found that EEG of AD patients is more synchronous than in healthy subjects within the optimized range 5–6 Hz, which is in contrast with the loss of synchrony in AD EEG reported earlier.
Taken as a synchrony measure, EEG coherence is commonly interpreted as a linear measure of functional connectivity in the frequency domain between different brain areas (Dauwels et al. 2010a, b; Koenig et al. 2005; Pereda et al. 2005; Stam et al. 2003, 2005). The higher the coherence is, the higher the synchrony is, which indicates a strong functional coupling between the brain areas of interest, thus an increased neural information exchange, functional coordination, and integrity of cortical neural pathways in physiology (Dauwels et al. 2010a, b; Lizio et al.2011; Pereda et al. 2005). Using conventional coherence to study the EEG of patients with AD, changes of coherence in the alpha band have been reported frequently. Jelles et al. (2008) have found a decrease in AD global coherence in the alpha2 frequency band. Moreover, Sankari et al. (2012) have indicated that the parietal and central areas of AD brain show significant declines in cortical connections in the alpha band. However, Stam et al. (2006) have demonstrated that coherence showed a pattern of parieto-occipital increase in the alpha2 frequency in AD. Three possible factors may be involved in the divergent findings: (1) the different composition of AD patient samples, including the difference of sex, age and degree of the disease’s severity (reflected by the MMSE scored); (2) the different data types and data smoothing processing; (3) the different choice of frequency bands.
It has also been found that both the relative PSD and coherence of AD group are lower than that of control group in the alpha2 frequency band, particularly in parieto-occipital brain areas, which might represent the cognitive dysfunction. Similar to our findings, Spiegel et al. (2006) have found that cognitive impairment of AD is characterized by decreased power and coherence in the alpha/beta frequency band while increased power and coherence in the delta/theta frequency band. Rossini et al. (2006) have also distinguished subjects of mild cognitive impairment (MCI) from AD subjects reliably by the analysis of EEG power and coherence. However, these studies only apply one separate feature, either PSD or coherence, to classify AD patients and the normal controls. Here, we attempted to improve the accuracy of the classification of the two groups by combining the relative PSD and the normalized degree of functional network extracted from coherence. A ROC curve was used to assess the ability of the combined feature in classifying AD patients and the normal controls. Using the combined feature, an accuracy of 91.4 % (100 % sensitivity; 82.9 % specificity) was achieved. With single relative PSD, an accuracy of 88.5 % (97.1 % sensitivity; 80.0 % specificity) was reached, and the accuracy was 82.9 % (91.4 % sensitivity; 74.3 % specificity) for the normalized network degree. Thus the proposed combined feature might be a potential method to detect the abnormalities of AD and distinguish AD patients from the normal controls.
Some limitations of this paper need to be paid attention to. First of all, the sample size was small. Although the number of subjects in the present study was relatively low, the statistically significant findings might potentially distinguish AD patients from the normal controls. Moreover, the application of Bonferroni correction could minimize the type I error and improve the accuracy of statistical analysis. In addition, only severe AD patients were chosen as the subjects to compare with the normal controls in this study, and the mild cognitive impairment (MCI) patients, moderate AD patients were not considered. Therefore, although the results seem to indicate that the spectral and synchrony features could help in the discrimination of AD patients and the normal controls, our findings are preliminary. The study need be extended on a much larger patient population before it could be accepted as a diagnostic tool with clinical value.
Conclusion
In this paper, we have investigated the abnormalities of corticocortical response of AD patients by analyzing relative PSD and coherence of EEG signals. By the analysis of relative PSD estimated by AR Burg method, it is found that compared with the control group, the relative PSD is increased in the theta frequency band while significantly decreased in the alpha2 frequency bands. Furthermore, coherence analysis is applied to investigate the pair-wise linear synchrony between different electrodes in the alpha2 frequency band. It is shown that the coherence between different brain areas in AD group would be remarkably decreased. Moreover, this descending trend of pair-wise electrodes is much more significant in inter-hemispheric areas than that in intra-hemispheric areas. Based on the coherence matrix, we extract the functional network of brain. It is demonstrates that the functional connections of different brain areas in AD group would be markedly decreased. Particularly, the electrode C3 and C4 in parietal areas undergo great changes on the normalized degree of nodes. Finally, the combined feature of relative PSD and the normalized degree of the functional connectivity extracted from coherence is used to improve the classification of the two groups. The results indicate that the combined feature performs better than any one feature. Thus, the abnormalities of AD brain in the alpha2 frequency band: relative PSD and normalized degree of functional connectivity extracted from coherence matrix can be used as potential features to distinguish AD patients from the normal effectively. Although the sample size of the subjects is small, the results obtained in this paper may facilitate our understanding of the functional alteration in AD brain.
Acknowledgments
This work is supported by Tianjin Municipal Natural Science Foundation under Grants 12JCZDJC21100 and 13JCZDJC27900 and Tianjin Research Program of Application Foundation and Advanced Technology under Grants 14JCQNJC01200.
References
- Abásolo D, Hornero R, Espino P. Analysis of regularity in the EEG background activity of Alzheimer’s disease patients with approximate entropy. Clin Neurophysiol. 2005;116(8):1826–1834. doi: 10.1016/j.clinph.2005.04.001. [DOI] [PubMed] [Google Scholar]
- Adler G, Brassen S, Jajcevic A. EEG coherence in Alzheimer’s dementia. J Neural Transm. 2003;110:1051–1058. doi: 10.1007/s00702-003-0024-8. [DOI] [PubMed] [Google Scholar]
- Akin M, Kiymik MK. Application of periodogram and AR spectral analysis to EEG signals. J Med Syst. 2000;24:247–256. doi: 10.1023/A:1005553931564. [DOI] [PubMed] [Google Scholar]
- Baker M, Akrofi K, Schiffer R, Michael W, Boyle O’. EEG patterns in mild cognitive impairment (MCI) patients. Open Neuroimag J. 2008;2:52–55. doi: 10.2174/1874440000802010052. [DOI] [PMC free article] [PubMed] [Google Scholar]
- Bennys K, Rondouin G, Vergnes C, Touchon J. Diagnostic value of quantitative EEG in Alzheimer’s disease. Clin Neurophysiol. 2001;31:153–160. doi: 10.1016/S0987-7053(01)00254-4. [DOI] [PubMed] [Google Scholar]
- Cabin RJ, Mitchell RJ. To Bonferroni or not to Bonferroni: when and how are the questions. Bull Ecol Soc Am. 2000;81(3):246–248. [Google Scholar]
- Chang C, Glover GH. Time-frequency dynamics of resting-state brain connectivity measured with fMRI. Neuroimage. 2010;50:81–98. doi: 10.1016/j.neuroimage.2009.12.011. [DOI] [PMC free article] [PubMed] [Google Scholar]
- Chen Z, Cao J, Cao Y, Zhang Y, Gu F, Zhu G, Hong Z, Wang B, Cichocki A. An empirical EEG analysis in brain death diagnosis for adults. Cogn Neurodyn. 2008;2(3):257–271. doi: 10.1007/s11571-008-9047-z. [DOI] [PMC free article] [PubMed] [Google Scholar]
- Claus JJ, Strijers RL, Jonkman EJ, Ongerboer de Visser BW, Jonker C, Walstra GJ, Scheltens P, van Gool WA. The diagnostic value of electroencephalography in mild senile Alzheimer’ disease. Clin Neurophysiol. 1999;110:825–832. doi: 10.1016/S1388-2457(98)00076-5. [DOI] [PubMed] [Google Scholar]
- Cook IA, Leuchter AF. Synaptic dysfunction in Alzheimer’s disease: clinical assessment using quantitative EEG. Behav Brain Res. 1996;78:15–23. doi: 10.1016/0166-4328(95)00214-6. [DOI] [PubMed] [Google Scholar]
- Cooper JE. On the publication of the diagnostic and statistical manual of mental disorders: fourth edition (DSM-IV) Br J Psychiatry. 1995;166:4–8. doi: 10.1192/bjp.166.1.4. [DOI] [PubMed] [Google Scholar]
- Czigler B, Csikós D, Hidasi Z, Anna Gaál Z, Csibri E, Kiss E, Salacz P, Molnár M. Quantitative EEG in early Alzheimer’s disease patients-power spectrum and complexity features. Int J Psychophysiol. 2008;68:75–80. doi: 10.1016/j.ijpsycho.2007.11.002. [DOI] [PubMed] [Google Scholar]
- Dauwels J, Vialatte F, Cichocki A. Diagnosis of Alzheimer’s disease from EEG signals: Where are we standing? Curr Alzheimer Res. 2010;7:487–505. doi: 10.2174/156720510792231720. [DOI] [PubMed] [Google Scholar]
- Dauwels J, Vialatte F, Musha T, Cichocki A. A comparative study of synchrony measures for the early diagnosis of Alzheimer’s disease based on EEG. Neuroimage. 2010;49:668–693. doi: 10.1016/j.neuroimage.2009.06.056. [DOI] [PubMed] [Google Scholar]
- Dauwels J, Srinivasan K, Ramasubba Reddy M, Musha T, Vialatte FB, Latchoumane C, Jeong J, Cichocki A. Slowing and loss of complexity in Alzheimer’s EEG: Two sides of the same coin? Int J Alzheimers Dis. 2011;2011:539621. doi: 10.4061/2011/539621. [DOI] [PMC free article] [PubMed] [Google Scholar]
- Dauwels J, Srinivasan K, Reddy MR, Cichocki A. Near-lossless multichannel EEG compression based on matrix and tensor decompositions. IEEE J Biomed Health Inform. 2013;17(3):708–714. doi: 10.1109/TITB.2012.2230012. [DOI] [PubMed] [Google Scholar]
- Delbeuck X, Van der Linden M, Collette F. Alzheimer’s disease as a disconnection syndrome? Neuropsychol Rev. 2003;13:79–92. doi: 10.1023/A:1023832305702. [DOI] [PubMed] [Google Scholar]
- Dringenberg HC. Alzheimer’s disease: more than a ‘cholinergic disorder’—evidence that cholinergic–monoaminergic interactions contribute to EEG slowing and dementia. Behav Brain Res. 2000;115:235–249. doi: 10.1016/S0166-4328(00)00261-8. [DOI] [PubMed] [Google Scholar]
- Elgendi M, Vialatte F, Cichocki A, Latchoumane C, Jeong J, Dauwels J. Optimization of EEG frequency bands for improved diagnosis of Alzheimer disease. Conf Proc IEEE Eng Med Biol Soc. 2011;2011:6087–6091. doi: 10.1109/IEMBS.2011.6091504. [DOI] [PubMed] [Google Scholar]
- Fernández A, Hornero R, Mayo A, Poza J, Gil-Gregorio P, Ortiz T. MEG spectral profile in Alzheimer’s disease and mild cognitive impairment. Clin Neurophysiol. 2006;117:306–314. doi: 10.1016/j.clinph.2005.10.017. [DOI] [PubMed] [Google Scholar]
- Fraga FJ, Falk TH, Kanda PA, Anghinah R. Characterizing Alzheimer’s disease severity via resting-awake EEG amplitude modulation analysis. PLoS ONE. 2013;8(8):e72240. doi: 10.1371/journal.pone.0072240. [DOI] [PMC free article] [PubMed] [Google Scholar]
- Freund RJ, Littell RC. SAS for linear models: a guide to the ANOVA and GLM procedures. Cary: SAS Institute; 1981. [Google Scholar]
- Gallego-Jutglà E, Elgendi M, Vialatte F, Solé-Casals J, Cichocki A, Latchoumane C, Jeong J, Dauwels J. Diagnosis of Alzheimer’s disease from EEG by means of synchrony measures in optimized frequency bands. Conf Proc IEEE Eng Med Biol Soc. 2012;2012:4266–4270. doi: 10.1109/EMBC.2012.6346909. [DOI] [PubMed] [Google Scholar]
- Gerhard F, Pipa G, Lima B, Neuenschwander S, Gerstner W. Extraction of network topology from multi-electrode recordings: Is there a small-world effect? Front Comput Neurosci. 2011;7:4–5. doi: 10.3389/fncom.2011.00004. [DOI] [PMC free article] [PubMed] [Google Scholar]
- Gianotti LR, Künig G, Lehmann D, Faber PL, Pascual-Marqui RD, Kochi K, Schreiter-Gasser U. Correlation between disease severity and brain electric LORETA tomography in Alzheimer’s disease. Clin Neurophysiol. 2007;118:186–196. doi: 10.1016/j.clinph.2006.09.007. [DOI] [PubMed] [Google Scholar]
- Han CX, Wang J, Yi GS, Che YQ. Investigation of EEG abnormalities in the early stage of Parkinson’s disease. Cogn Neurodyn. 2013;7(4):351–359. doi: 10.1007/s11571-013-9247-z. [DOI] [PMC free article] [PubMed] [Google Scholar]
- He Y, Chen Z, Evans A. Structural insights into aberrant topological patterns of large-scale cortical networks in Alzheimer’s disease. J Neurosci. 2008;28:4756–4766. doi: 10.1523/JNEUROSCI.0141-08.2008. [DOI] [PMC free article] [PubMed] [Google Scholar]
- He Y, Chen Z, Gong G, Evans A (2009) Neuronal networks in Alzheimer’s disease. Neurosci 15:333–350 [DOI] [PubMed]
- Hidasi Z, Czigler B, Salacz P, Csibri E, Molnár M. Changes of EEG spectra and coherence following performance in a cognitive task in Alzheimer’s disease. Int J Psychophysiol. 2007;65:252–260. doi: 10.1016/j.ijpsycho.2007.05.002. [DOI] [PubMed] [Google Scholar]
- Hogan MJ, Swanwick GR, Kaiser J, Rowan M, Lawlor B. Memory-related EEG power and coherence reductions in mild Alzheimer’s disease. Int J Psychophysiol. 2003;49:147–163. doi: 10.1016/S0167-8760(03)00118-1. [DOI] [PubMed] [Google Scholar]
- Jelic V, Johansson SE, Almkvist O, Shigeta M, Julin P, Nordberg A, Winblad B, Wahlund LO. Quantitative electroencephalography in mild cognitive impairment: longitudinal changes and possible prediction of Alzheimer’s disease. Neurobiol Aging. 2000;21:533–540. doi: 10.1016/S0197-4580(00)00153-6. [DOI] [PubMed] [Google Scholar]
- Jelles B, van Birgelen JH, Slaets JP, Hekster RE, Jonkman EJ, Stam CJ. Decrease of non-linear structure in the EEG of Alzheimer patients compared to healthy controls. Clin Neurophysiol. 1999;110(7):1159–1167. doi: 10.1016/S1388-2457(99)00013-9. [DOI] [PubMed] [Google Scholar]
- Jelles B, Scheltens P, van der Flier WM, Jonkman EJ, da Silva FH, Stam CJ. Global dynamical analysis of the EEG in Alzheimer’s disease: frequency-specific changes of functional interactions. Clin Neurophysiol. 2008;119:837–841. doi: 10.1016/j.clinph.2007.12.002. [DOI] [PubMed] [Google Scholar]
- Jeong J. EEG dynamics in patients with Alzheimer’s disease. Clin Neurophysiol. 2004;115:1490–1505. doi: 10.1016/j.clinph.2004.01.001. [DOI] [PubMed] [Google Scholar]
- Jiang ZY. Abnormal cortical functional connections in Alzheimer’s disease: analysis of inter- and intra-hemispheric EEG coherence. J Zhejiang Univ Sci B. 2005;6:259–264. doi: 10.1631/jzus.2005.B0259. [DOI] [PMC free article] [PubMed] [Google Scholar]
- Jolliffe IT. Principal component analysis. New York: Springer; 1986. [Google Scholar]
- Joudaki A, Salehi Niloufar, Jalili mail Mahdi, Knyazeva MG. EEG-based functional brain networks: Does the network size matter? PLoS ONE. 2012;7(4):e35673. doi: 10.1371/journal.pone.0035673. [DOI] [PMC free article] [PubMed] [Google Scholar]
- Kay SM. Modern spectral estimation: theory and application. New Jersey: Prentice-Hall; 1988. [Google Scholar]
- Knott V, Mohr E, Mahoney C, Ilivitsky V. Electroencephalographic coherence in Alzheimer’s disease: comparisons with a control group and population norms. J Geriatr Psychiatry Neurol. 2000;13:1–8. doi: 10.1177/089198870001300101. [DOI] [PubMed] [Google Scholar]
- Koenig T, Prichep L, Dierks T, Hubl D, Wahlund LO, John ER, Jelic V. Decreased EEG synchronization in Alzheimer’s disease and mild cognitive impairment. Neurobiol Aging. 2005;26:165–171. doi: 10.1016/j.neurobiolaging.2004.03.008. [DOI] [PubMed] [Google Scholar]
- Lizio R, Vecchio F, Frisoni GB, Ferri R, Rodriguez G, Babiloni C. Electroencephalographic rhythms in Alzheimer’s disease. Int J Alzheimer’s Dis. 2011;2011:927573. doi: 10.4061/2011/927573. [DOI] [PMC free article] [PubMed] [Google Scholar]
- Locatelli T, Cursi M, Liberati D, Franceschi M, Comi G. EEG coherence in Alzheimer’s disease. Electroencephalogr Clin Neurophysiol. 1998;106:229–237. doi: 10.1016/S0013-4694(97)00129-6. [DOI] [PubMed] [Google Scholar]
- Mattson MP. Pathways towards and away from Alzheimer’s disease. Nature. 2004;430:634–639. doi: 10.1038/nature02621. [DOI] [PMC free article] [PubMed] [Google Scholar]
- Molnár M, Csuhaj R, Horváth S, Vastagh I, Gaál ZA, Czigler B, Bálint A, Csikós D, Nagy Z. Spectral and complexity features of the EEG changed by visual input in a case of subcortical stroke compared to healthy controls. Clin Neurophysiol. 2006;117(4):771–780. doi: 10.1016/j.clinph.2005.12.022. [DOI] [PubMed] [Google Scholar]
- Moretti DV, Fracassi C, Pievani M, Geroldi C, Binetti G, Zanetti O, Sosta K, Rossini PM, Frisoni GB. Increase of theta/gamma ratio is associated with memory impairment. Clin Neurophysiol. 2009;120:295–303. doi: 10.1016/j.clinph.2008.11.012. [DOI] [PubMed] [Google Scholar]
- Nunez PL, Wingeier BM, Silberstein RB. Spatial-temporal structures of human alpha rhythms: theory, microcurrent sources, multiscale measurements, and global binding of local networks. Hum Brain Mapp. 2001;13:125–164. doi: 10.1002/hbm.1030. [DOI] [PMC free article] [PubMed] [Google Scholar]
- Pei X, Wang J, Deng B, Wei X, Yu H. WLPVG approach to the analysis of EEG-based functional brain network under manual acupuncture. Cogn Neurodyn. 2014;8(5):417–428. doi: 10.1007/s11571-014-9297-x. [DOI] [PMC free article] [PubMed] [Google Scholar]
- Pereda E, Quiroga RQ, Bhattacharya J. Nonlinear multivariate analysis of neurophysiological signals. Prog Neurobiol. 2005;77:1–37. doi: 10.1016/j.pneurobio.2005.10.003. [DOI] [PubMed] [Google Scholar]
- Ponomareva NV, Selesneva ND, Jarikov GA. EEG alterations in subjects at high familial risk for Alzheimer’s disease. Neuropsychobiology. 2003;48:152–159. doi: 10.1159/000073633. [DOI] [PubMed] [Google Scholar]
- Reid AT, Evans AC. Structural networks in Alzheimer’s disease. Eur Neuropsychopharmacol. 2013;23(1):63–77. doi: 10.1016/j.euroneuro.2012.11.010. [DOI] [PubMed] [Google Scholar]
- Rossini PM, Del Percio C, Pasqualetti P, Cassetta E, Binetti G, Dal Forno G, Ferreri F, Frisoni G, Chiovenda P, Miniussi C, Parisi L, Tombini M, Vecchio F, Babiloni C. Conversion from mild cognitive impairment to Alzheimer’s disease is predicted by sources and coherence of brain electroencephalography rhythms. Neuroscience. 2006;143:793–803. doi: 10.1016/j.neuroscience.2006.08.049. [DOI] [PubMed] [Google Scholar]
- Rubinov M, Sporns O. Complex network measures of brain connectivity: uses and interpretations. Neuroimage. 2010;52(3):1059–1069. doi: 10.1016/j.neuroimage.2009.10.003. [DOI] [PubMed] [Google Scholar]
- Sankari Z, Adeli H, Adeli A. Intrahemispheric, interhemispheric, and distal EEG coherence in Alzheimer’s disease. Clin Neurophysiol. 2011;122:897–906. doi: 10.1016/j.clinph.2010.09.008. [DOI] [PubMed] [Google Scholar]
- Sankari Z, Adeli H, Adeli A. Wavelet coherence model for diagnosis of Alzheimer disease. Clin EEG Neurosci. 2012;43(4):268–278. doi: 10.1177/1550059412444970. [DOI] [PubMed] [Google Scholar]
- Sanz-Arigita EJ, Schoonheim MM, Damoiseaux JS, Rombouts SA, Maris E, Barkhof F, Scheltens P, Schreiter-Gasser U, Gasser T, Ziegler P. Quantitative EEG analysis in early onset Alzheimer’s disease: correlations with severity, clinical characteristics, visual EEG and CCT. Electroencephalogr Clin Neurophysiol. 1994;90:267–272. doi: 10.1016/0013-4694(94)90144-9. [DOI] [PubMed] [Google Scholar]
- Shalbaf R, Behnam H, Moghadam HJ (2014) Monitoring depth of anesthesia using combination of EEG measure and hemodynamic variables. Cogn Neurodyn. doi:10.1007/s11571-014-9295-z [DOI] [PMC free article] [PubMed]
- Spiegel A, Tonner PH, Renna M. Altered states of consciousness: processed EEG in mental disease. Best Pract Res Clin Anaesthesiol. 2006;20:57–67. doi: 10.1016/j.bpa.2005.07.010. [DOI] [PubMed] [Google Scholar]
- Stam CJ. Loss of ‘small-world’ networks in Alzheimer’s disease: graph analysis of FMRI resting-state functional connectivity. PLoS ONE. 2010;5(11):e13788. doi: 10.1371/journal.pone.0013788. [DOI] [PMC free article] [PubMed] [Google Scholar]
- Stam CJ, van der Made Y, Pijnenburg YAL, Scheltens Ph. EEG synchronization in mild cognitive impairment and Alzheimer’s disease. Acta Neurol Scand. 2003;108:90–96. doi: 10.1034/j.1600-0404.2003.02067.x. [DOI] [PubMed] [Google Scholar]
- Stam CJ, Montez T, Jones BF, Rombouts SARB, van der Made Y, Pijnenburg YAL, Scheltens P. Disturbed fluctuations of resting state EEG synchronization in Alzheimer’s disease. Clin Neurophysiol. 2005;116:708–715. doi: 10.1016/j.clinph.2004.09.022. [DOI] [PubMed] [Google Scholar]
- Stam CJ, Jones BF, Manshanden I, Van Cappellen van Walsum AM, Montez T, Verbunt JP, de Munck JC, van Dijk BW, Berendse HW, Scheltens P. Magnetoencephalographic evaluation of resting-state functional connectivity in Alzheimer’s disease. Neuroimage. 2006;32:1335–1344. doi: 10.1016/j.neuroimage.2006.05.033. [DOI] [PubMed] [Google Scholar]
- Stam CJ, Jones BF, Nolte G, Breakspear M, Scheltensc P. Small-world networks and functional connectivity in Alzheimer’s disease. Cereb Cortex. 2007;17(1):92–99. doi: 10.1093/cercor/bhj127. [DOI] [PubMed] [Google Scholar]
- Supekar K, Menon V, Rubin D, Musen M, Greicius MD. Network analysis of intrinsic functional brain connectivity in Alzheimer’s disease. PLoS Comput Biol. 2008;4:e1000100. doi: 10.1371/journal.pcbi.1000100. [DOI] [PMC free article] [PubMed] [Google Scholar]
- Tijms BM, Wink AM, de Haan W, van der Flier WM, Stam CJ, Scheltens P, Barkhof F. Alzheimer’s disease: connecting findings from graph theoretical studies of brain networks. Neurobiol Aging. 2013;34(8):2023–2036. doi: 10.1016/j.neurobiolaging.2013.02.020. [DOI] [PubMed] [Google Scholar]
- Uhlhaas P, Singer W. Neural synchrony in brain disorders: relevance for cognitive dysfunctions and pathophysiology. Neuron. 2006;52:155–168. doi: 10.1016/j.neuron.2006.09.020. [DOI] [PubMed] [Google Scholar]
- van der Hiele K, Vein AA, Reijntjes RH, Westendorp RG, Bollen EL, van Buchem MA, van Dijk JG, Middelkoop HA. EEG correlates in the spectrum of cognitive decline. Clin Neurophysiol. 2007;118:1931–1939. doi: 10.1016/j.clinph.2007.05.070. [DOI] [PubMed] [Google Scholar]
- van Deursen JA, Vuurman EF, Verhey FR, van Kranen-Mastenbroek VH, Riedel WJ. Increased EEG gamma band activity in Alzheimer’s disease and mild cognitive impairment. J Neural Transm. 2008;115:1301–1311. doi: 10.1007/s00702-008-0083-y. [DOI] [PMC free article] [PubMed] [Google Scholar]
- Vecchio F, Babiloni C, Lizio R, Fallani FV, Blinowska K, Verrienti G, Frisoni G, Rossini PM. Resting state cortical EEG rhythms in Alzheimer’s disease: toward EEG markers for clinical applications—a review. Suppl Clin Neurophysiol. 2003;62:223–236. doi: 10.1016/B978-0-7020-5307-8.00015-6. [DOI] [PubMed] [Google Scholar]
- Vemuri P, Jones DT, Jack CR., Jr Resting state functional MRI in Alzheimer’s disease. Alzheimers Res Ther. 2012;4:2. doi: 10.1186/alzrt100. [DOI] [PMC free article] [PubMed] [Google Scholar]
- Vialatte FB, Dauwels J, Musha T, Cichocki A. Audio representations of multi-channel EEG: a new tool for diagnosis of brain disorders. Am J Neurodegener Dis. 2012;1(3):292–304. [PMC free article] [PubMed] [Google Scholar]
- Wang RF, Wang J, Yu H, Wei XL, Yang C, Deng B. Decreased coherence and functional connectivity of electroencephalograph in Alzheimer’s disease. Chaos. 2014;24(3):033136. doi: 10.1063/1.4896095. [DOI] [PubMed] [Google Scholar]
- Yi G, Wang J, Bian H, Han C, Deng B, Wei X, Li H. Multi-scale order recurrence quantification analysis of EEG signals evoked by manual acupuncture in healthy subjects. Cogn Neurodyn. 2013;7(1):79–88. doi: 10.1007/s11571-012-9221-1. [DOI] [PMC free article] [PubMed] [Google Scholar]
- Zhang X, Lei X, Wu T, Jiang T. A review of EEG and MEG for brainnetome research. Cogn Neurodyn. 2014;8(2):87–98. doi: 10.1007/s11571-013-9274-9. [DOI] [PMC free article] [PubMed] [Google Scholar]
- Zhou Y, Wang K, Liu Y, Song M, Song SW, Jiang T. Spontaneous brain activity observed with functional magnetic resonance imaging as a potential biomarker in neuropsychiatric disorders. Cogn Neurodyn. 2010;4(4):275–294. doi: 10.1007/s11571-010-9126-9. [DOI] [PMC free article] [PubMed] [Google Scholar]
- Zweig MH, Campbell G. Receiver-operating characteristic (ROC) plots: a fundamental evaluation tool in clinical medicine. Clin Chem. 1993;39:561–577. [PubMed] [Google Scholar]


