

Abstract
Oxidative stress contributes to pathology associated with inflammatory brain disorders and therapies that upregulate antioxidant pathways may be neuroprotective in diseases such as multiple sclerosis. Dimethyl fumarate, a small molecule therapeutic for multiple sclerosis, activates cellular antioxidant signaling pathways and may promote myelin preservation. However, it is still unclear what mechanisms may underlie this neuroprotection and whether dimethyl fumarate affects oligodendrocyte responses to oxidative stress. Here, we examine metabolic alterations in oligodendrocytes treated with dimethyl fumarate by using a global metabolomic platform that employs both hydrophilic interaction liquid chromatography–mass spectrometry and shotgun lipidomics. Prolonged treatment of oligodendrocytes with dimethyl fumarate induces changes in citric acid cycle intermediates, glutathione, and lipids, indicating that this compound can directly impact oligodendrocyte metabolism. These metabolic alterations are also associated with protection from oxidant challenge. This study provides insight into the mechanisms by which dimethyl fumarate could preserve myelin integrity in patients with multiple sclerosis.
Keywords: Metabolomics, Oligodendrocyte, Neuroprotection, Shotgun lipidomics, Hydrophilic interaction liquid chromatography
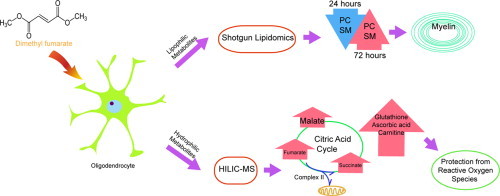
Graphical abstract
Highlights
-
•
DMF treatment significantly alters oligodendrocyte metabolism.
-
•
DMF induces upregulation of antioxidant responses after prolonged treatment and these are protective against oxidative insults.
-
•
Global metabolomics can provide insight into drug mechanism.
Introduction
Metabolic reactions drive fundamental cellular processes, including energy production, signaling, and the generation of precursors for macromolecules. Perturbation of these pathways by disease results in cellular pathology; therefore, the profiling of metabolites has the potential to uncover new disease biomarkers, identify novel therapeutic targets, and provide information on drug mechanism [1,2]. The comprehensive analysis of global metabolism allows the identification of alterations in endogenous small molecules without bias; however, a significant hurdle for these studies is the chemical variability contained within the metabolome. This factor makes a single separation and detection method unlikely to provide complete coverage of all metabolite species [3]. Here we introduce a global metabolomic platform that utilizes both direct-infusion mass spectrometric analysis of lipids (shotgun lipidomics) and a hydrophilic interaction liquid chromatography–mass spectrometric method (HILIC–MS) that measures polar metabolites associated with the tricarboxylic acid cycle (TCA), amino acid, and nucleotide metabolism [4]. Direct infusion of the lipid samples significantly reduces processing time while still detecting high abundance lipids that include biologically important classes such as glycerophospholipids, sphingolipids, and triacylglycerols [5]. The combination of these two methods provides coverage of diverse metabolic pathways critical for cellular function with reduced analysis times.
We sought to utilize our platform to identify metabolic pathways important for neuroprotection, specifically the maintenance of myelin. The myelin sheath is produced by oligodendrocytes and wraps around neuronal axons, facilitating rapid nerve conduction and providing trophic support to neurons [6]. Damage to the myelin or oligodendrocytes leads to the development of lesions within the central nervous system and this is a defining pathological feature of the autoimmune disease, multiple sclerosis [7]. Several mechanisms have been postulated to result in demyelination during multiple sclerosis, including the release of toxic mediators such as reactive oxidative species as well as direct killing of oligodendrocytes by inflammatory cells [8,9]. The activation of cellular pathways that interrupt these processes may not only prevent demyelination, but also inhibit the axonal degeneration that accompanies the loss of the oligodendroglia-neuronal connection [10].
A number of agents have been tested for their ability to act as neuroprotective agents during central nervous system inflammation. The small molecule drug, dimethyl fumarate (DMF, Tecfidera®) is currently approved for the treatment of multiple sclerosis [11]. Data from human and animal studies suggests that this compound has both anti-inflammatory and antioxidant properties [12–14]. Clinically, a recent study showed that patients treated with DMF had increases in brain magnetization transfer ratio (MTR) and this was thought to correlate with the preservation of myelin density [15]. However, it is unclear whether the myelin protection seen in multiple sclerosis patients treated with DMF is due to the direct modulation of oligodendrocyte functions or if this result is due to its effect on astrocytes, neurons, or inflammatory cells. Analysis of DMF treatment during cuprizone-induced demyelination showed no impact on demyelination and short-term treatment of an oligodendroglial cell line in vitro did not prevent hydrogen peroxide-mediated death [16]. These results suggest that the myelin protection induced by DMF may be secondary to its anti-inflammatory actions. In this study, we sought to clarify whether DMF directly impacts oligodendrocyte physiology by using mass spectrometry-based metabolomics to identify changes in metabolism induced by drug treatment as well as determine the impact of these alterations on oligodendrocyte responses to oxidative stress.
Materials and methods
Chemicals
Ammonium acetate (HPLC, ≥99.0%), ammonium hydroxide solution (LC/MS, ≥25% in H2O), and DMF were purchased from Sigma-Aldrich (St. Louis, MO, USA). LC/MS-grade water, acetonitrile and methanol were purchased from Fisher Scientific (Fair Lawn, NJ, USA). Ethanol was purchased from DeconLaboratories, Inc. (King of Prussia, PA, USA). Chloroform (HPLC Grade, ≥99.5%) was obtained from Alfa Aesar (Ward Hill, MA, USA). For cell culture experiments, Dulbecco's Modification of Eagle's Medium (DMEM), Penicillin/streptomycin, Phosphate-Buffered Saline (PBS) and Fetal Bovine Serum (FBS) were purchased from Corning (Manassas, VA, USA).
Cell culture
The MO3.13 human oligodendrocyte cell line was purchased from CELLutions Biosystems Inc. (Burlington, Ontario, CA). MO3.13 cells were cultured at 37 °C in 5% CO2 in DMEM containing 10% FBS and 1% penicillin/streptomycin for all experiments. Cells were seeded in 6-well plates at a density of 3.0×10⁵ cells/mL for the 24 h experiments or 1.0×10⁵ cells/mL for experiments lasting 72 h.
DMF treatment and metabolite extraction
MO3.13 cells were allowed to adhere and subsequently treated with 10 µM DMF diluted in 0.2% ethanol/PBS or vehicle alone as a control. Treatments were carried out for 24 or 72 h prior to the metabolite extraction [16,17]. Following treatment, a modified form of the Bligh and Dyer Extraction was used to obtain both hydrophilic and lipophilic metabolites for metabolomic analysis [18]. MO3.13 cells were lysed by the addition of 180 µL HPLC grade water with 20 µL methanol and removed from the tissue culture dishes by gentle scraping. The cell suspensions were then subjected to three cycles of freezing in liquid nitrogen, thawing, and sonication. 750 µL of 1:2 (v:v) CHCl3:MeOH and 125 µL CHCl3 were added to each sample, the samples were vortexed, and an additional 250 µL of water was added. After incubation at −20 °C for 1 h, samples were centrifuged at 1000×g for 10 min at 4 °C to give a two-phase system: an aqueous layer on top, an organic layer below, and a protein disk interphase. The aqueous and organic phases were collected into 1.5 mL tubes separately. All the extracted samples were dried in a CentriVap Concentrator (LABCONCO, Kansas, MO, USA) and then preserved at −80 °C until resuspension and analysis. Protein pellets were used to normalize extracted metabolites quantities based on protein concentration with a Bicinchoninic Acid (BCA) protein assay (G-Biosciences, St. Louis. MO, USA) [19].
Hydrogen peroxide treatment and MTT assay
MO3.13 cells were seeded in a 96-well plate at a density of 7.5×10³ cells/mL for the 24 h treatment, or 2.5×10³ cells/mL for the 72 h treatment (12 replicates per treatment group). Cells were treated with 1 or 10 µM DMF, PBS, or 0.2% ethanol (vehicle). PBS-treated cells were used for viability normalization based on absorbance. After drug treatment, 400 µM hydrogen peroxide was added to the cells for 2 h. 20 µL of a 5 mg/mL Thiazolyl Blue Tetrazolium Bromide (MTT) PBS solution was subsequently added to all the wells and cultures were incubated at 37 °C for 3.5 h. The media was then aspirated and 150 µM of lysis solvent (4 mM HCl, 0.1% Nondet P-40 (NP40) in isopropanol) was added to dissolve the insoluble purple formazan product into a colored solution. The plates were then covered with aluminum foil and agitated on an orbital shaker for 15 min. The absorbance was read at 590 nm with a reference filter of 620 nm by using a SpectraMax™ M2 plate reader [20].
HILIC–MS profiling of metabolites
Chromatographic separation was carried out on a Micro200 LC (Eksigent, Redwood, CA, USA) equipped with a hydrophilic interaction liquid chromatography (HILIC) column (Luna 3 μ NH2 100 Å, 150 mm×1.0 mm, Phenomenex, Torrance, CA, USA). The polar metabolites were re-suspended in 200 µL of a 35:65 (v:v) acetonitrile: water solution, and 5 µL of the sample was injected into the column. The liquid chromatographic method consisted of a mobile phase A of water and a mobile phase B of acetonitrile, each with the addition of 5 mM ammonium acetate and 5 mM ammonium hydroxide. The flow rate was 30 µL/min. The gradient consisted of the following linear changes in mobile phase B over time: 0 min 98%, 0.5 min 98%, 1 min 95%, 5 min 80%, 6 min 46%, 13 min 14.7%, 17 min 0%, 17.1 min 100%, 23 min 100%.
Samples were analyzed on the 5600+ TripleTOF Mass Spectrometer (AB SCIEX, Framingham, MA, USA) in both positive and negative mode and were processed with Information Dependent Acquisition (IDA). The ion source nebulizer gas (GS1) used was set at 15 psi, heater gas (GS2) was 20 psi, and the curtain gas (CUR) was 25 psi. In the IDA experiment, a TOF MS scan was selected to perform a survey scan for the mass range of 60–1000 Da. This survey scan utilized a 250 ms accumulation time for precursor ion acquisition. In the positive mode, +5000 V ionspray voltage was used and a +100 V declustering potential (DP) was selected to increase precursor ions detection. The background threshold for candidate ion selection was set to 10 counts/s to eliminate peaks with low abundance as well as a low signal to noise (S/N) ratio. Fragmentation data were subsequently collected by using a collision energy spread (CES) of +(25−40) V. Samples analyzed in negative mode used the same GS1, GS2 and CUR in IDA criteria. A −4500 V ionspray voltage was used and a −100 V declustering potential (DP) was selected for better precursor ion detection. Fragmentation data were subsequently collected by using a collision energy spread (CES) of −(40–25) V.
Shotgun lipidomics
A direct-infusion mass spectrometric analysis (MS/MSALL) method was applied for analysis of lipophilic metabolites [21]. Metabolites obtained in the organic phase after extraction were re-suspended in a methanol:chloroform:water (v:v:v, 45:45:10, 5 mM ammonia acetate) solution and directly injected into the mass spectrometry without chromatographic separation at a flow rate of 7 µL/min. The ion source nebulizer gas (GS1) used was set at 14 psi, the heater gas (GS2) was 15 psi, the curtain gas (CUR) was 25 psi.
A MS/MSALL method was used to scan a mass range of 200–1200 Da followed by 1000 individual MS/MS experiments. In the survey TOF MS scan, +80.0 V DP and +10.0 V CE were selected for positively charged ions; and −80.0 V DP and −10.0 V CE for negatively charged ions. With a 3000 ms accumulation time, ions with a mass range starting at 200.050 Da and finishing with 1200.049 Da were detected. The product ion IDA scan selected candidate ions step by step and split the precursor ions detected by the survey TOF MS scan into 1000 steps with a 1.001 Da window width, generating MS/MS spectra for each precursor ions within 300 ms. Precursors were fragmented with ±30.0–50.0 V collision energy spread under positive or negative mode respectively.
Data processing
The initial processing of the HILIC–MS data were performed by using MarkerView (version 1.2.1.1). Isotopic ion peaks were excluded before analysis. A false discovery rate (FDR) algorithm was adopted from Storey's QVALUE R package [22]. All the results were analyzed under the bootstrap method to obtain the q-value (Q-plots are provided in Supplementary Fig. S1). Features with (q-value <0.05, and fold change >2) were considered significantly changed. Principal component analysis (PCA) was performed with the Pareto Scaling method to compare groups. Features were identified by comparing accurate mass and fragmentation data to standards in the METLIN (https://metlin.scripps.edu) [23–25] and HMDB (http://www.hmdb.ca) databases [26]. Shotgun lipidomic data were processed by using LipidView software (AB Sciex) with a mass tolerance of 0.05 Da, min% intensity=0.1% and S/N≥3. Lipids with different chain length were indicated by their fragments’ mass to charge ratios.
Results and discussion
We first addressed the technical challenge of obtaining sufficient coverage of global metabolism without extensive analysis times. The combination of two methods, HILIC–MS and shotgun lipidomics, allowed the detection of metabolite classes with diverse chemical properties. Our separation method detected a significant number of polar metabolites involved in central carbon, amino acid, and nucleic acid metabolism. When HILIC–MS was combined with shotgun lipidomics, we could extend our coverage to glycerophospholipids, sphingomyelins, and free fatty acids (method detailed in Supplementary Fig. S2). After validation, we applied our platform to investigate the mechanism of action of DMF.
DMF has been shown to activate nuclear factor (erythroid derived 2)-like 2 (Nrf2) and induce a cascade of cytoprotective [12–14] and antioxidant pathways [8,27,28]. Additionally, DMF can suppress the transcription factor NF-κB that mediates pro-inflammatory signaling [29,30]. Whether the neuroprotective effects seen with this drug are secondary to immunosuppression in multiple sclerosis is still unclear. We hypothesized that DMF may also play a direct role in the protection of mature oligodendrocytes and myelin through the modulation of cellular metabolism. In order to test this, we treated MO3.13 cells with DMF (10 µM) for 24 or 72 h and subsequently determined the impact of this drug on the metabolome. Principal component analysis (PCA) demonstrates significant metabolic differences in DMF-treated oligodendrocytes versus controls at both 24 and 72 h (Fig. 1A and B). We found that at 24 h approximately 3148 features were dysregulated when comparing DMF-treated and control cells and this number increased to 4960 features after 72 h of drug treatment (based on a q-value <0.05 and fold change >2). We then identified these dysregulated metabolites based on accurate mass and fragmentation data (Supplementary Fig. S3). An example of cellular changes that were detected included temporal alterations in amino acids. At 24 h, glutamine was upregulated in DMF-treated MO3.13 cells, but returned to control levels after 72 h (Fig. 1C). In contrast, DMF treatment upregulated arginine at 24 h, but this amino acid was subsequently decreased at 72 h compared to vehicle controls (Fig. 1D). These results indicate that DMF can alter oligodendrocyte metabolism and that these changes are dependent on the length of treatment.
Fig. 1.
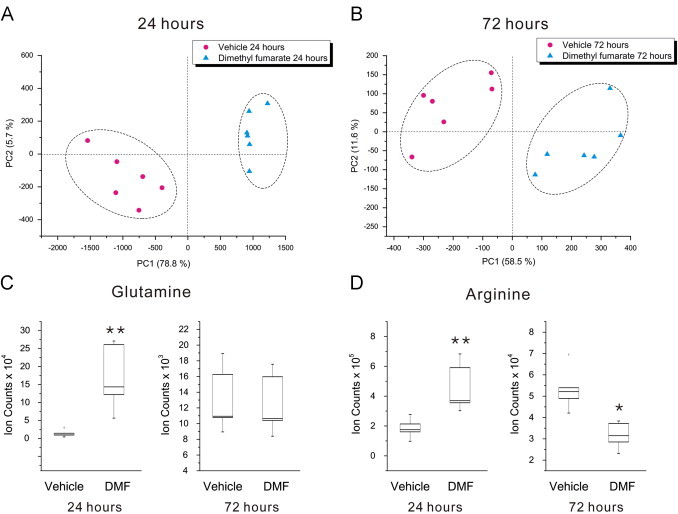
DMF treatment alters oligodendrocyte metabolism. Principal component analysis of the metabolic alterations associated with 10 µM DMF treatment at 24 (A) and 72 h (B). (C) Box and whisker plot of glutamine, showing significant upregulation after 24 h treatment (p=0.002, q=0.007), but a return to control levels by 72 h (p=0.89, q=0.13). (D) Box and whisker plot of arginine, which is increased at 24 h (p=0.002, q=0.05), but downregulated after 72 h of DMF treatment (p=0.02; q=0.012). *q-value <0.05, **q-value <0.01; N=6 replicates per group, representative of two separate experiments.
Methylated esters of tricarboxylic acid (TCA) cycle intermediates are cell permeable and have the ability to modify the activity of this metabolic pathway [31,32]. Therefore, we examined the levels of TCA cycle intermediates proximate to fumarate. Within the TCA cycle, succinate is oxidized to fumarate and subsequently hydrated to malate via the action of two enzymes, succinate dehydrogenase and fumarase. We found that after 24 and 72 h of DMF treatment these intermediates were significantly upregulated compared to controls (Fig. 2A–C). The succinate to fumarate reaction is coupled to the production of reducing equivalents and functions in both the TCA cycle and the electron transport chain. The dysregulation of these metabolites could influence electron transport chain function and subsequent antioxidant responses. A recent study has shown that increased fumarate levels can drive production of succinate through a reversal of Complex II function leading to the generation of reactive oxidative species [33]. Therefore, perturbations in succinate and fumarate induced by DMF have the potential to influence mitochondrial function and may facilitate the activation of antioxidant signaling.
Fig. 2.
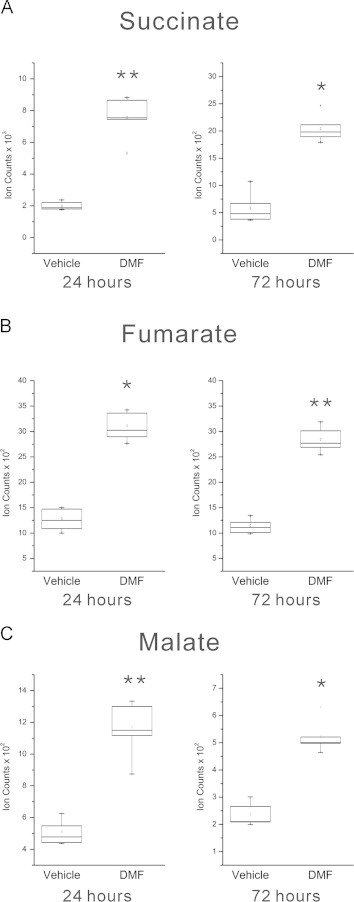
DMF treatment perturbs TCA cycle metabolism in oligodendrocytes. Box and whisker plots for succinate (A), fumarate (B), and malate (C) all showing upregulation after DMF treatment for 24 and 72 h compared to vehicle-treated controls (succinate p=0.004, q=0.009 at 24 h, p=0.046; q=0.021 at 72 h; fumarate p=0.017, q=0.020 at 24 h, p = 0.001, q=0.002 at 72 h; and malate p=0.002; q=0.003 at 24 h, p=0.020, q=0.040 at 72 h). *q-value <0.05, **q-value <0.01; N=6 replicates per group, representative of two separate experiments.
We then analyzed levels of reduced glutathione (GSH), a key molecule involved in the detoxification of antioxidant species [34,35]. We found that DMF treatment increased GSH levels in MO3.13 cells at both 24 and 72 h (Fig. 3A). This effect is consistent with experimental evidence showing that GSH levels in neurons were increased by DMF treatment [36]. Similarly, DMF treatment of human astrocytes induced early depletion of cellular GSH followed by recovery and a subsequent increase of this antioxidant above basal levels by 24 h [37]. We also found DMF-induced increases in other antioxidant molecules such as carnitine and ascorbic acid (Supplementary Fig. S4). Carnitine can scavenge free radicals and is protective against oxidative damage in an animal model of Huntington's disease [38,39]. Ascorbic acid is an essential micronutrient and one of the major low molecular weight antioxidants present in the brain [40]. Ascorbic acid has also been shown to promote the myelination of peripheral nerves [41]. In addition, it is involved in the maintenance of membrane integrity during oxidative stress by reducing the tocopheroxyl radical of vitamin E and preventing lipid peroxidation [42]. The ability of DMF to increase levels of these low molecular weight antioxidants suggests that this compound may function by increasing the levels of antioxidant proteins through the Nrf2 pathway and promoting the uptake or synthesis of protective small molecules.
Fig. 3.
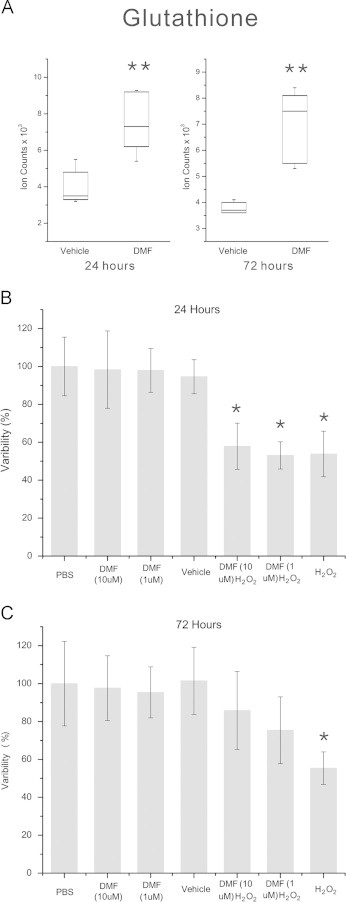
DMF induces glutathione and protects oligodendroglial cells from oxidative stress. (A) Box and whisker plot of GSH levels after 24 and 72 h of treatment with 10 µM DMF. GSH is significantly increased at both time points (**q<0.01, p=0.0006, q=0.004 at 24 h and p=0.003, q=0.004 at 72 h). (B) MTT assay of MO3.13 cells treated with DMF for 24 h and exposed to 400 µM hydrogen peroxide for 2 h. Hydrogen peroxide-treated cells show a significant loss of viability compared to vehicle controls and DMF treatment at both 1 and 10 µM did not significantly alter this reduction in viability. (C) MTT assay of MO3.13 cells treated with DMF for 72 h and challenged with hydrogen peroxide. In contrast to vehicle-treated controls, hydrogen peroxide-treated cells show reduced viability that was rescued by pre-treatment with DMF. *p-value <0.05, Kruskal–Wallis test, N=12 replicates per group, experiment repeated 3 times.
The role of DMF in stimulating pathways that protect against oxidative stress has shown conflicting results in different cell types [16,43]. We sought to determine whether the DMF-mediated changes in antioxidant metabolites that we observed in the MO3.13 cells could provide protection against hydrogen peroxide-induced cell death. Cells were treated with 1 or 10 µM DMF for 24 or 72 h and then challenged with 400 µM hydrogen peroxide for 2 h (Fig. 3B, C). Vehicle-treated cells incubated with hydrogen peroxide showed significant loss of viability compared to controls and DMF treatment for 24 h at either 1 or 10 µM did not protect the cells (Fig. 3B). In contrast, after 72 h of DMF treatment, MO3.13 cells exposed to hydrogen peroxide maintained their viability and this response was dose-dependent (Fig. 3C). A number of other studies have examined DMF-mediated antioxidant responses in oligodendrocytes. Short-term (60 min) treatment of rat oligodendroglial cells depleted glutathione levels, although this did not affect viability [44]. A study examining the antioxidant activity of DMF in the glial cell line, CG4 demonstrated that 24 h of drug exposure did not protect the cells from hydrogen peroxide-induced oxidative stress [16]. Our study confirmed that 24 h of treatment was not sufficient to protect against oxidative stress even with the observed increases in antioxidant small molecules. The development of mature, myelinating oligodendrocytes involves changes in migration, proliferation, and myelin production [45]. Metabolic differences are present at each stage of oligodendrocyte differentiation to promote unique functions [46]. The regulation of the TCA cycle and small molecule antioxidants by DMF may also be dependent on the developmental stage of these cells and it remains to be determined if changes in proliferation or migration influence these responses. Future work will also focus on identifying the metabolic factors that are elicited by longer term treatment with DMF as these may mediate the protection from oxidative stress.
The myelin sheath is a major target of the inflammatory response in multiple sclerosis [47] and is composed of approximately 70–80% lipids [48]. The synthesis and incorporation of phospholipids, sphingolipids, and cholesterol are critical for the development and maintenance of the myelin sheath [49,50]. We tested whether DMF might alter lipid homeostasis in oligodendrocytes by profiling membrane lipids with shotgun lipidomics (Fig. 4). Based on clinical data demonstrating neuroprotection, we postulated that this compound might increase lipid synthesis to promote the integrity of the myelin sheath. Unexpectedly, we found that phosphatidylcholines (PC), sphingomyelin species (SM), and free fatty acids (FFAs) were all down-regulated after 24 h of DMF treatment while small increases were seen in phosphatidylethanolamine (PE), phosphatidylserine (PS), and phosphatidylinositol (PI) species (Fig. 4A). This effect was transient as by 72 h PC species as well as SM, PE, PI, and PS are all increased (Fig. 4B). The increases in membrane lipids coincided with the time point where DMF protected against oxidant challenge. It is interesting to speculate that DMF perturbation of the TCA cycle may decrease lipid synthesis initially, but that these metabolic processes recover after longer treatment when sufficient antioxidant responses have been upregulated. Alternatively, prolonged DMF treatment and activation of the Keap1-Nrf2 pathway in oligodendrocytes could influence lipid metabolism by regulating NADPH-generating enzymes involved in fatty acid synthesis or by increasing levels of phospholipid precursors such as serine produced from the glycolytic intermediate 3P-glycerate [51,52]. Future studies will examine the connection between Nrf2 activation and metabolic pathways involved in lipid synthesis and degradation in oligodendrocytes.
Fig. 4.
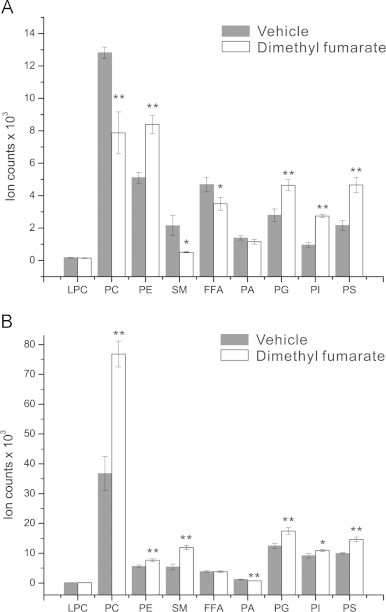
DMF treatment alters lipid metabolism in oligodendroglial cells. MO3. 13 cells were treated with DMF for 24 or 72 h and their lipids were analyzed by using shotgun lipidomics. (A) Lipid profile of MO3.13 cells after 24 h of DMF treatment. Decreased levels of PC (p<0.01) and SM (p<0.05) but increased PE (p<0.01), PI (p<0.01) species were detected. (B) Lipid profile of MO3.13 cells after 72 h of DMF treatment. Both PC (p<0.01) and SM (p<0.01) are significantly increased compared to vehicle controls. **p<0.01, *p-value <0.05, Kruskal–Wallis test, N=6 replicates per condition, repeated three times.
In this study, we have applied a global metabolomic platform which employs a single extraction, a 24-min chromatographic run, and shotgun lipidomic analysis in order to profile changes in the oligodendrocyte metabolome in response to the small molecule neuroprotective agent DMF. Here, we demonstrate that DMF significantly alters oligodendrocyte metabolism, including small molecules involved in antioxidant responses and these changes provide protection against oxidative stress. These results indicate that myelin preservation seen in DMF-treated multiple sclerosis patients may in part be due to a direct action by this drug on oligodendrocytes.
Acknowledgements
This work was supported by the University of Akron. We thank Randy Arnold, Brigitte Simons, and Paul Baker at AB SCIEX for advice and suggestions during method development.
Appendix A. Supplementary materials
Supplementary Material
References
- 1.Kaddurah-Daouk R., Kristal B.S., Weinshilboum R.M. Metabolomics: a global biochemical approach to Drug response and disease. Annual Review of Pharmacology and Toxicology. 2008;48(1):653–683. doi: 10.1146/annurev.pharmtox.48.113006.094715. 18184107 [DOI] [PubMed] [Google Scholar]
- 2.Madsen R., Lundstedt T., Trygg J. Chemometrics in metabolomics − a review in human disease diagnosis. Analytica Chimica Acta. 2010;659(1–2):23–33. doi: 10.1016/j.aca.2009.11.042. 20103103 [DOI] [PubMed] [Google Scholar]
- 3.Theodoridis G., Gika H.G., Wilson I.D. LC–MS-based methodology for global metabolite profiling in metabonomics/metabolomics. Trends in Analytical Chemistry. 2008;27(3):251–260. [Google Scholar]
- 4.Lu W., Bennett B.D., Rabinowitz J.D. Analytical strategies for LC-MS-based targeted metabolomics. Journal of Chromatography B Analytical Technologies in the Biomedical and Life Sciences. 2008;871(2):236–242. doi: 10.1016/j.jchromb.2008.04.031. 18502704 [DOI] [PMC free article] [PubMed] [Google Scholar]
- 5.Han X., Gross R.W. Shotgun lipidomics: electrospray ionization mass spectrometric analysis and quantitation of cellular lipidomes directly from crude extracts of biological samples. Mass Spectrometry Reviews. 2005;24(3):367–412. doi: 10.1002/mas.20023. 15389848 [DOI] [PubMed] [Google Scholar]
- 6.Simons M., Trajkovic K. Neuron-glia communication in the control of oligodendrocyte function and myelin biogenesis. Journal of Cell Science. 2006;119(21):4381–4389. doi: 10.1242/jcs.03242. 17074832 [DOI] [PubMed] [Google Scholar]
- 7.Trapp B.D., Nave K.A. Multiple sclerosis: an immune or neurodegenerative disorder? Annual Review of Neuroscence. 2008;31:247–269. doi: 10.1146/annurev.neuro.30.051606.094313. 18558855 [DOI] [PubMed] [Google Scholar]
- 8.Gilgun-Sherki Y., Melamed E., Offen D. The role of oxidative stress in the pathogenesis of multiple sclerosis: the need for effective antioxidant therapy. Journal of Neurology. 2004;251(3):261–268. doi: 10.1007/s00415-004-0348-9. 15015004 [DOI] [PubMed] [Google Scholar]
- 9.LeVine S.M. The role of reactive oxygen species in the pathogenesis of multiple sclerosis. Medical Hypotheses. 1992;39(3):271–274. doi: 10.1016/0306-9877(92)90121-r. 1335545 [DOI] [PubMed] [Google Scholar]
- 10.Zhang J. Promoting myelin repair and return of function in multiple sclerosis. FEBS Letter. 2011;585(23):3813–3820. doi: 10.1016/j.febslet.2011.08.017. 21864535 [DOI] [PMC free article] [PubMed] [Google Scholar]
- 11.Phillips, J., Fox, R., BG-12 in Multiple Sclerosis. Seminars in Neurology, 33(01) 056–065 [doi:10.1055/s-0033-1343796]. [DOI] [PubMed]
- 12.Duffy S., So A., Murphy T.H. Activation of endogenous antioxidant defenses in neuronal cells prevents free radical-mediated damage. Journal of Neurochemistry. 1998;71(1):69–77. doi: 10.1046/j.1471-4159.1998.71010069.x. 9648852 [DOI] [PubMed] [Google Scholar]
- 13.Lin S.X. The anti-inflammatory effects of dimethyl fumarate in astrocytes involve glutathione and haem oxygenase-1. ASN NEURO. 2011;3(2) doi: 10.1042/AN20100033. 21382015 [DOI] [PMC free article] [PubMed] [Google Scholar]
- 14.Scannevin R.H. Fumarates promote cytoprotection of central nervous system cells against oxidative stress via the nuclear factor (erythroid-derived 2)-like 2 pathway. Journal of Pharmacology and Experimental Therapeutics. 2012;341(1):274–284. doi: 10.1124/jpet.111.190132. 22267202 [DOI] [PubMed] [Google Scholar]
- 15.Arnold D.L. Magnetization transfer ratio in the delayed-release dimethyl fumarate DEFINE study. Journal of Neurology. 2014;261(12):2429–2437. doi: 10.1007/s00415-014-7504-7. [DOI] [PMC free article] [PubMed] [Google Scholar]
- 16.Moharregh-Khiabani D. Effects of fumaric acids on cuprizone induced central nervous system de- and remyelination in the mouse. PLoS One. 2010;5(7):e11769. doi: 10.1371/journal.pone.0011769. 20668697 [DOI] [PMC free article] [PubMed] [Google Scholar]
- 17.Wierinckx A. Detoxication enzyme inducers modify cytokine production in rat mixed glial cells. Journal of Neuroimmunology. 2005;166(1–2):132–143. doi: 10.1016/j.jneuroim.2005.05.013. 15993952 [DOI] [PubMed] [Google Scholar]
- 18.Bligh E.G., Dyer W.J. A rapid method of total lipid extraction and purification. Canadian Journal of Biochemistry and Physiology. 1959;37(8):911–917. doi: 10.1139/o59-099. 13671378 [DOI] [PubMed] [Google Scholar]
- 19.Smith P.K. Measurement of protein using bicinchoninic acid. Analytical Biochemistry. 1985;150(1):76–85. doi: 10.1016/0003-2697(85)90442-7. 3843705 [DOI] [PubMed] [Google Scholar]
- 20.Mosmann T. Rapid colorimetric assay for cellular growth and survival: application to proliferation and cytotoxicity assays. Journal of Immunological Methods. 1983;65(1–2):55–63. doi: 10.1016/0022-1759(83)90303-4. 6606682 [DOI] [PubMed] [Google Scholar]
- 21.Simons B. Shotgun lipidomics by sequential precursor ION fragmentation on a hybrid quadrupole time-of-flight mass spectrometer. Metabolitess. 2012;2(1):195–213. doi: 10.3390/metabo2010195. 24957374 [DOI] [PMC free article] [PubMed] [Google Scholar]
- 22.Storey J.D., Tibshirani R. Statistical significance for genomewide studies. Proceedings of the National Academy of Sciences of the United States of America. 2003;100(16):9440–9445. doi: 10.1073/pnas.1530509100. 12883005 [DOI] [PMC free article] [PubMed] [Google Scholar]
- 23.Smith C.A. METLIN: a metabolite mass spectral database. Therapeutic Drug Monitoring. 2005;27(6):747–751. doi: 10.1097/01.ftd.0000179845.53213.39. 16404815 [DOI] [PubMed] [Google Scholar]
- 24.Tautenhahn R. An accelerated workflow for untargeted metabolomics using the METLIN database. Nature Biotechnology. 2012;30(9):826–828. doi: 10.1038/nbt.2348. 22965049 [DOI] [PMC free article] [PubMed] [Google Scholar]
- 25.Zhu Z.J. Liquid chromatography quadrupole time-of-flight mass spectrometry characterization of metabolites guided by the METLIN database. Nature Protocols. 2013;8(3):451–460. doi: 10.1038/nprot.2013.004. 23391889 [DOI] [PMC free article] [PubMed] [Google Scholar]
- 26.Wishart D.S. HMDB 3.0 − the human Metabolome Database in 2013. Nucleic Acids Research. 2013;41:D801–D807. doi: 10.1093/nar/gks1065. 23161693 [DOI] [PMC free article] [PubMed] [Google Scholar]
- 27.Haider L. Oxidative damage in multiple sclerosis lesions. Brain. 2011;134(7):1914–1924. doi: 10.1093/brain/awr128. 21653539 [DOI] [PMC free article] [PubMed] [Google Scholar]
- 28.van Horssen J. Severe oxidative damage in multiple sclerosis lesions coincides with enhanced antioxidant enzyme expression. Free Radical Biology and Medicine. 2008;45(12):1729–1737. doi: 10.1016/j.freeradbiomed.2008.09.023. 18930811 [DOI] [PubMed] [Google Scholar]
- 29.Brigelius-Flohé R., Flohé L. Basic principles and emerging concepts in the redox control of transcription factors. Antioxidants and Redox Signaling. 2011;15(8):2335–2381. doi: 10.1089/ars.2010.3534. 21194351 [DOI] [PMC free article] [PubMed] [Google Scholar]
- 30.Gerdes S., Shakery K., Mrowietz U. Dimethylfumarate inhibits nuclear binding of nuclear factor kappaB but not of nuclear factor of activated T cells and CCAAT/enhancer binding protein beta in activated human T cells. British Journal of Dermatology. 2007;156(5):838–842. doi: 10.1111/j.1365-2133.2007.07779.x. 17381463 [DOI] [PubMed] [Google Scholar]
- 31.Marino G. Dimethylα-ketoglutarate inhibits maladaptive autophagy in pressure overload-induced cardiomyopathy. Autophagy. 2014;10(5):930–932. doi: 10.4161/auto.28235. [DOI] [PMC free article] [PubMed] [Google Scholar]
- 32.Zhang T.M., Sener A., Malaisse W.J. Metabolic effects and fate of succinic acid methyl esters in rat hepatocytes. Archives of Biochemistry and Biophysics. 1994;314(1):186–192. doi: 10.1006/abbi.1994.1428. 7944393 [DOI] [PubMed] [Google Scholar]
- 33.Chouchani E.T. Ischaemic accumulation of succinate controls reperfusion injury through mitochondrial ROS. Nature. 2014;515(7527):431–435. doi: 10.1038/nature13909. 25383517 [DOI] [PMC free article] [PubMed] [Google Scholar]
- 34.Choi I.-Y. Lower levels of glutathione in the brains of secondary progressive multiple sclerosis patients measured by 1H magnetic resonance chemical shift imaging at 3T. Multiple Sclerosis. 2011;17(3):289–296. doi: 10.1177/1352458510384010. 20921235 [DOI] [PMC free article] [PubMed] [Google Scholar]
- 35.Srinivasan R. MR spectroscopic imaging of glutathione in the white and gray matter at 7 T with an application to multiple sclerosis. Magnetic Resonance Imaging. 2010;28(2):163–170. doi: 10.1016/j.mri.2009.06.008. 19695821 [DOI] [PubMed] [Google Scholar]
- 36.Albrecht P. Effects of dimethyl fumarate on neuroprotection and immunomodulation. Journal of Neuroinflammation. 2012;9(1):163. doi: 10.1186/1742-2094-9-163. [DOI] [PMC free article] [PubMed] [Google Scholar]
- 37.Brennan M.S. Dimethyl fumarate and monoethyl fumarate exhibit differential effects on KEAP1, NRF2 activation, and glutathione depletion in vitro. PLoS One. 2015;10(3) doi: 10.1371/journal.pone.0120254. 25793262 [DOI] [PMC free article] [PubMed] [Google Scholar]
- 38.Arockia Rani P.J., Panneerselvam C. Carnitine as a free radical scavenger in aging. Experimental Gerontology. 2001;36(10):1713–1726. doi: 10.1016/s0531-5565(01)00116-4. 11672991 [DOI] [PubMed] [Google Scholar]
- 39.Vamos E. Neuroprotective effects of l-carnitine in a transgenic animal model of Huntington's disease. Biomedicine and Pharmacotherapy. 2010;64(4):282–286. doi: 10.1016/j.biopha.2009.06.020. 19932584 [DOI] [PubMed] [Google Scholar]
- 40.May J.M. Vitamin C transport and its role in the central nervous system. Subcellular Biochemistry. 2012;56:85–103. doi: 10.1007/978-94-007-2199-9_6. 22116696 [DOI] [PMC free article] [PubMed] [Google Scholar]
- 41.Gess B. Sodium-dependent vitamin C transporter 2 deficiency causes hypomyelination and extracellular matrix defects in the peripheral nervous system. Journal of Neuroscience. 2011;31(47):17180–17192. doi: 10.1523/JNEUROSCI.3457-11.2011. 22114285 [DOI] [PMC free article] [PubMed] [Google Scholar]
- 42.Buettner G.R. The pecking order of free radicals and antioxidants: lipid peroxidation, alpha-tocopherol, and ascorbate. Archives of Biochemistry and Biophysics. 1993;300(2):535–543. doi: 10.1006/abbi.1993.1074. 8434935 [DOI] [PubMed] [Google Scholar]
- 43.Jing X. Dimethyl fumarate attenuates 6−OHDA-induced neurotoxicity in SH-SY5Y cells and in animal model of Parkinson’s disease by enhancing Nrf2 activity. Neuroscience. 2015;286:131–140. doi: 10.1016/j.neuroscience.2014.11.047. 25449120 [DOI] [PubMed] [Google Scholar]
- 44.Thiessen A., Schmidt M.M., Dringen R. Fumaric acid dialkyl esters deprive cultured rat oligodendroglial cells of glutathione and upregulate the expression of heme oxygenase 1. Neuroscience Letters. 2010;475(1):56–60. doi: 10.1016/j.neulet.2010.03.048. 20347008 [DOI] [PubMed] [Google Scholar]
- 45.Barateiro A., Fernandes A. Temporal oligodendrocyte lineage progression: in vitro models of proliferation, differentiation and myelination. Biochimica et Biophysica Acta. 2014;1843(9):1917–1929. doi: 10.1016/j.bbamcr.2014.04.018. 24768715 [DOI] [PubMed] [Google Scholar]
- 46.Wood T.L. mTOR: a link from the extracellular milieu to transcriptional regulation of oligodendrocyte development. ASN NEURO. 2013;5(1):e00108. doi: 10.1042/AN20120092. 23421405 [DOI] [PMC free article] [PubMed] [Google Scholar]
- 47.Lee Y. Oligodendroglia metabolically support axons and contribute to neurodegeneration. Nature. 2012;487(7408):443–448. doi: 10.1038/nature11314. 22801498 [DOI] [PMC free article] [PubMed] [Google Scholar]
- 48.Budin I., Devaraj N.K. Membrane assembly driven by a biomimetic coupling reaction. Journal of American Chemical Society. 2012;134(2):751–753. doi: 10.1021/ja2076873. 22239722 [DOI] [PMC free article] [PubMed] [Google Scholar]
- 49.Paz Soldán M.M., Pirko I. Biogenesis and significance of central nervous system myelin. Seminars in Neurology. 2012;32(1):9–14. doi: 10.1055/s-0032-1306381. 22422202 [DOI] [PubMed] [Google Scholar]
- 50.Baumann N., Pham-Dinh D. Biology of oligodendrocyte and myelin in the mammalian central nervous system. Physiological Reviews. 2001;81(2):871–927. doi: 10.1152/physrev.2001.81.2.871. 11274346 [DOI] [PubMed] [Google Scholar]
- 51.Hayes J.D., Dinkova-Kostova A.T. The Nrf2 regulatory network provides an interface between redox and intermediary metabolism. Trends in Biochemical Sciences. 2014;39(4):199–218. doi: 10.1016/j.tibs.2014.02.002. 24647116 [DOI] [PubMed] [Google Scholar]
- 52.Linker R.A. Fumaric acid esters exert neuroprotective effects in neuroinflammation via activation of the Nrf2 antioxidant pathway. Brain. 2011;134(3):678–692. doi: 10.1093/brain/awq386. 21354971 [DOI] [PubMed] [Google Scholar]
Associated Data
This section collects any data citations, data availability statements, or supplementary materials included in this article.
Supplementary Materials
Supplementary Material