Abstract
Understanding the normal aging process will help us determine the mechanisms of how age-related diseases are caused and progress. A/J inbred mice have been shown to exhibit accelerated aging phenotypes in the retina including increased inflammation and photoreceptor cell degeneration, which resemble human aging symptoms. C57BL/6J (B6) inbred mice are less susceptible for these abnormalities, indicating the existence of genetic factor(s) that affect their severity. In this study, we determined that another age-dependent phenotype, ectopic synapse formation, is also accelerated in the A/J retina compared to the B6 retina. Through genetic mapping utilizing recombinant inbred strains, we identified quantitative trait loci (QTLs) on chromosome 7 and 19 that contribute to abnormal retinal synapses as well as other age-dependent phenotypes. Using consomic single chromosome substitution lines where a single chromosome is from A/J and the rest of the genome is B6, we investigated the individual effect of each QTL on retinal aging phenotypes. We observed that both QTLs independently contribute to abnormal retinal synapses, reduction in the number of cone cells, and an up-regulation of retinal stress marker, glial fibrillary acidic protein (GFAP). Mice with a single chromosome substitution on chromosome 19 also exhibited an increase in inflammatory cells, which is characteristic of aging and age-related macular degeneration. Thus, we identified QTLs that are independently capable of affecting the severity and progression of age-dependent retinal abnormalities in mice.
Introduction
Since neurons are long-living and non-dividing, they are particularly susceptible to accumulating oxidative damage and exhibit significant age-related changes (Medzhitov et al. 2012, Mustafi et al. 2012). Involvement of oxidative damage is also implicated for age-dependent neurodegenerative diseases such as Alzheimer’s disease, Parkinson’s disease and Huntington’s disease (Lin and Beal, 2006, Milnerwood and Raymond, 2010). Based on these notions, it is plausible that age-dependent diseases may manifest themselves in an age-dependent manner through a tight interaction between the disease-causing mechanisms and cellular changes that occur in the aging process. Therefore, in order to understand how age-dependent diseases are caused, it is important to study how the aging process is regulated at the molecular level. The retina offers an excellent model to quantitatively study age-dependent changes in the neuronal tissue due to its well-organized layered structure. Recent studies in mice and humans have shown that a normally aging retina goes through pathological changes including the formation of ectopic photoreceptor synapses, increased inflammation, and gradual photoreceptor cell degeneration (Aggarwal et al. 2007, Eliasieh et al. 2007, Fuchs et al. 2012, Samuel et al. 2011, Terzibasi et al. 2009). Similar retinal abnormalities have been observed in retinal degenerative diseases such as age-related macular degeneration (AMD) (Aggarwal et al. 2007, Eliasieh et al. 2007, Sullivan et al. 2007), suggesting a link between the molecular mechanisms of retinal aging and age-dependent retinal diseases. Elucidating the molecular mechanisms causing these age-dependent retinal abnormalities will enhance our understanding of the molecular and cellular changes underlying aging and age-dependent diseases in the retina.
In this study, we utilized two inbred mouse lines that show differences in the rate of retinal aging in order to gain entrypoints into the molecular mechanisms of the retinal aging process. It has been shown that an inbred strain, A/J, is susceptible to age dependent retinal abnormalities such as photoreceptor cell degeneration and increased inflammation, while another inbred strain, C57BL/6J (B6), is relatively less susceptible (Mustafi et al. 2012). These observations indicate the existence of genetic factor(s) affecting the age-dependent retinal phenotypes. We found that another age-dependent retinal phenotype, ectopic synapse formation (Liets et al. 2006, Terzibasi et al. 2009), is also more severe in the A/J retina compare to the B6 retina. The time-course study also showed that this age-dependent abnormality can be clearly detected and quantified relatively early in the course of aging. Using recombinant inbred strains, a mouse genetics resource that is available between A/J and B6 strains (Bailey 1971, Taylor 1978, Danciger et al. 2007), we identified chromosomal loci significantly affecting the severity of age dependent synaptic abnormalities. Further characterization of B6 mice with A/J single chromosome substitutions indicated that these loci are independently sufficient to affect the severity of the age-dependent synaptic abnormality, and also affect other age-dependent phenotypes in the retina.
Materials and Methods
Mouse Husbandry
All mouse procedures were performed in accordance with the Association for Vision and Ophthalmology’s guidelines for the use of animals in ophthalmic research. B6, A/J and B6(Cg)-Tyrc-2J/J (B6 albino) mice were obtained from the Jackson Laboratory (Bar Harbor, ME). Consomic lines C57BL/6J-Chr7A/NaJ (Con7) and C57BL/6J-Chr19A/NaJ (Con19) were generated as described by Nadeau et al. (2000) and obtained from the Jackson Laboratory. Recombinant inbred strains (A×B and B×A recombinant inbred panels) used for QTL mapping were also obtained from the Jackson Laboratory (Bailey 1971, Taylor 1978).
Histological analysis
Following asphyxiation by CO2 administration, eyes were immediately removed and immersion fixed in Bouin’s fixative overnight at 4°C. Eyes were then rinsed, dehydrated, and embedded in paraffin. Paraffin blocks were sectioned 6 μm thick on an RM 2135 microtome (Leica Microsystems, Wetzlar, Germany) and mounted on glass slides. The slides were then stained with hematoxylin and eosin (H&E) to visualize the retinal structure. H&E-stained sections were imaged on an Eclipse E600 microscope (Nikon, Tokyo), using a SPOT camera (Spot Diagnostics, Sterling Heights, MI). Outer nuclear thickness (ONLT) index was calculated as the ONL normalized to the inner nuclear layer (INL) thickness.
Immunohistochemistry
Eyes were fixed in 4% paraformaldehyde for two hours at 4°C, then cryoprotected at 4°C in a graded series of sucrose. Eyes were embedded in optimal cutting temperature compound (OCT) (Sakura Finetek), sectioned at 12μm on a cryostat, mounted onto Super-Frost glass slides, air-dried, and stored at −80°C until used. For immunohistochemistry on cryostat sections, slides were brought to room temperature and incubated in a blocking solution [PBS with 0.5% Triton X-100 and 2% normal donkey serum] for 20 minutes. The block was replaced and sections were incubated overnight with the primary antibody against protein kinase c alpha (PKCα, Sigma-Aldrich), postsynaptic density protein 95 (PSD95, NeuroMab), ionized calcium-binding adapter molecule 1 (Iba1, Wako) and glial fibrillary acidic protein (GFAP, Thermo Scientific). Sections were rinsed in PBS, and incubated with a 1:200 diluted peanut agglutinin lectin (PNA, Life Technologies), Alexa 488 conjugated secondary antibody (Invitrogen) and/or Cy3 conjugated secondary antibody (Jackson Immunoresearch) for 45 minutes at room temperature. All sections were imaged on an Eclipse E600 microscope (Nikon) using a SPOT camera (Spot Diagnostics) and Zeiss 510 confocal laser scanning system using LSM 510 software (release 4.2) (Carl Zeiss MicroImaging, Inc).
Quantification of ectopic dendrites and GFAP fluorescence signal
Frequencies of ectopically localized bipolar cell dendrites extending into the ONL were quantified in sections immunostained with the PKCα antibody, using the Measure and Label function of ImageJ software (available at http://rsb.info.nih.gov/ij; developed by Wayne Rasband, National Institutes of Health). Total retina length was measured along the outer plexiform layer (OPL), using the Measure function of ImageJ software. Frequency was calculated as the number of ectopic bipolar cell dendrites per micrometer of retina length for B6, A/J, Con7 and Con19 mice at 2 months, 8 months, and 17 months of age. Ectopic synapse frequency of A/J and B6 mice over a time course was compared by two-way analysis of variance (ANOVA) with bonferroni correction using GraphPad Prism software (GraphPad Software, Inc., San Diego, CA). Comparisons between all four strains were done by a one-way ANOVA performed using the GraphPad Prism software. The percentage of GFAP labeled area in B6, A/J, Con7 and Con19 mice was quantified as previously described (Johnson et al. 2010).
Quantification of microglia
Microglia were quantified in sections immunostained with the Iba1 antibody using the Cell Counter and Measure and Label functions of ImageJ software. We counted the number of resting, transitioning, and activated microglia based on morphology as described by Jonas et al. (2012). Resting microglia were defined as cells with a small soma and ramified processes. Additionally resting cells exhibited no directionality of the processes. Transitioning microglia were characterized as having a slightly enlarged soma size and ramified processes that were thickened in a particular direction. Activated microglia were defined as cells with a large soma size and no extending processes. Microglia were counted over the entire retina independently by two individuals. Counts were averaged, and the frequency of microglia was calculated as the total number of microglia per 100um of retina length. Statistical comparisons were performed by one-way ANOVA using the GraphPad Prism software.
QTL and statistical analysis
We performed QTL mapping with 26 recombinant inbred A×B and B×A lines, using three mice per line. When mice reached 7–8 months of age the severity of the ectopic synapse phenotype was scored in a semiquantitative fashion by three independent individuals. Scores ranged from 1 to 3 (from mild ectopic localization to severe, respectively). Genotype data containing a total of 2445 DNA markers polymorphic between the parental A/J and C57BL/6J strains were obtained from GeneNetwork (http://www.genenetwork.org/genotypes/AXBXA.geno). QTL analysis to identify chromosomal loci affecting the severity of ectopic synapses was performed using the R/qtl package (http://www.rqtl.org/) (Arends et al. 2010). We calculated LOD scores using the multiple-imputation method with 1-cM steps, 1000 joint genotype distribution imputations, and an assumed genotyping error rate of 0.01 (Sen and Churchill 2001). A permutation test with 1,000 replications was used to determine the significance of the results. Statistical analyses of the frequency of ectopic synapses, intensity of GFAP, ONLT, number of cone cells, and density of microglia were performed using GraphPad Prism software (GraphPad Software, Inc., San Diego, CA).
Results
In order to observe age-dependent synaptic changes as well as other age-dependent abnormalities in the retina in different strains of mice, we examined the retina of A/J and B6 mice at 2, 8 and 17–20 months of age. Immunohistochemical analysis demonstrated that ectopic localization of photoreceptor synapses occur in an age-dependent manner (Fig. 1). At 2 months of age, presynaptic photoreceptor terminals (PSD95, green) line up in the OPL in close opposition to the bipolar cell postsynaptic structures (PKC, red) in both the periphery and center of the A/J and B6 retina (Fig. 1A, B). At 17–20 months of age, we observed ectopic localization of presynaptic terminals and abnormal extension of bipolar cell dendrites into the ONL in the periphery and center of the A/J and B6 retina albeit at different frequencies (Fig. 1A, B). Quantification of ectopic synapses at 2, 8 and 17–20 months of age indicated that a significantly increased number of ectopic synapses are observed in the peripheral A/J retina by 8 months of age, and in the central retina by 17–20 months of age (Fig. 1C, D). The number of ectopic synapses in the peripheral retina at 8 months of age is significantly greater in A/J mice compared to B6 mice (Fig. 1C, D), indicating that progression of this phenotype is significantly faster in the A/J retina. In the central retina of A/J mice, we observed much greater number of ectopic synapses compared to B6 mice at 17–20 months of age (Fig. 1C, D). We also observed age-dependent GFAP up-regulation in the A/J retina (Fig. 2A), which is considered the sign of stress in the retina (Lewis and Fisher, 2003). The level of GFAP was greater in the peripheral and central A/J retina compared to the B6 control retina at 8 and 17–20 months of age (Fig. 2A, B). These age-dependent phenomena are all initially observed in the peripheral retina, and later observed in the central retina.
Fig. 1.
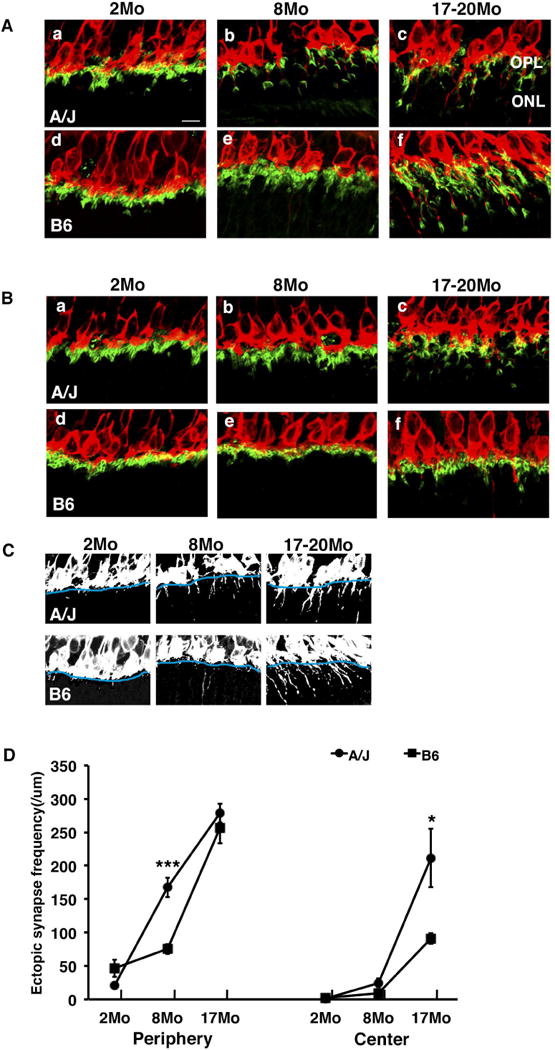
Ectopic synapse localization in A/J and B6 mice. (A) In the peripheral retina, PKCα-labeled (red) bipolar cell dendrites and PSD95-labeled (green) photoreceptor synaptic terminals are localized in the OPL in B6 mice at 2 and 8 months of age (d, e) and in A/J mice at 2 months of age (a). They are ectopically localized in the ONL in A/J mice at 8 and 17–20 months (c) and in B6 mice at 17–20 months of age (f). (B) In the central retina, the synaptic terminals are localized to the OPL in B6 mice at 2 and 8 months of age (d, e). At 17–20 months of age B6 mice exhibit some ectopically localized synapses (f), but it is significantly less than A/J mice. A/J mice exhibit normal localization in OPL at 2 and 8 months (a, b) but ectopically localized synapses in ONL at 17–20 months (c). (C) Black and white images of a–f in figure 1A demonstrate the method used for quantification of ectopic synapses. The OPL boundary is identified in blue, and the number of synapses extending past the boundary was counted. (D) A/J mice exhibit a significant increase in ectopically localized synapses in the peripheral retina at 8 months of age compared to B6 mice (left). At 17–20 months, A/J mice exhibit a significant increase in ectopic synapses in the central retina compared to B6 mice (right). Error bars represent standard errors. Asterisks denote statistical significance (*P < 0.05, **P < 0.01, ***P < 0.001). OPL, outer plexiform layer; ONL, outer nuclear layer; scale bar, 10 um.
Fig. 2.
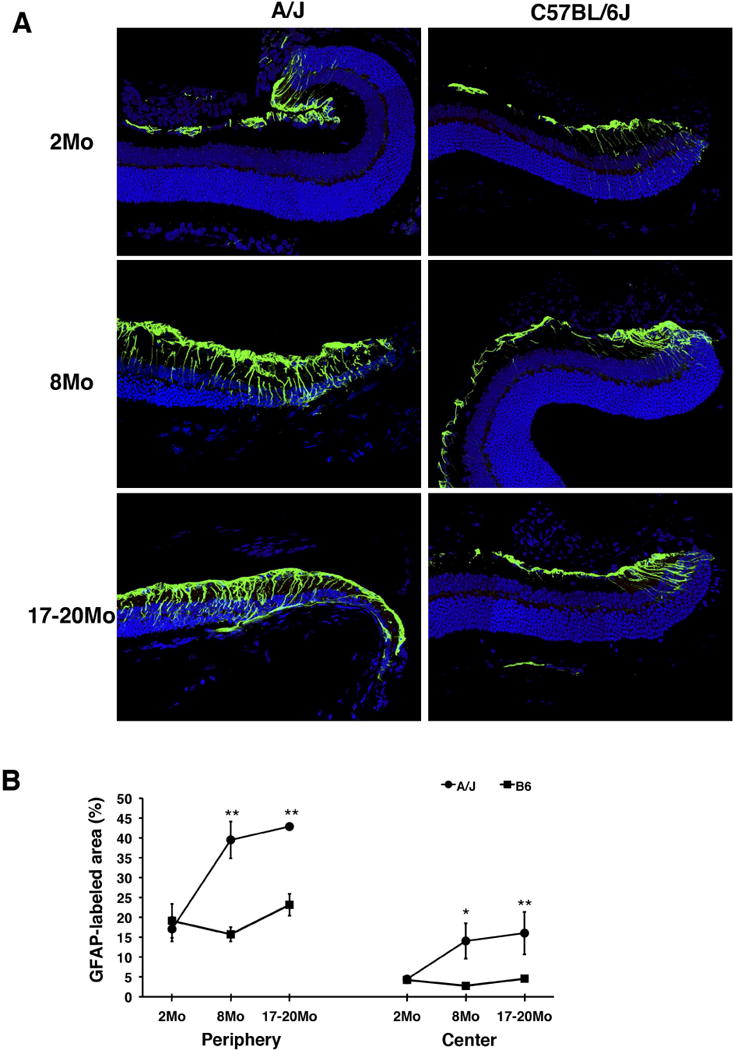
Retinal stress marker in A/J and B6 mice. (A) In the peripheral B6 retina, GFAP (green), a marker of retinal stress, exhibits staining that is consistent at all timepoints examined (right). In A/J mice, GFAP staining becomes higher in intensity and extends further towards the center of the retina as mice age (left). (B) In both the peripheral (left) and central (right) retina, the percentage of GFAP-labeled area of the retina is significantly higher in A/J mice compared to age matched B6 mice at 8 and 17–20 months. Asterisks denote statistical significance (*P < 0.05, **P < 0.01, ***P < 0.001).
Since A/J mice are albino (non-pigmented), we also considered the possibility that the phenotypic differences between B6 and A/J retinas is due to difference in the pigmentation of the eye possibly leading to difference in the light sensitivity. We compared the age-dependent retinal phenotypes between 20 month old B6 and B6 albino mice and found no significant difference in ectopic synapse formation (Fig. 3C, D) and photoreceptor cell loss (Fig. 3A, B) between these strains, indicating that pigmentation is not associated with the severity of these age-dependent retinal phenotypes (Fig. 3A–D).
Fig. 3.
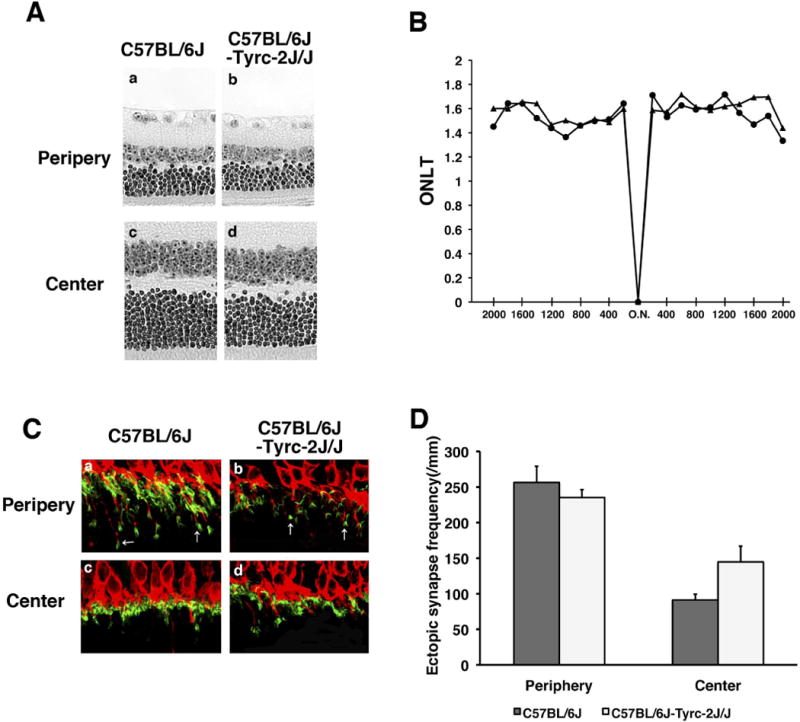
Aging phenotypes in B6 albino mice. (A) H&E-stained retinal sections from B6 and B6-Tyrc-2J/J (B6 albino) mice. (B) The ONLT of B6 and B6 albino mice at 17–20 months of age are not significantly different. (C) PKCα-labeled (red) bipolar cell dendrites and PSD95-labeled (green) photoreceptor synaptic terminals are localized in the OPL in the central retina of B6 and B6 albino mice (bottom), and exhibit similar ectopic localization (arrows) in the peripheral retina (top). (D) There is no significant difference in the frequency of ectopic synapses in B6 and B6 albino mice.
In order to determine the genetic basis of the difference in age-dependent synaptic phenotypes between B6 and A/J mice, we genetically mapped loci effecting age-related synaptic abnormalities using 26 recombinant inbred strains (A×B and B×A) that carry a unique mosaic of homozygous B6 and A/J chromosomal segments (Bailey 1971, Taylor 1978). We examined the severity of the ectopic synapse phenotype in the peripheral retina of these A×B and B×A lines at 7 months of age in a semiquantitative fashion and observed phenotypic variations (Fig. 4A). Combining the genotype data available for these recombinant inbred strains and our phenotypic data, we mapped the chromosomal loci affecting the severity of ectopic synapses to Chromosome 7 (LOD = 4.86, p < 0.05) and Chromosome 19 (LOD = 6.53, p < 0.01) using the R/qtl statistical package (http://www.rqtl.org/)(Fig. 4C). The genetic region identified on chromosome 7 is flanked by rs3675028 (74.6Mbp) and rs3711806 (96.6Mbp), while the region on chromosome 19 is flanked by D19Mit127 (12.4Mbp) and D19Mit40 (25.4Mbp) (Fig 4C). The QTLs were named retinal aging 1 (rta1) and rta2 respectively.
Fig. 4.
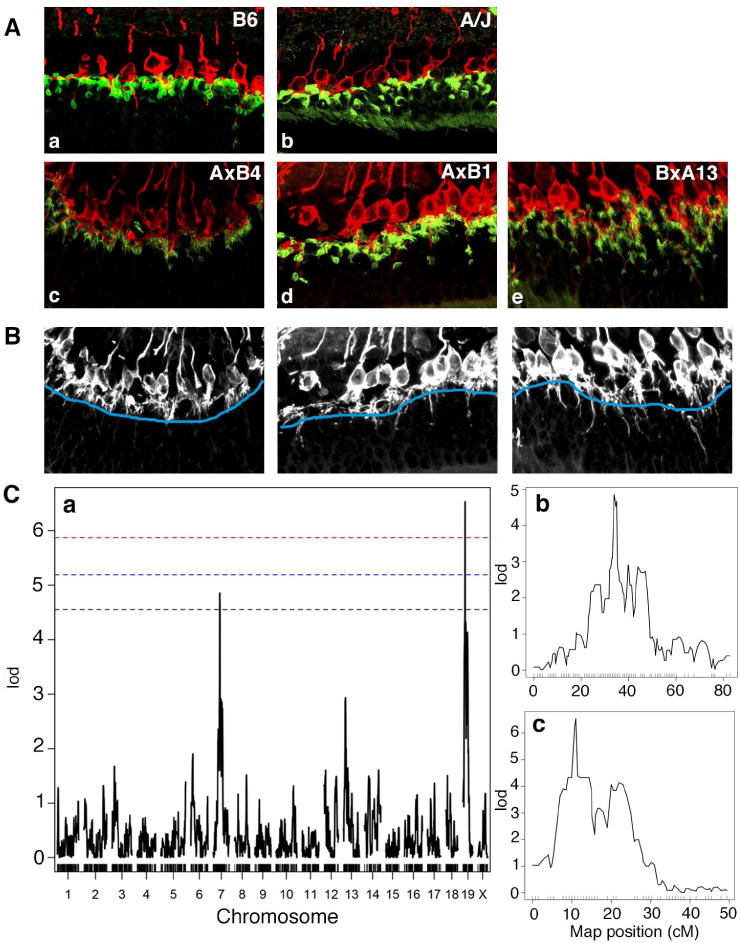
Identification of the rta1 and rta2 loci. (A) Recombinant inbred A×B and B×A lines exhibited phenotypic variation in the localization of ectopic photoreceptor synapses. Recombinant inbred mice were scored on a scale of 1–3 with 1 being the mildest (c), 2 being slightly more affected (d) and 3 being severely affected (e). (B) Black and white images of c–e demonstrate the method used for quantification of ectopic synapses. The OPL boundary is identified in blue, and the number of synapses extending past the boundary indicates the severity of the phenotype. (C) Whole genome scan LOD score distribution for association of ectopically localized synapses in 78 recombinant inbred A×B and B×A mice (a). Two QTLs were identified, one on chromosome 7 (rta1, b), and one on chromosome 19 (rta2, c). P=0.05 (black), P=0.02 (blue), P=0.01 (red).
The use of B6 mice with single chromosomes (chromosome 7 or 19) substituted from A/J allowed us to test the independent effect of each QTL on age dependent synaptic phenotypes (Nadeau et al. 2000, Singer et al. 2004, Xiao et al. 2010). Immunohistochemical analysis demonstrates that both the Con7 and Con19 lines exhibit a significant increase in ectopic localization of retinal photoreceptor cell synapses in the periphery of the retina at 8 months of age, characteristic of an A/J-like phenotype (Fig. 5A, B). By 17 months of age, ectopic synapses were also increased in the central retina of Con7 and Con19 mice consistent with what is observed in the A/J retina (Fig. 5B). We also examined other retinal phenotypes in the consomic lines in order to determine whether rat1 and rta2 could have independent effects on other retinal-abnormalities. Neither consomic line exhibited a significant decrease in ONLT index at 8 or 17 months and followed a pattern of ONLT similar to B6 (Fig. 5E). The level of retinal stress marker, GFAP, was elevated in both consomic lines (Fig. 5C) compared to the B6 retina at 8 months of age. We also stained the retina of Con7 and Con19 mice with PNA to examine cone cells (Fig. 6A), which were previously shown to be decreased in aging A/J retina compared to age-matched B6 retina (Mustafi 2012). The number of cone cells in the Con7 and Con19 lines was significantly decreased compared to B6 (Fig. 6B; a vs c), although this phenotype was still significantly more severe in A/J mice compared to Con7 and Con19 mice (Fig. 6B; b vs c). A previous study has demonstrated an increase of inflammation and microglia in A/J mice compared to B6 (Mustafi 2012), which we have confirmed (Fig 6C, D). We observed a significant increase in total number of microglia in 8 month A/J, as well as a significant increase in activated microglia in 8 month A/J and Con19 mice compared to B6 controls (Fig 6C). Con7 mice exhibited a significantly lower frequency of total microglia and activated microglia compared to A/J mice (Fig 6C, D), which is similar to B6 mice.
Fig. 5.
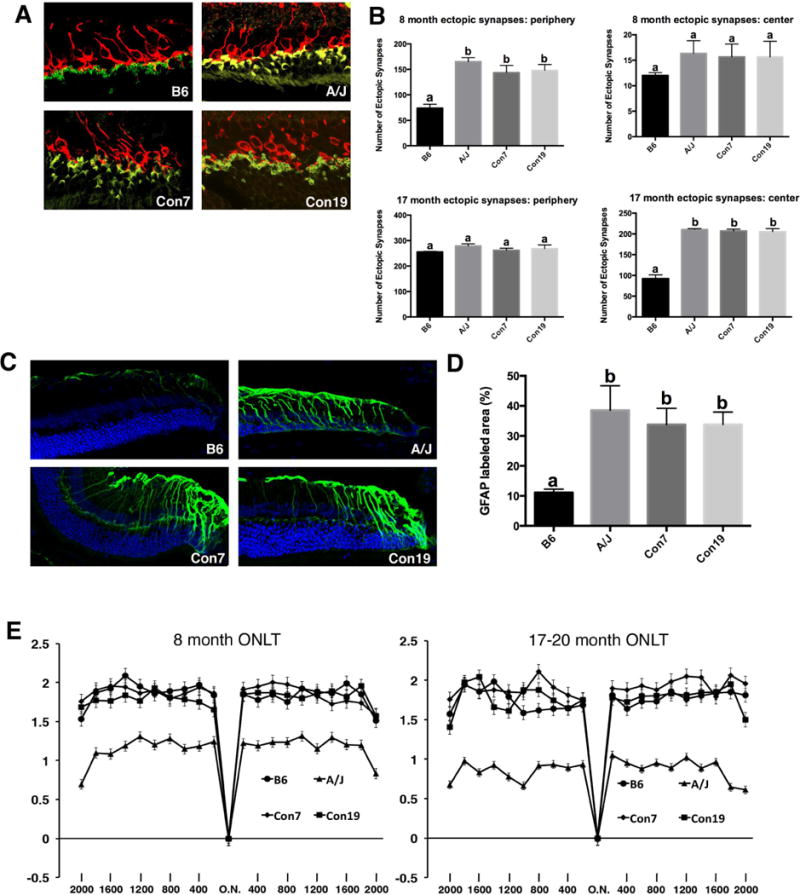
Phenotypes of consomic mice. (A, B) B6 mice with single A/J chromosome substitutions at chromosome 7 (Con7) and 19 (Con19) exhibit a significant increase in ectopically localized synapses in the peripheral retina at 8 months of age, and in the central retina at 17–20 months of age compared to B6 controls. Values in graphs with different superscripts (a, b) differ with statistical significance (p<0.05). (C, D) Con7, Con19, and A/J mice exhibit significantly increased GFAP staining in the peripheral retina compared to B6 controls. Values in graphs with different superscripts (a, b) differ with statistical significance (p<0.05). (E) A/J mice show a significant decrease in ONLT at 8 and 17 months compared to B6, Con7, and Con19 mice (n=6 for all genotypes, p<.05 for all data points). Con7 and Con19 mice exhibit no decrease in ONLT compared to B6 mice at 8 and 17–20 months of age. Scale bar, 10um
Fig. 6.
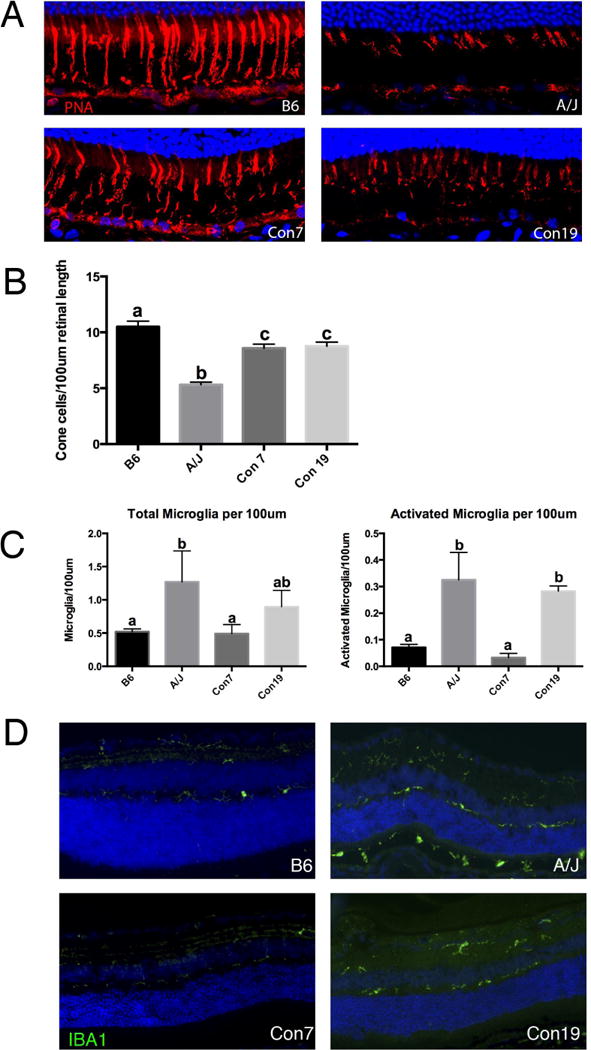
rta1 and rta2 can independently affect retinal phenotypes. (A) Staining for PNA showing cone photoreceptor cells in the retina of B6, A/J, Con7 and Con19 mice at 8 months of age. (B) Con7, Con19 and A/J mice have a significant decrease in cone density compared to B6 control mice at 8 months of age. Values with different superscripts (a, b, c) differ with statistical significance (p<0.05). (C) A/J mice exhibit an increase in the total number of microglia compared to B6 and Con7 mice (left). Although Con19 mice also showed an increase in the total number of microglia, the difference did not reach statistical significance (a vs ab; b vs ab). Classification of microglia in A/J and Con19 mice revealed a significant increase specifically in activated microglia compared to B6 and Con7 mice (right). Values in graphs with superscripts a and b differ with statistical significance (p<0.05). (D) The increase in microglia in A/J and Con19 mice can be visualized by staining with Iba1, a general microglia marker. Scale bar, 10um
Using the Mouse Genome Informatics (MGI) resource (http://www.informatics.jax.org/), we compared sequence information for the A/J and B6 strains to identify single nucleotide differences between the two lines within the regions defined by rta1 and rta2. We also narrowed our candidate gene list by choosing genes expressed in the eye based on the gene expression data in MGI. Within the regions of rta1 and rta2, there are several genes with single nucleotide polymorphisms (SNPs) that are predicted to result in coding sequence changes. We focused on these non-synonymous SNPs because they have the potential to change the structure or function of the resulting protein. We particularly focused on non-synonymous SNPs that cause a change in the nature of the amino acid, such as polarity or acidity, since that could impact protein folding. Candidate genes selected using these criteria are listed in Table 1. Using previously published RNA-seq data (Mustafi et al. 2012), we also considered select genes in the rta1 and rta2 regions that are known to have slight expression differences in B6 and A/J eye tissue (Mustafi et al., 2012). Candidate genes selected using these criteria are listed in Table 2. For one of the rta1 candidates, Bloom syndrome (Blm) (Table 1), we performed a further analysis to examine the localization and expression of its protein product. Immunohistochemical analysis of retinal sections with anti BLM revealed signals mainly in the retinal pigment epithelium (RPE) cells, which were higher in A/J mice compared to B6 mice (Fig 7). BLM localization was constrained primarily to the nucleus of RPE cells in B6 samples, while it was observed throughout the RPE in A/J samples (Fig. 7). The Con7 retina showed a high level of BLM signals diffused in the RPE similar to the A/J retina, while the staining pattern in the Con19 retina appeared similar to that in the B6 retina (Fig 7).
Table 1.
SNPs resulting in an amino acid change that affects the nature of the amino acid are displayed in Table 1.
| Gene | Map Position (NCBI Build 37) | C57BL/6J | A/J | Amino Acid Change |
|---|---|---|---|---|
| Akap13 | Chr7:82754445 | A | G | G-S |
| Akap13 | Chr7:82756152 | T | C | P-S |
| Agbl1 | Chr7:83564952 | A | G | D-N |
| Agbl1 | Chr7:83567067 | G | T | M-R |
| Hapln3 | Chr7:86268289 | G | T | S-R |
| Hapln3 | Chr7:86268294 | C | T | D-G |
| Fanci | Chr7:86580162 | G | A | T-A |
| Ticrr | Chr7:86829114 | A | C | Q-K |
| Ticrr | Chr7:86839541 | A | G | G-R |
| Ticrr | Chr7:86839563 | A | G | G-D |
| Ticrr | Chr7:86839889 | G | A | S-G |
| Rccd1 | Chr7:87464151 | C | G | N-K |
| Unc45a | Chr7:87470925 | T | C | A-T |
| Blm | Chr7:87647439 | C | T | W-R |
| Bnc1 | Chr7:89118221 | G | A | C-R |
| Vmn2r74 | Chr7:93104631 | G | T | K-Q |
| Vmn2r74 | Chr7:93105975 | C | A | T-A |
| Gm3916 | Chr19:27336746 | C | T | K-E |
| Rps15a-ps2 | Chr19:28816753 | G | A | W-R |
| Kif20b | Chr19:35024279 | G | A | E-G |
| Exoc6 | Chr19:37714253 | C | T | C-R |
| Myof | Chr19:38072776 | A | G | T-I |
| Cep55 | Chr19:38132454 | G | A | D-G |
| Cyp2c68 | Chr19:39786962 | T | G | P-T |
| Cyp2c68 | Chr19:39808779 | G | A | C-R |
| Cyp2c68 | Chr19:40164755 | G | T | S-R |
| Gm16470 | Chr19:40269292 | G | T | S-A |
| Sorbs1 | Chr19:40439534 | T | C | A-T |
| Tctn3 | Chr19:40683729 | A | G | T-M |
| Dntt | Chr19:41104005 | C | T | M-T |
| Gm9788 | Chr19:41534993 | C | T | C-R |
| Rrp12 | Chr19:41951649 | T | C | G-S |
| Nkx2–3 | Chr19:43689491 | T | G | A-S |
| Abcc2 | Chr19:43872915 | A | G | A-T |
| Abcc2 | Chr19:43875205 | A | C | P-T |
| Abcc2 | Chr19:43878139 | A | C | A-S |
| Abcc2 | Chr19:43886949 | A | G | R-Q |
| Dnmbp | Chr19:43924369 | T | C | R-Q |
| Cwf19l1 | Chr19:44205943 | G | A | D-G |
| Lzts2 | Chr19:45096109 | C | G | R-P |
Table 2.
Selected genes exhibiting an expression difference between A/J and B6 eye tissue are displayed in table 2.
| Gene | Map Position (NCBI Build 38) | A/J Expression vs B6 | AJ Vs. Bl6 (ratio) |
|---|---|---|---|
| Sv2b | 7(75114897) | A/J down | 0.996968 |
| Anpep | 7(79821803) | A/J down | 0.58027 |
| Mex3b | 7(82867333) | A/J down | 0.539379 |
| Pcf11 | 7(92643712) | A/J up | 1.06014 |
| Cep78 | 19(15955774) | A/J up | 2.21996 |
| Trpm3 | 19(22139119) | A/J down | 0.963936 |
| Fam189a2 | 19(23972751) | A/J down | 0.713437 |
| Tjp2 | 19(24094523) | A/J up | 1.00564 |
| Pgm5 | 19(24683016) | A/J up | 2.04535 |
| Dock8 | 19(24999529) | A/J up | 1.90567 |
Fig. 7.
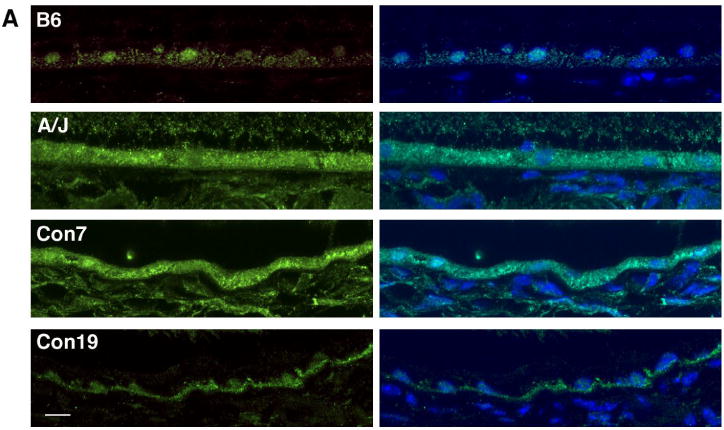
BLM localization patterns in the retinal pigment epithelium. BLM (green) and DAPI (blue) staining in the RPE of B6, A/J, Con7 and Con19 mice at 8 months of age shows nuclear staining in B6 and Con19 samples, and more diffuse staining in A/J and Con7 mice. Scale bar, 10um
Discussion
The effects of genetic background on age-dependent retinal synaptic abnormalities
Through a time-course study, we have determined the progression of age-dependent synaptic changes in the mouse retina, and revealed that the severity of these age-dependent changes differs between two inbred strains of mice, B6 and A/J. A/J mice have an increased frequency of ectopically localized photoreceptor synapses in the peripheral retina beginning at 8 months of age. This phenotype later progresses into the center of the retina. While B6 mice exhibit a phenotype that follows a similar trend, it occurs at much later time point than in A/J mice. Both A/J and B6 mice exhibit increased GFAP staining in the peripheral retina that later occurs in the center of the retina as well. However, A/J mice have a significantly higher amount of GFAP signal at early time points. This indicates that perhaps the B6 strain has protective factors to ameliorate retinal stress, or that the A/J strain has factors that enhance stress response. Using recombinant inbred strains (A×B and B×A), we have identified two major loci that affect the severity and frequency of ectopically localized photoreceptor cell synapses. To investigate the independent effects of these loci, we used consomic lines with single chromosome substitutions on chromosomes 7 or 19. These mice displayed ectopically localized synapses in the peripheral retina at 8 months of age, similar to A/J mice. These data suggest that each locus is sufficient to cause age-related changes in the retinal synapses.
Rta1 and Rta2 and their roles in age-related retinal phenotypes
Both the A/J and B6 strains follow a similar spatial and temporal trend in retinal aging, but the progression is faster in the A/J mice. Understanding the mechanisms that influence the onset and progression of retinal aging will help us identify factors involved in age-dependent retinal diseases. In this study, we have taken advantage of the presence of ectopic synapses relatively early in the aging process for genetic mapping of chromosomal regions involved in age-dependent phenotypes. The genes involved in synaptic abnormalities may also affect other age-dependent retinal phenotypes. Indeed, the Con7 and Con19 lines independently exhibit several phenotypes with an accelerated onset (as observed for A/J)—ectopic photoreceptor synapses, up-regulated GFAP, and decreased cone cells–while others, such as photoreceptor cell degeneration, begin at similar time points to the B6 line. Con19 mice also exhibited an increase in total and activated microglia in the retina compared to B6, while Con7 mice did not. Based on recent studies suggesting that inflammation and immune responses are common in aging tissues, we postulate that genes in the rta2 region may affect this mechanism (Glaros et al. 2013, Mustafi et al 2012). Our data indicate that the identified chromosomal loci have independent effects on synaptic function, cone cell integrity, and inflammation.
Retinal degeneration in B6 and A/J mice
It is plausible that the genetic factors involved in age dependent ectopic synapse formation are also involved in photoreceptor cell degeneration not only because phenotypic changes follow a similar gradient from peripheral to central retina, but also based on the fact that we have found other age-dependent retinal abnormalities that are also affected by rta1 and rta2. However, photoreceptor cell degeneration was not affected in Con7 or Con19 mice (Fig 5E). Mustafi et al. also observed no difference in retinal degeneration in any of the consomic lines with single chromosome substitution from A/J onto the B6 background (Mustafi et al. 2012), indicating that multiple chromosomal regions may be contributing to that particular age-dependent phenotype. Thus, it is possible that rta1 and rta2 affect age-dependent photoreceptor cell degeneration through interaction with other chromosomal loci. Future work will be necessary to test this possibility.
Possible candidate genes in the rta1 and rta2 chromosomal regions
We used several criteria for evaluating candidate genes. We selected genes with non-synonymous SNPs, since they are more likely to affect protein folding or function than silent mutations, that are expressed in the eye (Table 1). We also listed select genes in the rta1 and rta2 regions that were previously shown to be differentially expressed in the retina of A/J and B6 mice (Mustafi et al., 2012) (Table 2). We chose to focus on genes involved in either age-related phenotypes, retinal disease, or synaptic and neuronal function. One potential candidate for rta1 with a non-synonymous SNP is Bloom Syndrome (Blm) (Table 1), which encodes for the DNA repair enzyme RecQl3 helicase. Mutations in BLM lead to Bloom Syndrome in humans, symptoms of which include cancer, gastrointestinal tract neoplasias, and other disorders (Arora, 2014). Multiple retinal abnormalities, including drusen formation, have been also reported in individuals with Bloom Syndrome (Bhisitkul and Rizen 2004), suggesting that BLM has functions in the retina and could be associated with age-related retinal symptoms.
Immunohistochemical analysis for BLM indicated a higher signal in A/J mice compared to B6 mice (Fig. 7). The staining in B6 mice was primarily found in the nuclei of RPE cells, while in A/J mice diffuse staining was found throughout the RPE (Fig. 7). This difference in staining pattern indicates a possible regulatory difference in Blm between B6 and A/J mice. Previously published expression data shows a slight increase in Blm expression in A/J mice that does not reach statistical significance (Mustafi et al., 2012). One other candidate for rta1 that contains a non-synonymous SNP is Unc45a (Table 1), which was identified in human GWAS studies of macular degeneration (GWAScentral.org). Unc45a has been shown to play a role in retinoic acid signaling, which makes it an interesting candidate since retinoic acid has been shown to be involved in immune regulation in the retina (Epping 2009, Pino-Lagos et al. 2008). Previously performed expression analysis has shown that the expression of synaptic vesicle glycoprotein 2 b (Sv2b), which maps to the rta1 region (Table 2), is decreased in A/J retina compared to B6 retina (Mustafi et al., 2012). Decreased expression of Sv2b has also been noted in the retinal degeneration 1 (rd1) mouse (Dagar et al., 2014), suggesting its possible involvement in photoreceptor cell maintenance.
On chromosome 19, there are multiple candidates for rta2. Cytochrome P450, family 2, subfamily c, polypeptide 68 (Cyp2c68) is a candidate for rta2 that contains three non-synonymous SNPs (Table 1). Cytochromes P450 (CYPs) are hemoproteins, and are involved in drug metabolism (Goldstein, 2001). Recently, knockdown of Cyp2c isoforms have been shown to protect against light induced cell death in mouse-derived photoreceptor cells (Chang et al., 2014). Chang et al. suggest that Cyp2c knockdown reduced mitochondrial stress-initiated apoptosis in photoreceptor cells (2014). Additionally, Cyp2c family members have been shown to exhibit a decrease in expression over time in B6 mice, with high levels of expression at 2 months of age, and significantly decreased expression levels at 18 and 30 months of age (Kwak et al., 2014). Age related expression changes in Cyp2c family members have not been studied in A/J mice, however the observed temporal expression changes in B6 mice along with it’s involvement in retinal photoreceptor cell degeneration make Cyp2c68 an attractive candidate for rta2. One other possible candidate with a non-synonymous SNP is tectonic family member 3 (Tctn3) (Table 1), which is involved in ciliary function, is associated with Joubert’s Syndrome and Related Disorders (JSRD) in humans (Parisi and Glass, 2003). Characteristics of Joubert’s syndrome include cerebellar and brain stem abnormalities as well as retinal dystrophy, making Tctn3 a potential candidate. Additionally, Transient receptor potential cation channel, subfamily M, member 3 (Trpm3), a cation channel expressed in the retina, exhibits decreased expression in A/J mice compared to B6 (Table 2). TRMP3 mutations have been associated with ocular diseases such as glaucoma in humans (Bennett et al., 2014). Loss of Trpm3 causes an attenuated response to bright light, indicating a functional role for Trmp3 in the mouse retina (Hughes et al., 2012). The role of Trpm3 in photoreceptor cell signaling and the differential expression in A/J and B6 mice makes this gene a potential candidate.
Further work will be necessary to investigate the expression and function of these candidate genes in the retina in order to understand more about the retinal aging process at the molecular level.
Acknowledgments
The authors thank Satoshi Kinoshita for generation of frozen sections, Sharolyn Kawakami-Schulz for assistance with R/qtl, Joel Wipperfurth for assistance in genetic mapping, and the University of Wisconsin-Madison Genetics Confocal Facility for use of the confocal microscope. This work was supported by grants from the National Institutes of Health (NIH R21 EY023061and R01 EY022086), a professorship from the Retina Research Foundation (Walter H. Helmerich Research Chair), Core Grant for Vision Research (P30 EY016665) and a core grant to Waisman Center (NIH P30 HD003352). Support for E.L.M. was partially provided by the NIH predoctoral training program in Genetics (NIH T32 GM007133).
References
- Arora H, Chacon AH, Choundhary S, McLeod MP, Meshkov L, Nouri K, Izakovic J. Bloom syndrome. Int J Dermatol. 2014 doi: 10.1111/ijd.12408. [DOI] [PubMed] [Google Scholar]
- Aggarwal P, Nag TC, Wadhwa S. Age-related decrease in rod bipolar cell density of the human retina: an immunohistochemical study. Journal of Biosciences. 2007;32(2):293–298. doi: 10.1007/s12038-007-0029-9. [DOI] [PubMed] [Google Scholar]
- Arends D, Prins P, Jansen RC, Broman KW. R/QTL: high throughput Multiple QTL Mapping. Bioinformatics. 2010;26(23):2990–2992. doi: 10.1093/bioinformatics/btq565. [DOI] [PMC free article] [PubMed] [Google Scholar]
- Bailey DW. Recombinant-inbred strains. An aid to finding identity, linkage, and function of histocompatibility and other genes. Transplantation. 1971;11(3):325–327. doi: 10.1097/00007890-197103000-00013. [DOI] [PubMed] [Google Scholar]
- Bennet TM, Mackay DS, Siegfried CJ, Shiels A. Mutation of the Melastin-Related Cation Channel, TRPM3, Underlies Inherited Cataract and Glaucoma. PloS One. 2014 doi: 10.1371/j.pone.0104000. [DOI] [PMC free article] [PubMed] [Google Scholar]
- Bhisitkul RB, Rizen M. Bloom syndrome: multiple retinopathies in a chromosome breakage disorder. Br J Ophthalmol. 2004;88(3):354–357. doi: 10.1136/bjo.2002.011643. [DOI] [PMC free article] [PubMed] [Google Scholar]
- Chang Q, Berdyshev E, Cao D, Bogaard JD, White JJ, Chen S, Shah E, Mu W, Grantner R, Bettis S, Grassi MA. Cytochrome P450 2C Epoxygenases Mediate Photochemical Stress-induced Death of Photoreceptors. J Biol Chem. 2014;289:8337–8352. doi: 10.1074/jbc.M113.507152. [DOI] [PMC free article] [PubMed] [Google Scholar]
- Dagar S, Nagar S, Goel M, Cherukuri P, Dhingra NK. Loss of Photoreceptors Results in Upregulation of Synaptic Proteins in Bipolar Cells and Amacrine Cells. PloS One. 2014;4(9):e90250. doi: 10.1371/journal.pone.0090250. [DOI] [PMC free article] [PubMed] [Google Scholar]
- Danciger M, Yang H, Ralston R, Liu Y, Matthes MT, Peirce J, Lavail MM. Quantitative genetics of age-related retinal degeneration: a second F1 intercross between the A/J and C57BL/6 strains. Mol Vis. 2007;13:79–85. [PMC free article] [PubMed] [Google Scholar]
- Eliasieh K, Liets LC, Chalupa LM. Cellular reorganization in the human retina during normal aging. Invest Ophthalmol Vis Sci. 2007;48(6):2824–2830. doi: 10.1167/iovs.06-1228. [DOI] [PubMed] [Google Scholar]
- Epping MT, Meijer LA, Bos JL, Bernards R. UNC45A confers resistance to histone deacetylase inhibitors and retinoic acid. Mol Cancer Res. 2009;11:1861–70. doi: 10.1158/1541-7786.MCR-09-0187. [DOI] [PubMed] [Google Scholar]
- Fuchs M, Scholz M, Sendelbeck A, Atorf J, Schlegel C, Enz R, Brandstätter JH. Rod photoreceptor ribbon synapses in DBA/2J mice show progressive age-related structural changes. PloS One. 2012;7(9):e44645. doi: 10.1371/journal.pone.0044645. [DOI] [PMC free article] [PubMed] [Google Scholar]
- Glaros TG, Chang S, Gilliam EA, Maitra U, Deng H, Li L. Causes and consequences of low grade endotoxemia and inflammatory diseases. Front Biosci. 2013;5:754–65. doi: 10.2741/s405. [DOI] [PubMed] [Google Scholar]
- Goldstein JA. Clinical relevance of genetic polymorphisms in the human CYP2C subfamily. Br J Clin Pharmacol. 2001;4:349–55. doi: 10.1046/j.0306-5251.2001.01499.x. [DOI] [PMC free article] [PubMed] [Google Scholar]
- Hughes S, Pothecary CA, Jagannath A, Foster RG, Hankins MW, Peirson SN. Profound defects in pupillary responses to light in TRPM-channel null mice: a role for TRPM channels in non-imaging-forming photoreception. European Journal of Neuroscience. 2012;35:34–43. doi: 10.1111/j.1460-9568.2011.07944.x. [DOI] [PMC free article] [PubMed] [Google Scholar]
- Johnson BA, Cole BS, Geisert EE, Ikeda S, Ikeda A. Tyrosinase is the modifier of retinoschisis in mice. Genetics. 2010;186(4):1337–1344. doi: 10.1534/genetics.110.120840. [DOI] [PMC free article] [PubMed] [Google Scholar]
- Jonas RA, Yuan TF, Liang YX, Jonas JB, Tay DKC, Ellis-Behnke RG. The spider effect: morphological and orienting classification of microglia in response to stimuli in vivo. PloS One. 2012;7(2):e30763. doi: 10.1371/journal.pone.0030763. [DOI] [PMC free article] [PubMed] [Google Scholar]
- Kwak HC, Kim HC, Oh SJ, Kim SK. Effects of age increase on hepatic expression and activity of cytochrome P450 in male C57BL/6 mice. Arch Pharm Res. 2014 doi: 10.1007/s12272-014-0452-z. [DOI] [PubMed] [Google Scholar]
- Lewis GP, Fisher SK. Up-regulation of glial fibrillary acidic protein in response to retinal injury: its potential role in glial remodeling and a comparison to vimentin expression. Int Rev Cytol. 2003;230:263–90. doi: 10.1016/s0074-7696(03)30005-1. [DOI] [PubMed] [Google Scholar]
- Liets LC, Eliasieh K, van der List DA, Chalupa LM. Dendrites of rod bipolar cells sprout in normal aging retina. Proc Natl Acad Sci U S A. 2006;103(32):12156–12160. doi: 10.1073/pnas.0605211103. [DOI] [PMC free article] [PubMed] [Google Scholar]
- Lin MT, Beal FM. Mitochondrial dysfunction and oxidative stress in neurodegenerative diseases. Nature. 2006;443:787–795. doi: 10.1038/nature05292. [DOI] [PubMed] [Google Scholar]
- Medzhitov R, Schneider DS, Soares MP. Disease tolerance as a defense strategy. Science. 2012;335(6071):936–941. doi: 10.1126/science.1214935. [DOI] [PMC free article] [PubMed] [Google Scholar]
- Milnerwood AJ, Raymond LA. Early synaptic pathophysiology in neurodegeneration: insights from Huntington’s disease. Trends Neurosci. 2010;33(11):513–523. doi: 10.1016/j.tins.2010.08.002. [DOI] [PubMed] [Google Scholar]
- Mustafi D, Maeda T, Kohno H, Nadeau JH, Palczewski K. Inflammatory priming predisposes mice to age-related retinal degeneration. J Clin Invest. 2012;122(8):2989–3001. doi: 10.1172/JCI64427. [DOI] [PMC free article] [PubMed] [Google Scholar]
- Nadeau JH, Singer JB, Matin A, Lander ES. Analysing complex genetic traits with chromosome substitution strains. Nat Genet. 2000;24(3):221–225. doi: 10.1038/73427. [DOI] [PubMed] [Google Scholar]
- Parisi M, Glass I. Joubert Syndrome and Related Disorders. In: Pagon RA, Adam MP, Ardinger HH, Bird TD, Dolan CR, Fong CT, Smith RJH, Stephens K, editors. GeneReviews. 2003. [Google Scholar]
- Pino-Lagos K, Benson MJ, Noelle RJ. Retinoic Acid in the Immune System. Annals of the New York Academy of Sciences. 2009;1143:170–187. doi: 10.1196/annals.1443.017. [DOI] [PMC free article] [PubMed] [Google Scholar]
- Samuel MA, Zhang Y, Meister M, Sanes JR. Age-related alterations in neurons of the mouse retina. J Neurosci. 2011;31(44):16033–16044. doi: 10.1523/JNEUROSCI.3580-11.2011. [DOI] [PMC free article] [PubMed] [Google Scholar]
- Sen S, Churchill GA. A statistical framework for quantitative trait mapping. Genetics. 2001;159:371–387. doi: 10.1093/genetics/159.1.371. [DOI] [PMC free article] [PubMed] [Google Scholar]
- Singer JB, Hill AE, Burrage LC, Olszens KR, Song J, Justice M, et al. Genetic dissection of complex traits with chromosome substitution strains of mice. Science. 2004;304(5669):445–448. doi: 10.1126/science.1093139. [DOI] [PubMed] [Google Scholar]
- Sullivan RKP, Woldemussie E, Pow DV. Dendritic and synaptic plasticity of neurons in the human age-related macular degeneration retina. Invest Ophthalmol Vis Sci. 2007;48(6):2782–2791. doi: 10.1167/iovs.06-1283. [DOI] [PubMed] [Google Scholar]
- Taylor BA. Recombinant inbred strains: Use in gene mapping. In: Morse HC III, editor. Origins of Inbred Mice. Academic Press; NY: 1978. pp. 423–438. [Google Scholar]
- Terzibasi E, Calamusa M, Novelli E, Domenici L, Strettoi E, Cellerino A. Age-dependent remodelling of retinal circuitry. Neurobiol Aging. 2009;30(5):819–828. doi: 10.1016/j.neurobiolaging.2007.08.017. [DOI] [PubMed] [Google Scholar]
- Xiao J, Liang Y, Li K, Zhou Y, Cai W, Zhou Y, et al. A novel strategy for genetic dissection of complex traits: the population of specific chromosome substitution strains from laboratory and wild mice. Mamm Genome. 2010;21(7–8):370–376. doi: 10.1007/s00335-010-9270-x. [DOI] [PubMed] [Google Scholar]


