

Abstract
Increased relative brain size characterizes the evolution of primates, suggesting that enhanced cognition plays an important part in the behavioral adaptations of this mammalian order. In addition to changes in brain anatomy, cognition can also be regulated by molecular changes that alter synaptic function, but little is known about modifications of synapses in primate brain evolution. The aim of the current study was to investigate the expression patterns and evolution of 20 synaptic genes from the prefrontal cortex of 12 primate species. The genes investigated included glutamate receptors, scaffolding proteins, synaptic vesicle components, as well as factors involved in synaptic vesicle release and structural components of the nervous system. Our analyses revealed that there have been significant changes during primate brain evolution in the components of the glutamatergic signaling pathway in terms of gene expression, protein expression, and promoter sequence changes. These results could entail functional modifications in the regulation of specific genes related to processes underlying learning and memory.
Keywords: brain evolution, glutamatergic neurotransmission, prefrontal cortex, synapse
Introduction
Increased brain size relative to body mass distinguishes primates, and especially humans, from other mammals (Jerison 1975; Finlay and Darlington 1995; Boddy et al. 2012). The prefrontal cortex (PFC), in particular, is disproportionately enlarged in association with increasing neocortical volume across primates (Smaers et al. 2010). Furthermore, excitatory pyramidal neurons within heteromodal association areas of the primate cerebral cortex, such as the PFC, have more complex dendritic branching and greater density of synaptic spines than other cortical regions (Huttenlocher 1979; Elston 2000; Elston et al. 2001; Jacobs et al. 2001; Bianchi et al. 2013), and evidence indicates that the human PFC contains more neuropil space for synapses and dendritic arbors than in other great apes (Semendeferi et al. 2011; Spocter et al. 2012). Such changes in synaptic distribution in the primate PFC are likely related to differences in the expression patterns of specific genes (Cáceres et al. 2007; Cruz-Gordillo et al. 2010; Fedrigo et al. 2011), as well as increased transcriptional complexity (Konopka et al. 2012).
Synapses are molecular systems with highly complex and organized protein networks enabling a wide range of adaptive physiological and behavioral features, including the regulation of learning and memory (Bayés and Grant 2009; Bayés et al. 2012; Emes and Grant 2012). Studies of the human postsynaptic proteome have shown that a majority of its genes evolved under very strong purifying selection over the past 100 million years (Emes and Grant 2012). Nevertheless, genes significantly upregulated in human PFC compared with chimpanzees and macaque monkeys are enriched for functional categories such as synaptic transport, synaptic plasticity, and nervous system development (Cáceres et al. 2003, 2007; Nowick et al. 2009; Konopka et al. 2012). Moreover, specific enzymes related to synaptic transmission, learning, and memory changed rapidly in the human evolutionary lineage (Fu et al. 2011). This indicates that the molecular composition of synaptic components has undergone modification during human brain evolution, yet it remains unknown how evolution influenced synaptic gene expression across primate phylogeny more broadly.
Although primate diversity shows a wide range of variation in brain morphology, behavior, and cognitive abilities, the changes accumulated between related species at amino acid sequences are very low and usually neutral (i.e., ∼1% between human and chimpanzee) (Ebersberger et al. 2002; Carroll 2003; Wildman et al. 2003; Consortium 2005). Overall genomic divergence in regions related to gene regulation, however, may be more significant. For example, human and chimpanzee genomes differ by ∼4% when taking into account single nucleotide mutations in noncoding regions, indels, and structural chromosomal changes (Varki and Altheide 2005). Consequently, it has been suggested that many of the key phenotypic differences among species result primarily from alterations in the regulation of gene expression rather than in the protein coding sequences alone (King and Wilson 1975; Gu and Gu 2003). When gene expression changes are phylogenetically mapped, the brain shows more changes than other tissues in the human lineage compared with the chimpanzees (Enard, Khaitovich, et al. 2002). Identifying the specific genes that underwent expression changes during primate brain evolution could provide important clues to the biochemical, anatomical, and functional specializations of the brain and to humans' increased vulnerability to certain neurodegenerative diseases such as Alzheimer's disease (Hof et al. 2002; Jucker 2010; Heuer et al. 2012).
However, there are obstacles to studying molecular evolution in primate brains, including the scarce availability of adequate samples from a diversity of species. Consequently, the vast majority of comparative studies of gene and protein expression in primates have focused on a few species for which reference genome sequences have been completed, namely humans, chimpanzees, macaques, and sometimes orangutans and gorillas (Enard, Khaitovich, et al. 2002; Cáceres et al. 2003; Khaitovich et al. 2004; Uddin et al. 2004; Gilad, Oshlack, Smyth, et al. 2006). Many of the earlier comparative gene expression studies analyzed nonhuman primate mRNA with microarrays containing only human DNA probes (Enard, Khaitovich, et al. 2002; Cáceres et al. 2003; Khaitovich et al. 2004; Somel et al. 2009), and as a result, their ability to detect inter-species expression differences was limited by the effect of sequence mismatches on hybridization intensity. More recently, multispecies gene expression profiling studies have employed RNA-seq (Brawand et al. 2011; Perry et al. 2012).
In this study, we compared gene expression profiles of 20 synapse-related genes from the PFC of humans, chimpanzees, siamang, Old World monkeys (OWMs) (macaques and baboons), New World monkeys (NWMs) (saki and spider monkey), and strepsirrhines (lorises and lemurs). An evolutionary analysis of these synapse-associated genes significantly widens the diversity of primate species included in the study of mRNA expression levels in the brain, allowing us to examine changes across phylogeny, providing new insights into the molecular evolution of neocortical synapses, and suggesting that glutamatergic neuro-transmission has been a primary target of evolutionary change.
Materials and Methods
Databases and previous publications were used to identify a group of genes exclusively or predominantly expressed in the brain and involved in regulating synaptic transmission. Genes well known to participate in regulating the molecular processes of memory and learning were added, as well as a set of genes implicated in various disorders of the nervous system. The resulting selection of 20 genes includes classical components of the junctional complex associations, including the neuronal postsynaptic density (PSD) and the presynaptic active zone, comprising glutamate receptors, scaffolding proteins, synaptic vesicle components, and structural components of the nervous system (Table 1). The potential number of genes that could be studied is enormous and the aim of this work is only to study a small and representative subset of genes involved in neural processes. Our set of 20 genes selected was submitted to GO Panther analysis and the families most represented are depicted in Supplementary Figure 1.
Table 1.
Summary of the genes studied
| Biological function | Protein | Gene ID | Related diseases | Antibody used |
|---|---|---|---|---|
| Cell adhesion | Reelin | RELN | Schizophrenia Alzheimer's disease Lissencephaly |
|
| Neurexin1 | NRXN1 | Pitt–Hopkins syndrome Schizophrenia Autism |
||
| Neuroligin 1 | NLGN1 | Autism | ||
| Neuroligin 2 | NLGN2 | Schizophrenia | ||
| Contactin-associated protein-like 2 | CNTNAP2 | Cortical dysplasia-focal epilepsy syndrome Pitt–Hopkins-like syndrome 1 Autism |
||
| Cell adhesion molecule with homology to L1CAM | CHL1 | Schizophrenia | ||
| Glutamatergic synapse | Glutamate receptor 1 | GRIA1 | Schizophrenia Amyotrophic lateral sclerosis |
|
| Calcium/calmodulin-dependent protein kinase II alpha | CAMK2A | Thermo Scientific, Rabbit | ||
| Vesicular glutamate transporter | SLC17A7 | NeuroMab N28/9, Mouse | ||
| Glutamate receptor ionotropic subunit 2B | GRIN2B | Mental retardation Schizophrenia |
Millipore 1C6.5C4, Mouse | |
| Glutamate receptor ionotropic AMPA 4 | GRIA4 | Abgent RB30232, Rabbit | ||
| Scaffolding protein | Postsynaptic density 95 | DLG4 | Schizophrenia | |
| Synapse-associated protein 97 | DLG1 | Schizophrenia | ||
| Spinophilin | PPP1R9B | Schizophrenia | ||
| Calcium/calmodulin-dependent serine protein kinase | CASK | Mental retardation FG syndrome 4 X-linked mental retardation |
||
| Gephyrin | GPHN | Molybdenum cofactor deficiency Hyperekplexia |
||
| Synaptic vesicle cycle | Syntaxin 1A | STX1A | Schizophrenia Williams syndrome |
|
| Synaptophysin | SYP | X-linked mental retardation | ||
| Cell cycle | Histone deacetylase | HDAC2 | Huntington's disease Alzheimer's disease |
|
| Cytoskeleton protein | Neurofilament L-chain | NEFL | Charcot-Marie-Tooth disease |
Note: The genes are grouped depending on their major brain function and related diseases are reported according to published data (http://omim.org/). Finally, the antibodies used to measure protein changes in western blots appear in the last column.
Brain Samples
The study sample consisted of frozen postmortem brains from a total of 37 different primate individuals (Lorises - Loris tardigradus, n = 1; Nyticebus pygmaeus, n = 3; Lemurs - Lemur catta, n = 1; Eulemur macaco, n = 1; New World monkeys - Ateles belzebuth, n = 2; Pithecia pithecia, n = 2; Old World monkeys - Papio anubis, n = 1; Macaca mulatta, n = 8; Macaca nemistrina, n = 2; Hominoids - Symphalamgus syndactylus, n = 1; Pan troglodytes, n = 11; Homo sapiens, n = 4). Tissue samples were dissected from the frontal pole, which corresponds to Brodmann's area 10 in all haplorhine primates (including apes, NWMs, and OWMs) and in strepsirrhine primates may include area 14 (Brodmann 1909; Preuss and Goldman-Rakic 1991; Semendeferi et al. 2001; Burman et al. 2006; Cruz-Rizzolo et al. 2011), both of which are granular PFC regions (Supplementary Table 1). The human frozen samples were obtained from the National Institute of Child Health and Human Development Brain and Tissue Bank for Developmental Disorders at the University of Maryland (Baltimore, MD). The chimpanzee brains were obtained from the Alamogordo Primate Facility (Holloman AFB, NM), the macaque brains were obtained from Texas Biomedical Research Institute (San Antonio, TX) and from Wisconsin National Primate Research Center (Madison, WI). The other primate brains used in the study were obtained from Cleveland Metroparks Zoo (Cleveland, OH). All animals were housed in accordance with NIH, USDA, and AWA regulations, and overseen by the IACUCs of the respective institutions (National Research Council (US) Committee for the Update of the Guide for the Care and Use of Laboratory Animals 2011). Among the samples used, both sexes were represented, including 21 males and 14 females. Due to the opportunistic nature of brain sample collection included in this study it was not possible to obtain balanced sex distributions in each species. The time between death and tissue freezing was, for those cases in which this information was available, never longer than 24 h. Frozen brain samples were stored at −80 °C until use. All human brain specimens originated from individuals free of neurological or psychiatric disorders. No neurological deficits were detected in any of the other species included in this study, and all brains appeared normal on routine inspection at necropsy.
RNA Extraction and qPCR
Tissue samples were homogenized in 1 mL of TRI reagent (Applied Biosytems/Ambion, Austin, TX) per 50–100 mg of tissue using glass-Teflon tubes. RNA extraction was performed using TRIzol (Invitrogen, Carlsbad, CA, USA) following standard protocols. The mRNA was isolated and reverse-transcribed to single stranded cDNA by using random hexamer primers. Only the DNA-free RNA isolations with ABS 260/280 ratios above 1.7 (Nanodrop 1000; Thermo Scientific, Wilmington, DE) and with RIN number (Agilent 2100 bioanalyzer, Agilent Technologies, Santa Clara, CA, USA) >6 were selected for analysis. These properties showed good performance on previous RT-PCR studies for <100 bp amplified products (Fleige and Pfaffl 2006). Quantitative real-time reverse-transcriptase polymerase chain reaction (qPCR) was conducted on a CFX384 thermal cycler using SsoFast EvaGreen reagent (BioRad, Hercules, CA, USA). Primer sequences used are listed in Supplementary Table 2. The q-RT-PCR program started with a hot start at 95 °C for 5 min, followed by 40 cycles of a 15-s melt at 95 °C, and a 30-s annealing/elongation at 60 °C. After 40 cycles were completed, a dissociation curve was created from 65 to 95 °C.
Within plates, expression was normalized using 2 housekeeping genes that have been previously employed for evolutionary studies of brain samples (EEF2 and EIF2b2) (Fedrigo et al. 2010). Amplification of the gene of interest and the housekeeping control genes EEF2 and EIF2b2 was done in duplicate for each sample. The gene amplification levels were normalized by dividing by EEF2 and EIF2b2 levels (separately), and the results were combined per each individual single expression value. The following primers for the housekeeping genes were used (Integrated DNA Technologies, Coralville, IA, USA): 5′-CCACAGTTCCCCAATGAAGAAG-3′ (EIF2b2 forward); 5′-ACGTAGTCAAACACAGGGCAATG-3′ (EIF2b2 reverse); 5′-GGTGAACTTCACGGTAGACCAGAT-3′ (EEF2 forward); 5′-GGAGTCTGTCAGCGTGGACTTG-3′ (EEF2 reverse). To convert raw results into relative expression across all the samples, we used a modified ΔΔCt method and the relative value of 1 was given to the human sample number 37 (the best preserved human brain sample) in all plates, therefore all sample values were relative to this one. The relative expression values were then log10-transformed and used in subsequent statistical analyses when necessary. For primer design, a completely conserved exonic region among all transcript isoforms and species was chosen, based on University of California Santa Cruz (UCSC) annotations. The primers were designed following these parameters: primer size min 17 bp, max 24 bp; primer Tm min 50 °C, max 61 °C; primer GC content min 40%, max 60%; Max complementarity 3′Self 3.00. The primer sequences were unique in the genome, confirmed by blasting the nucleotide sequence to the publically available genomes (http://genome.ucsc.edu/cgi-bin/hgPcr). Finally, different sets of primers were checked whenever it was possible and the pair which maximizes the amplification signal in qPCR was selected. The primers used are summarized in Supplementary Table 2.
Principal Components Analyses (PCA)
Because alterations in the relative levels of gene expression may be intercorrelated with changes in cellular and synaptic physiology during brain evolution (Cáceres et al. 2003), multivariate PCA was performed to define “molecular fingerprints” of the individuals in the sample (Ringnér 2008). Measurements of gene expression were log10-transformed, scaled and centered for use in the PCA. The principal components were sorted in descending order of the percentage of variability in the total sample that they describe. Higher-order principal components were explored to identify those capturing the greatest proportion of variation among the primate brains in the sample. All PCAs were performed in R version 3.0 (R Core Team 2013).
Ancestral Gene Expression Reconstruction
For ancestral state reconstruction, the relative gene expression values obtained from qPCR analysis were used, as described above. The ancestral state reconstructions were performed using the Analysis of Phylogenetics and Evolution (APE) package (Paradis et al. 2004) in R software, using the maximum likelihood method in function ace. The consensus tree used in these analyses was downloaded from the 10ktrees website (Arnold et al. 2010).
Phylogenetic Signal
Phylogenetic signal is the tendency of related species to resemble each other more than species drawn at random from the same tree. If there is strong phylogenetic signal, related species will be close to each other in trait values. In the absence of a phylogenetic signal, however, related species will not always be close to each other in trait values, which will result in greater changes along the branches of the phylogeny (Klingenberg and Gidaszewski 2010). For continuously varying data, currently the most common way to estimate phylogenetic signal is with the parameter λ (Pagel 1999), which is a branch length scaling parameter that typically ranges from 0 to 1. Pagel's λ was estimated with the function fitContinuous (package geiger), in R software, which is based on likelihood optimization. It is common to equate low phylogenetic signal with evolutionary variability and strong phylogenetic signal has been interpreted as a sign of niche or evolutionary conservatism (Revell et al. 2008), but does not specify a process (e.g., genetic drift, natural selection).
Western Blotting
To examine the correspondence between mRNA expression level and protein translation, western blotting was performed. For immunoblotting, 0.1 g of each frontal pole sample was homogenized in 1 mL of RIPA Lysis and Extraction buffer (Pierce, Rockford, IL, USA) with complete protease inhibitor cocktail EDTA-free (Roche, Indianapolis, IN, USA) and phosphatase inhibitor cocktail (ThermoScientific, Rockford, IL, MA, USA). After centrifugation at 15 000 × g for 10 min, the RIPA-soluble fraction was kept and the RIPA-insoluble fraction was discarded. Protein expression was determined from lysates, dissolved in Laemmli buffer and equal amounts of each fraction sample resolved on 4–12% SDS–PAGE gels (BioRad, Hercules, CA, USA). Proteins were transferred to nitrocellulose overnight; the membrane was blocked with 5% dry milk solution and incubated with the appropriate antibody. Primary antibodies used in the study have been validated to recognize either the human or rat protein, and should be effective on nonhuman primates because the target epitope is conserved on known antibodies. All the antibodies used are summarized in Table 1. Mouse monoclonal anti-β-actin (1:2000, Abcam, Cambridge, MA, USA) was used as the loading control. All secondary antibodies were from Dako (Carpinteria, CA, USA) and used at a dilution of 1:1000. Protein bands were scanned on an Epson Perfection 5000 Photo Scanner (Epson America, Long Beach, CA, USA) and the densitometric quantification of western blot bands was analyzed using ImageJ software (National Institute of Health, Bethesda, MD, USA).
Detecting Signatures of Positive Selection in Regulatory Regions
For the 20 genes, the intronic, 5′-flanking putative promoter regions upstream of the coding region and both 3′- and 5′-untranslated regions (UTR) were extracted. In parallel, the most recent human (Homo sapiens), chimpanzee (Pan troglodytes), orangutan (Pongo pygmaeus abelii), and rhesus macaque (Macaca mulatta) sequences were downloaded from the Ensembl Genome Browser Website (http://useast.ensembl.org/index.html) and sequences were aligned using the computer program Geneious version 6.1.3 created by Biomatters (http://www.geneious.com/). Other species were not studied because of the low coverage of the sequences or the lack of available sequences.
Mutations responsible for trait expression variation are often localized in noncoding, regulatory regions. In order to find changes within these regulatory regions, the most 5′ transcription starting site (TSS) and UTR regions (Barrett et al. 2012) were identified. 5′-Flanking regions were defined as the 5-kb region upstream of the most 5′ TSS. The 5′- and 3′-UTRs were defined from the NCBI gene database annotations (http://www.ncbi.nlm.nih.gov/).
To test for lineage-specific signatures of positive selection, a modified branch site model was used (Zhang et al. 2005). Essentially, this method aims to detect a lineage-specific accelerated nucleotide substitution rate. This rate is estimated relative to a neutral rate in the form of a substitution rate ratio (sequence of interest/neutral sequence). It is crucial to find the most appropriate genomic region to use as a neutral proxy. As described previously (Fedrigo et al. 2011) for the noncoding analyses, a similar neutral proxy was applied to synonymous substitution studies. Because it has been shown that introns are the least constrained sequence of the genome (Hellmann et al. 2003), we collected all introns from the gene of interest.
Introns contain regulatory elements that can be more slowly evolving than neutral sites. The strategy was to eliminate any putatively functional regions that might be conserved between species and that would artificially inflate the substitution rate ratio and can lead to erroneous detection of positive selection. One hundred base pairs at each extremity of the introns were excluded, with the goal of eliminating splicing signal sites. Also first introns were excluded because they are known to contain regulatory elements, and a maximum of 5000 bp was included from any one intron, drawn from the edges, as some long introns have been shown to contain regulatory elements at their center (Wray et al. 2003; Blanchette et al. 2006; Haygood et al. 2007). Then, the overlapping regulatory and exonic regions from other genes were removed, according to NCBI and Ensembl annotations (http://www.ensembl.org). Finally, the remaining intronic sequences were used as a neutral proxy for detecting positive selection in the noncoding regions described above. For all the genes, the intronic sequences were >5000 bp, except for SLC17A7 and NEFL for which an intronic region from the closest gene was also used.
This method compares a null model with no positive selection but that accounts for relaxed constraint, and an alternative model with positive selection on the branch of interest. The 2 models were contrasted with a likelihood ratio test and the significance of the likelihood ratio test was assessed using a χ2 with one degree of freedom. A significant P value (P < 0.05) is suggestive of positive selection. We performed these tests with customized and available scripts in the HyPhy software (http://www.hyphy.org) (Pond et al. 2005). The noncoding sequences were analyzed using similar methods (Zhang et al. 2005; Haygood et al. 2007; Fedrigo et al. 2011) and the same 4 species. The tests were performed on both the human and chimpanzee branches, but also on the internal branch leading to both taxa. HyPhy scripts were obtained from http://biology.duke.edu/wraylab/resources.html.
Results
Gene Expression
The expression levels for 20 synapse-related genes in the frontal pole of 12 different primate species were measured by qPCR using primers to conserved exonic domains (summarized in Supplementary Table 2). A PCA was carried out to summarize variation in the expression level of the selected genes across all species. For this initial exploratory analysis, scaled and mean-centered values of the data were used. Together, the first and second principal components accounted for ∼30% of the variability in the entire dataset (Fig. 1). The total multivariate gene expression data from all individuals were plotted according to these first 2 principal components to determine the main axes of variation along which clusters of different species can be observed. Lorises were separated from the rest of the primates (NWMs, OWMs, lemurs, and hominoids) along PC1. The relative magnitude of the loading (in absolute value) is a measure of the importance of the corresponding gene in defining the principal component (Misra et al. 2002). The genes that loaded most strongly on PC1 include: NEFL, PPP1R9B, DLG1, DLG4, and SLC17A7 (Fig. 1). The distribution of species along PC2 showed separation of humans and chimpanzees from the other primates in the sample. The main loading on PC2 include: GRIN2B, GRIA4, CNTNAP2, CAMK2A, and NRXN1 (Fig. 1).
Figure 1.
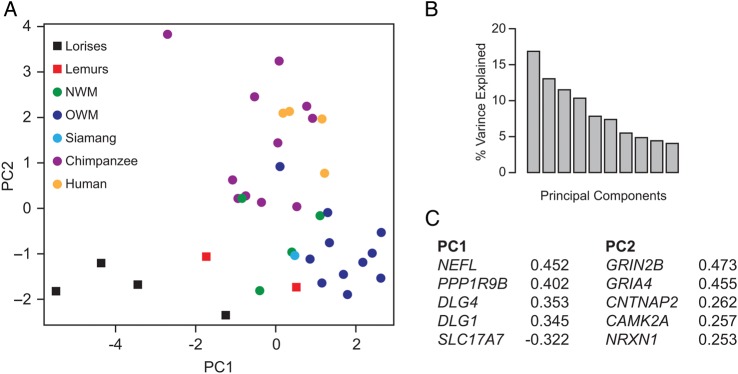
(A) PCA plot with samples plotted in 2 dimensions using their projections onto the first 2 principal components. Each dot represents an individual brain sample and the colors identify the different phylogenetic groups. PC1 and PC2 refer to the first and second principal component. (B) Fraction of variance (histogram) of the principal components when PCA is applied to all 20 genes. PC1 and PC2 represent 17 and 13%, respectively. (C) The strongest loadings in the first 2 PC are depicted.
Because genes that primarily load on the first 2 principal components were most useful for distinguishing phylogenetic variation, we filtered the genes after the 5 that most strongly influenced loadings. Thus, a total of 10 genes were selected for further analysis. These genes showed the greatest variation in the sample and might be relevant to understanding evolutionary changes in molecular biology of synaptic function (Fig. 1).
Samples were subdivided into phylogenetic groups for further comparison—lemurs, lorises, NWMs, OWMs, siamang, chimpanzees, and humans. Boxplots showing gene expression within these phylogenetic groups are represented in Figure 2 (see Supplementary Figs 2 and 3 for all genes). Of these genes, several showed significant variation in the mRNA expression level, including DLG4, CAMK2A, CASK, GRIA4, NEFL, CNTNAP2, GRIN2B, PPP1R9B, SLC17A7, and STX1A (P < 0.05, df = 6, Kruskal–Wallis test). Follow-up pairwise Mann–Whitney U tests showed that among these genes, 11 contrasts between phylogenetic groups were significant as shown in Supplementary Figure 2. Other genes, however, showed conserved expression and no significant differences among phylogenetic groups (CHL1, GRIA1, GPHN, HDAC2, NLGN2, NLGN1, RELN, and SYP). The variation in gene expression level was high both within and between groups. This was not unexpected given the rarity of brain specimens from many of these species and hence the difficulty of minimizing cross-sample effects of sex, circadian rhythm, diet, age, and other uncontrolled variables. Furthermore, since gene expression may vary during development, Mann–Whitney contrasts were carried out to identify possible statistical differences between the 4 subadult macaque monkey samples included in the OWM group as compared with adults (Supplementary Fig. 4). None of the 20 genes showed statistical significance between age groups; therefore the sub-adult samples of macaques were retained in the study for further analysis. It is notable that the largest changes in neocortical gene expression have been found to occur during fetal development and early postnatal infancy (Colantuoni et al. 2011); the sub-adult samples of macaques included in our study range from 1 to 2.8 years of age, which corresponds to late infancy and the juvenile period.
Figure 2.

Boxplots of the gene expression in PFC among the phylogenetic groups. In all cases data were log-transformed after using a human sample as a relative expression of 1, and then all the values were normalized relative to it. The genes most strongly represented in the loadings of the first 2 PCs are shown. In (A) and (B) boxplots of gene expression for the 5 genes in first PC and in the second PC are represented, respectively. For all the genes, the P-value obtained in the nonparametric Kruskal–Wallis test (df = 6) is: NEFL (P = 0.0001), DLG1 (P = 0.077), DLG4 (P = 0.043), PPP1R9B (P = 0.026), SLC17A7 (P = 0.0081), CNTNAP2 (P = 0.0055), CAMK2A (P = 0.0363), GRIA4 (P = 0.0006), NRXN1 (P = 0.051), and GRIN2B (P = 0.004). The significant paired contrasts were (P < 0.05): NEFL (OWM vs. all the other groups), DLG1 (OWM–lorises and OWM–NWM), DLG4 (human–lorises), PPP1R9B (human–chimpanzee), SLC17A7 (chimpanzee–lorises and OWM–loris), CAMK2A (chimpanzee–lorises and chimpanzee–OWM), GRIA4 (chimpanzee–NWM, chimpanzee–OWM, and human–NWM, human–OWM), NRXN1 (chimpanzee–OWM, OWM–lorises, and human–lorises), and GRIN2B (chimpanzee–lorises, human–lorises, human–NWM, human–OWM, and human–chimpanzee). Only CNTNAP2 was observed to be significantly different at Kruskal–Wallis test but then not significant after the Mann–Whitney U test for any population. Open circles represent values that fall outside the upper and lower quartiles. The asterisks (*) represent a P < 0.05 in the paired comparisons using Mann–Whitney contrasts. Note that the groups that concentrate almost the totality of the significance are chimpanzees and OWMs due to greater number of samples on them (n = 11). OWM: Old World monkeys; NWM: New World monkeys.
Phylogenetic Signal
In the presence of a strong phylogenetic signal in the data, closely related species tend to be near each other in phenotype and, as a result, the average amount of expression change along the branches of the tree is relatively small. In contrast, data lacking a phylogenetic signal tend to produce greater expression changes on the branches of the phylogeny because closely related species are expected to be just as distant from each other as remotely related species. Overall, the expected amount of change on the entire tree is smaller if there is a strong phylogenetic signal than in the absence of a phylogenetic signal.
The strength of phylogenetic signal was measured using the species-mean mRNA expression values obtained in all 20 genes. Tests for phylogenetic signal in expression (Supplementary Table 3) showed that SYP, GRIA1, and CHL1 are phylogenetically conserved, with median maximum likelihood estimates of λ not significantly different from a Brownian model of neutral evolution (λ = 1), whereas STX1A, NLGN2, GPHN, NLGN1, CAMK2A, NEFL, RELN, NRXN1, CNTNAP2, CASK, DLG1, GRIA4, and GRIN2B are more variable across the tree (median λ ≈ 0).
Ancestral Character Reconstruction
Multispecies study of gene expression evolution provides the possibility to estimate ancestral expression from the levels observed in extant crown species in the phylogenetic tree. Ancestral character reconstruction of gene expression was performed for the internal nodes of the species represented in our sample. Notably, a consistent pattern of decreasing levels in gene expression across the tree characterizes DLG4, PPP1R9B, and NRXN1 genes. In contrast, across the primate phylogenetic tree, several lineages, including SLC17A7, GRIA4, and CAMK2A are reconstructed to show an increase in expression (Fig. 3).
Figure 3.

Ancestral character state reconstruction. A phylogenetic tree of the primates used in the study and the inferred ancestral gene expression values for the genes most weighted in PC1 and PC2. The top row of trees corresponds to PC1 elements and the bottom row shows PC2 elements. Numbers on the nodes are the estimated levels of gene expression in the genes along the different evolutionary lineages. Numbers at the tips are average values from each phylogenetic group. The final expression values represent relative values; there is no attempt at quantifying the absolute level of expression. NWM: New World monkeys; OWM: Old World monkeys.
Protein Expression
It is conceivable that some mRNA expression differences are not reflected at the protein level. Gene expression can be modulated by alternative splicing, methylation, degradation, or gene duplication (Cain et al. 2011; Harrison et al. 2012). In addition, many mechanisms could modify protein levels (Mazumder et al. 2003), which would not be expected to correlate with mRNA levels. The genes involved in the ionotropic glutamate receptor pathway according the Panther pathway classification were selected to investigate whether quantitative changes in RNA levels are transcribed into similar differences in protein levels across species. The 4 representatives in this category were CAMK2A, GRIA4, GRIN2B, and SLC17A7 (Supplementary Fig. 1). Commercial antibodies raised against conserved epitopes within primates were used, which allowed for detection of the proteins of interest in all samples (Table 1). The expression of these proteins was compared in the same gel; 22 brain samples were loaded (lorises, n = 3; lemurs, n = 2; NWM, n = 3; OWM, n = 3; siamang, n = 1; chimpanzees, n = 6; humans n = 4). GRIA4 expression displayed significant variation (Kruskal–Wallis test, P = 0.015, df = 6, χ2 = 16.35; humans differ from OWM after correction for Mann–Whitney U test, P = 0.2). For SLC17A7 expression, an increase in expression was evident in humans compared with the other primates, although there was not an overall effect in the Kruskal–Wallis test (P = 0.09, Mann–Whitney U showed P = 0.2 between humans and chimpanzees). CAMK2A expression also exhibited an upregulation in chimpanzees and humans relative to the other primates (Kruskal–Wallis test, P = 0.005, df = 6, χ2 = 12.73; a Mann–Whitney pairwise test showed no significant differences). Finally, GRIN2B showed an increase in its expression across primates (P = 0.25, Kruskal–Wallis test) (Fig. 4).
Figure 4.

Western blot analysis of proteins involved in the Ionotropic Glutamate Receptor pathway. (A) For each sample, 15 μg of PFC homogenate were loaded into a 4–12% gel and blotted against CAMK2A, SLC17A7, GRIN2B, and GRIA4 proteins. For all the cases, β-actin was used as a loading control. (B) Densitometric analysis for the genes studied. The samples were grouped and the results are presented as means ± SD. The samples used for the western blot analysis are summarized in Table 2. NWM, New World monkeys; OWM, Old World monkeys. AU, arbitrary units.
Tests of Promoter Site Evolution
Publicly available genomic datasets from multiple species were analyzed to search for nucleotide substitutions that might relate to the gene expression variation observed in primate PFC tissue by scanning possible regulatory regions for evidence of positive selection. Using this analysis, positively selected regulatory regions are determined as an overabundance of substitutions in the putative regulatory sequence as compared with nearby intronic regions, which are assumed to be evolving in a neutral fashion. The genomic coverage of the studied regions in some species was poor. Therefore, we scanned for signatures of positive selection only on the human and chimpanzee lineages, as well in the internal branch leading to human and chimpanzee, using a 4-species tree of known phylogenetic relationships (human, chimpanzee, orangutan, and rhesus monkey).
Most of the putative regulatory regions appeared to be not significantly different after correction for multiple comparisons. Only 4 genes showed a signature of positive selection in a regulatory region (Table 2), displaying changes located at 5′-flanking regions of CAMK2A (P = 0.0005207 on the internal branch), GRIN2B (P = 4.6757E−06 on the internal branch) GRIA1 (P = 1.442E−07 for the chimpanzee branch) and STX1A (P = 0.000388 on the chimpanzee branch) genes. It is important to note that the type of scan for selection employed requires multiple sequence changes, accumulated in a defined region, for an inference of positive selection. Although scans only surveyed possible regulatory regions located close to the genes (5 kb upstream and UTRs), some important regulatory elements may be located at more distal regions that were not surveyed. This point, and the generally underpowered nature of tests for selection, indicates that a negative result does not rule out the possibility that positive selection operated on regulatory sequences (Cruz-Gordillo et al. 2010). Lastly, 5′-UTRs and 3′-UTR noncoding regions did not show an elevated substitution rate or significant evidence for signatures of positive selection either along the human lineage or the chimpanzee lineage. Some of the 3′- and 5′-UTR were short (∼50–100 bp), thus could account for our inability to find evidence of positive selection in these regions.
Table 2.
Branch-specific signatures of positive selection for the studied genes (P values)
| 5-Flanking |
5′-UTR |
3′-UTR |
|||||||
|---|---|---|---|---|---|---|---|---|---|
| Human | Chimpanzee | IB | Human | Chimpanzee | IB | Human | Chimpanzee | IB | |
| CAMK2A | 0.9991 | 0.9984 | 0.0005* | 0.9996 | 0.9994 | 0.9994 | 1.0000 | 1.0000 | 1.0000 |
| CASK | 1.0000 | 0.0170 | 0.0189 | NA | NA | NA | 0.6309 | 0.2493 | 0.0313 |
| CHL-1 | 0.0961 | 0.0154 | NA | 0.2982 | 0.4816 | NA | 0.9981 | 1.0000 | NA |
| CNTNAP2 | 1.0000 | 0.9992 | 0.3038 | 1.0000 | 0.9997 | 0.2953 | 0.3285 | 0.9994 | 1.0000 |
| DGL4 | 0.0188 | 0.7863 | 0.9997 | 0.2191 | 0.9998 | 1.0000 | 0.5700 | 0.9995 | 0.9994 |
| DLG1 | 0.0996 | 0.9990 | 0.2266 | 0.9997 | 0.9997 | 0.9992 | 1.0000 | 0.9999 | 0.9995 |
| GPHN | 0.6362 | 0.4563 | 0.9993 | 0.0046 | 0.0035 | 0.9998 | 0.6529 | 0.9996 | 0.9992 |
| GRIA1 | 0.0027 | 1.44E−07* | 0.9995 | 0.7095 | 1.0000 | 1.0000 | 0.0467 | 0.3349 | 0.9982 |
| GRIA4 | 0.9997 | 0.7681 | 0.6296 | 0.9991 | 1.0000 | 0.0243 | 0.9999 | 0.2415 | 1.0000 |
| GRIN2B | 0.9965 | 0.9992 | 4.68E−06* | 0.9994 | 0.9996 | 0.9997 | 0.2818 | 0.9985 | 0.9989 |
| HDAC2 | 0.4158 | 0.0717 | 0.9965 | 0.0790 | 0.0731 | 0.9998 | 0.7961 | 0.5813 | 0.6921 |
| NEFL | 0.0203 | 0.7555 | 0.9991 | 0.9998 | 0.9999 | 0.9997 | 0.7690 | 0.7990 | 0.9095 |
| NLGN1 | 0.0547 | 0.6088 | 0.9992 | 1.0000 | 1.0000 | 1.0000 | 0.9867 | 0.6916 | 0.9992 |
| NLGN2 | 0.1508 | 0.1423 | 0.9999 | NA | NA | NA | 0.9998 | 0.6625 | 0.9998 |
| NRXN1 | 0.1518 | 0.1423 | 0.9996 | 0.9993 | 1.0000 | 0.9993 | 0.6493 | 0.9996 | 0.7117 |
| PPP1R9B | 0.9992 | 0.9588 | NA | NA | NA | NA | 0.1184 | 0.7789 | NA |
| RELN | 0.9997 | 0.9993 | 1.0000 | 0.9982 | 1.0000 | 0.9981 | 1.0000 | 1.0000 | 0.3174 |
| SLC17A7 | 0.4583 | 0.9993 | 1.0000 | 0.3578 | 0.9995 | 1.0000 | 0.0161 | 0.9999 | 0.9999 |
| STX1A | 0.0231 | 0.0004* | 0.9999 | 1.0000 | 0.9998 | 0.5251 | 0.9770 | 0.9996 | 1.0000 |
| SYP | 0.7435 | 0.9996 | 0.5014 | 0.9996 | NA | NA | 0.4710 | 0.8027 | 0.9497 |
*q < 0.1.
Note: Positive selection was assessed in the human and chimpanzee lineages as well as the internal branch leading to their common ancestor. The P-values obtained are shown in the table. Analyses encompass 3 different regions: 5-flanking region (5 kb upstream from the TSS), 5′-UTR and 3′-UTR. After correction for multiple comparisons only the numbers with an asterisk showed q < 0.1. All the q < 0.1 were found at the 5′-flanking region and no positive selection was revealed in the 5′-UTR or 3′-UTR regions. NA: tests were not performed because of the poor sequence alignment/assembly quality, the region studied was too short (<10 bp) or the analyses were done only with 3 species (the internal branch was not tested). IB, internal branch leading to human and chimpanzee.
Discussion
Comparative analyses have identified a great number of differentially expressed genes in the brain among primate species, some of which might have a relationship to variation in physiology or anatomy (Cáceres et al. 2003, 2007; Uddin et al. 2004; Khaitovich et al. 2004; Cruz-Gordillo et al. 2010; Fedrigo et al. 2011). Previous comparative studies analyzed gene expression in the brain of only a modest number of species and were limited by relatively small sample size, which is particularly problematic for dynamic and environmental sensitive traits like gene expression (Gilad et al. 2006). Our analyses have expanded the diversity of primates studied and the number of samples in each phylogenetic group when possible. We have found that there has been significant upregulation in genes that encode for the molecular machinery related to glutamatergic signaling in primate prefrontal cortex evolution.
Genes with Cconserved Eexpression
Several of the genes in our study did not show evidence of significant variation in expression in the PFC across primates, suggesting a conserved function for these molecules in the primate brain. In particular, GPHN, GRIA1, HDAC2, CHL1, NLGN1, NLGN2, STX1A, RELN, and SYP did not vary across phylogenetic groups. Among them SYP, GRIA1, and CHL1 all showed a high phylogenetic signal (λ ≈ 1), and none of them were main contributors to PC1 or PC2 loadings in the multivariate analysis. The core parts of these genes are representatives of cell-adhesion molecules (CHL1, NLGN1, GPHN, NLGN2, and RELN), which are interactors of MAGUK members and key for synapse formation. They are involved in the initial contacts that lead to the recruitment of presynaptic and postsynaptic machinery, triggering neurite outgrowth regulation, axon formation, synaptogenesis, and spine maturation (Zheng et al. 2011). Also, cell-adhesion molecules coordinate multiple steps in the synapse with potentially rapid regulation of expression (Giagtzoglou et al. 2009). Changes in the sequence of regulatory regions for these genes may be less likely to occur due to the fact that they also have roles in nonneuronal tissues. On the other hand, representatives of the SNARE-associated complex, such as STX1A and SYP, play an essential function in vesicular release and changes in expression are related to many neuropathologic conditions (Johnson et al. 2008). STX1A did not undergo expression changes in the human branch, but it appears significantly upregulated in chimpanzees (Supplementary Fig. 2), which is also correlated with changes in the 5′-flanking region. A previous study described a pronounced signal of positive selection at the STX1A promoter region, especially in humans (Haygood et al. 2007).
Additionally, GRIA1 is related to the function of glutamatergic synapses and is one of the subunits required to assemble functional AMPA receptors, which play an important role in mediating fast excitatory transmission in the mammalian brain (Jayakar and Dikshit 2004). Although the analysis of the putative promoter region demonstrated a signature of positive selection in the chimpanzee branch and an effect that approached significance in the human lineage, these species did not differ significantly from other primates in gene expression levels (Supplementary Fig. 3). The results might be explained because either AMPA receptors experience a rapid endocytosis at excitatory synapses (Lu et al. 2007) and changes in expression are not stable in time, or because the changes in promoter sequence do not account for detectable changes in the gene expression in this region, but rather in other regions of the brain or other organs. These findings point to the need for future research to analyze the levels of the other glutamate receptor subunits and other components of the pathway in the PFC as well as from other brain regions from a range of primate species.
Genes Differentially Expressed
A trend across primate evolution for downregulation was revealed in the expression of PPP1R9B, DLG4, DLG1, and CASK (Fig. 1 and Supplementary Fig. 2). These 4 genes loaded strongly on PC1, being responsible for the separation between lorises and other primates in the PCA. Interestingly, 3 of these genes (DLG4, DLG1, and CASK) encode for members of the membrane-associated guanylate kinase family (MAGUK), which are scaffold proteins that regulate plasticity and adhesion at cell junctions (Funke et al. 2005; Oliva et al. 2012). DLG4 and DLG1 are among the most stable synaptic MAGUKs and their expression dramatically increases in postnatal development (Zheng et al. 2011). In turn PPP1R9B encodes a multifunctional scaffolding protein with a central role targeting components of both glutamatergic and dopaminergic signaling pathways in dendritic spines (Kelker et al. 2007). Remarkably, both MAGUK-family members and PPP1R9B are defined by the inclusion of a PDZ domain, among others, in their structure, which confers the capability of organizing the membrane, particularly in the synapse (Kim and Sheng 2004). The present results reveal that gene expression among these RNA transcripts has been differentially regulated in primate evolution. Comparisons of the ancestral reconstructed values for the expression levels of these genes (Fig. 3) demonstrate decreases at several nodes along the lineage leading to humans. This result corroborates a recent study where DLG1 and DLG4 proteins have been also reported to be 5-fold diminished in human cerebral cortex in comparison with mice (Bayés et al. 2012). Decreased levels in MAGUKs mRNA in the cerebral cortex of humans could also have a major role in the occurrence of neurodegenerative diseases through association and regulation of neurotransmitter receptors. Specifically, it has been described that decreased expression of MAGUKs is implicated in Parkinson's disease, Alzheimer's disease, schizophrenia, and neuropathic pain (Gardoni et al. 2009).
A consistent tendency for upregulated gene expression among primates was observed in SLC17A7, GRIN2B, CAMK2a, GRIA4, and CNTNAP2 (although there are no significant changes in CNTNAP2 for pairwise contrasts between phylogenetic groups). This group of genes was mainly responsible for the loadings of PC2, which separated humans and chimpanzees from other primates (Fig. 1 and Supplementary Fig. 2). It is noteworthy that 4 of these genes are related to glutamatergic neurotransmitter release and long-term potentiation (LTP) in the brain. Both GRIN2B and GRIA4 are considered members of the ionotropic glutamate receptor family, and they play a role in the modulation of synaptic plasticity (Carvalho et al. 1999; Tang et al. 1999; Traynelis et al. 2010), a property of the brain thought to be critical for memory and learning. CAMK2a is a prominent kinase in the central nervous system that may function in LTP and neurotransmitter release and is vital for several aspects of plasticity at glutamatergic synapses (Lisman et al. 2012). Increased expression of CAMK2a in the cerebral cortex of humans compared with chimpanzees and rhesus monkeys was described in a previous study (Cáceres et al. 2003). Finally, SLC17A7 is a vesicular glutamate transporter bounded to membranes of synaptic vesicles and it is involved in the storage of glutamate as well in its biogenesis and recycling (Santos et al. 2009). One major feature of LTP is the requirement of activation of NMDA receptors, which has been hypothesized to be the molecular pathway underlying cognitive learning (Morris et al. 1986). This is exemplified by the fact that mice with increased expression of GRIN2B receptors have enhanced memory and synaptic transmission (Tang et al. 1999; Brim et al. 2013). Congruent with our data demonstrating that significant changes in glutamate processing occurred at the branch of hominids (i.e., great apes and humans) from other primates, it has been shown that, GLUD2, a gene encoding glutamate dehydrogenase (GDH) which is activated in response to high neurotransmitter flux, underwent positive selection after originating from a duplication event in a stem great ape ancestor ∼23 million years ago (Burki and Kaessmann 2004).
One particular MAGUK that may influence GRIN2B expression levels is CASK. Translocation of CASK to the nucleus has been reported to downregulate the expression of GRIN2B (Zheng et al. 2011). This is consistent with the results obtained in the current study; humans have a statistically significant decrease in CASK levels (Supplementary Fig. 2), although we report an increase in levels of GRIN2B in the human lineage. GRIN2B has been reported to elevate mobility in contrast to GRIN2A, which is more stable at synapses (Zheng et al. 2011). Future research may help to discern whether the increase observed in GRIN2B is associated with synaptic or extrasynaptic localization. Accordingly, the 5′-flanking region showed evidence of positive selection for GRIN2B and CAMK2A in the internal branch leading to human and chimpanzee (Table 2) after correction for multiple analyses. Notably, luciferase reporter assays in cell culture lines have demonstrated that changes in 5′ upstream promoter regions can trigger GRIN2B and CAMK2a transcriptional activity by affecting binding of transcription factors (Mima et al. 2001; Jiang and Jia 2009). As the function of many biological processes are driven by proteins, the confirmation of these changes at the protein level supports the conclusion that gene regulation, especially among the reported candidates in glutamatergic pathways, is one of the critical steps in the production of the phenotypic differences in PFC that have emerged in primate evolution.
Last, CNTNAP2 encodes a neuronal transmembrane protein member of the neurexin superfamily involved in neuron-glia interactions (also known as Caspr2), described to be involved in some autism spectrum disorders as well as in patients with specific language impairment (Alarcón et al. 2008; Arking et al. 2008; Vernes et al. 2008). We found an increase of CNTNAP2 mRNA levels in the lineage leading to chimpanzees and humans (Fig. 2). This points towards a potentially interesting evolutionary change because CNTNAP2 has been described to be a target of FOXP2, and to be regulated by its expression (Vernes et al. 2008). FOXP2 has been largely studied because of its relation with language and speech evolution in humans (Enard, Przeworski, et al. 2002), moreover functional studies in mice and songbirds indicate that FOXP2 may modulate synaptic plasticity in neurons of the striatum (Enard 2011).
In conclusion, the results of this study provide a broad comparative perspective on the evolution of molecular pathways that are likely associated with increased capability of learning and memory in primates, particularly hominids (Rumbaugh and Gill 1973). We observe that adaptive changes target mainly genes involved in the glutamate signaling pathway coinciding with increased brain size (Burki and Kaessmann 2004). This suggests that an overall upregulation in neural activity through excitatory mechanisms may have coevolved with greater cognitive capacities across primates. Further comparative studies of the expression of genes encoding other glutamate receptor subunits are required to determine whether molecules in the whole pathway experience correlated evolution, or whether particular elements demonstrate stronger evidence of positive selection. Finally, these findings may provide insight into the evolution of vulnerability to neurodegenerative disorders (Dong et al. 2009; Gardoni et al. 2009; Perez et al. 2013), which are unique in humans, as some of these diseases target excitatory pathways or their downstream signaling pathways.
Supplementary Material
Supplementary material can be found at: http://www.cercor.oxfordjournals.org/.
Funding
This work was supported by the National Science Foundation (grant BCS-0827531); National Institutes of Health (grant NS-042867); and the James S. McDonnell Foundation (grants 22002078 and 220020293).
Supplementary Material
Notes
The authors thank Dr Thomas Maynard for assistance with qPCR, Jennifer Baker and Dr Tanya Duka for general advice and technical support and Amy Bauernfeind for generously providing the macaque tissue used in this study. Conflict of Interest: None declared.
References
- Alarcón M, Abrahams BS, Stone JL, Duvall JA, Perederiy JV, Bomar JM, Sebat J, Wigler M, Martin CL, Ledbetter DH, et al. 2008. Linkage, association, and gene-expression analyses identify CNTNAP2 as an autism-susceptibility gene. Am J Hum Genet. 82:150–159. 10.1016/j.ajhg.2007.09.005 [DOI] [PMC free article] [PubMed] [Google Scholar]
- Arking DE, Cutler DJ, Brune CW, Teslovich TM, West K, Ikeda M, Rea A, Guy M, Lin S, Cook EH, Jr, et al. 2008. A common genetic variant in the neurexin superfamily member CNTNAP2 increases familial risk of autism. Am J Hum Genet. 82:160–164. 10.1016/j.ajhg.2007.09.015 [DOI] [PMC free article] [PubMed] [Google Scholar]
- Arnold C, Matthews LJ, Nunn CL. 2010. The 10kTrees website: a new online resource for primate phylogeny. Evol Anthropol Issues News Rev. 19:114–118. 10.1002/evan.20251 [DOI] [Google Scholar]
- Barrett LW, Fletcher S, Wilton SD. 2012. Regulation of eukaryotic gene expression by the untranslated gene regions and other non-coding elements. Cell Mol Life Sci. 69:3613–3634. 10.1007/s00018-012-0990-9 [DOI] [PMC free article] [PubMed] [Google Scholar]
- Bayés A, Collins MO, Croning MDR, van de Lagemaat LN, Choudhary JS, Grant SGN. 2012. Comparative study of human and mouse postsynaptic proteomes finds high compositional conservation and abundance differences for key synaptic proteins. PloS One. 7:e46683 10.1371/journal.pone.0046683 [DOI] [PMC free article] [PubMed] [Google Scholar]
- Bayés A, Grant SGN. 2009. Neuroproteomics: understanding the molecular organization and complexity of the brain. Nat Rev Neurosci. 10:635–646. 10.1038/nrn2701 [DOI] [PubMed] [Google Scholar]
- Bianchi S, Stimpson CD, Bauernfeind AL, Schapiro SJ, Baze WB, McArthur MJ, Bronson E, Hopkins WD, Semendeferi K, Jacobs B, et al. 2013. Dendritic morphology of pyramidal neurons in the chimpanzee neocortex: regional specializations and comparison to humans. Cereb Cortex. 23:2429–2436. [DOI] [PMC free article] [PubMed] [Google Scholar]
- Blanchette M, Bataille AR, Chen X, Poitras C, Laganière J, Lefèbvre C, Deblois G, Giguère V, Ferretti V, Bergeron D, et al. 2006. Genome-wide computational prediction of transcriptional regulatory modules reveals new insights into human gene expression. Genome Res. 16:656–668. 10.1101/gr.4866006 [DOI] [PMC free article] [PubMed] [Google Scholar]
- Boddy AM, McGOWEN MR, Sherwood CC, Grossman LI, Goodman M, Wildman DE. 2012. Comparative analysis of encephalization in mammals reveals relaxed constraints on anthropoid primate and cetacean brain scaling. J Evol Biol. 25:981–994. 10.1111/j.1420-9101.2012.02491.x [DOI] [PubMed] [Google Scholar]
- Brawand D, Soumillon M, Necsulea A, Julien P, Csárdi G, Harrigan P, Weier M, Liechti A, Aximu-Petri A, Kircher M, et al. 2011. The evolution of gene expression levels in mammalian organs. Nature. 478:343–348. 10.1038/nature10532 [DOI] [PubMed] [Google Scholar]
- Brim BL, Haskell R, Awedikian R, Ellinwood NM, Jin L, Kumar A, Foster TC, Magnusson KR. 2013. Memory in aged mice is rescued by enhanced expression of the GluN2B subunit of the NMDA receptor. Behav Brain Res. 238:211–226. 10.1016/j.bbr.2012.10.026 [DOI] [PMC free article] [PubMed] [Google Scholar]
- Brodmann K. 1909. Vergleichende Lokalisationslehre der Großhirnrinde. Leipzig: Barth. [Google Scholar]
- Burki F, Kaessmann H. 2004. Birth and adaptive evolution of a hominoid gene that supports high neurotransmitter flux. Nat Genet. 36:1061–1063. 10.1038/ng1431 [DOI] [PubMed] [Google Scholar]
- Burman KJ, Palmer SM, Gamberini M, Rosa MGP. 2006. Cytoarchitectonic subdivisions of the dorsolateral frontal cortex of the marmoset monkey (Callithrix jacchus), and their projections to dorsal visual areas. J Comp Neurol. 495:149–172. 10.1002/cne.20837 [DOI] [PubMed] [Google Scholar]
- Cáceres M, Lachuer J, Zapala MA, Redmond JC, Kudo L, Geschwind DH, Lockhart DJ, Preuss TM, Barlow C. 2003. Elevated gene expression levels distinguish human from non-human primate brains. Proc Natl Acad Sci USA. 100:13030–13035. 10.1073/pnas.2135499100 [DOI] [PMC free article] [PubMed] [Google Scholar]
- Cáceres M, Suwyn C, Maddox M, Thomas JW, Preuss TM. 2007. Increased cortical expression of two synaptogenic thrombospondins in human brain evolution. Cereb Cortex. 17:2312–2321. 10.1093/cercor/bhl140 [DOI] [PubMed] [Google Scholar]
- Cain CE, Blekhman R, Marioni JC, Gilad Y. 2011. Gene expression differences among primates are associated with changes in a histone epigenetic modification. Genetics. 187:1225–1234. 10.1534/genetics.110.126177 [DOI] [PMC free article] [PubMed] [Google Scholar]
- Carroll SB. 2003. Genetics and the making of Homo sapiens. Nature. 422:849–857. 10.1038/nature01495 [DOI] [PubMed] [Google Scholar]
- Carvalho AL, Kameyama K, Huganir RL. 1999. Characterization of phosphorylation sites on the glutamate receptor 4 subunit of the AMPA receptors. J Neurosci Off J Soc Neurosci. 19:4748–4754. [DOI] [PMC free article] [PubMed] [Google Scholar]
- Colantuoni C, Lipska BK, Ye T, Hyde TM, Tao R, Leek JT, Colantuoni EA, Elkahloun AG, Herman MM, Weinberger DR, et al. 2011. Temporal dynamics and genetic control of transcription in the human prefrontal cortex. Nature. 478:519–523. 10.1038/nature10524 [DOI] [PMC free article] [PubMed] [Google Scholar]
- Consortium TCS and A. 2005. Initial sequence of the chimpanzee genome and comparison with the human genome. Nature. 437:69–87. 10.1038/nature04072 [DOI] [PubMed] [Google Scholar]
- Cruz-Gordillo P, Fedrigo O, Wray GA, Babbitt CC. 2010. Extensive changes in the expression of the opioid genes between humans and chimpanzees. Brain Behav Evol. 76:154–162. 10.1159/000320968 [DOI] [PubMed] [Google Scholar]
- Cruz-Rizzolo RJ, De Lima MAX, Ervolino E, de Oliveira JA, Casatti CA. 2011. Cyto-, myelo- and chemoarchitecture of the prefrontal cortex of the Cebus monkey. BMC Neurosci. 12:6 10.1186/1471-2202-12-6 [DOI] [PMC free article] [PubMed] [Google Scholar]
- Dong X, Wang Y, Qin Z. 2009. Molecular mechanisms of excitotoxicity and their relevance to pathogenesis of neurodegenerative diseases. Acta Pharmacol Sin. 30:379–387. 10.1038/aps.2009.24 [DOI] [PMC free article] [PubMed] [Google Scholar]
- Ebersberger I, Metzler D, Schwarz C, Pääbo S. 2002. Genomewide comparison of DNA sequences between humans and chimpanzees. Am J Hum Genet. 70:1490–1497. 10.1086/340787 [DOI] [PMC free article] [PubMed] [Google Scholar]
- Elston GN. 2000. Pyramidal cells of the frontal lobe: all the more spinous to think with. J Neurosci. 20:RC95–RC95. [DOI] [PMC free article] [PubMed] [Google Scholar]
- Elston GN, Benavides-Piccione R, DeFelipe J. 2001. The pyramidal cell in cognition: a comparative study in human and monkey. J Neurosci. 21:RC163–RC163. [DOI] [PMC free article] [PubMed] [Google Scholar]
- Emes RD, Grant SGN. 2012. Evolution of synapse complexity and diversity. Annu Rev Neurosci. 35:111–131. 10.1146/annurev-neuro-062111-150433 [DOI] [PubMed] [Google Scholar]
- Enard W. 2011. FOXP2 and the role of cortico-basal ganglia circuits in speech and language evolution. Curr Opin Neurobiol. 21:415–424. 10.1016/j.conb.2011.04.008 [DOI] [PubMed] [Google Scholar]
- Enard W, Khaitovich P, Klose J, Zöllner S, Heissig F, Giavalisco P, Nieselt-Struwe K, Muchmore E, Varki A, Ravid R, et al. 2002. Intra- and interspecific variation in primate gene expression patterns. Science. 296:340–343. 10.1126/science.1068996 [DOI] [PubMed] [Google Scholar]
- Enard W, Przeworski M, Fisher SE, Lai CSL, Wiebe V, Kitano T, Monaco AP, Pääbo S. 2002. Molecular evolution of FOXP2, a gene involved in speech and language. Nature. 418:869–872. 10.1038/nature01025 [DOI] [PubMed] [Google Scholar]
- Fedrigo O, Pfefferle AD, Babbitt CC, Haygood R, Wall CE, Wray GA. 2011. A potential role for glucose transporters in the evolution of human brain size. Brain Behav Evol. 78:315–326. [DOI] [PMC free article] [PubMed] [Google Scholar]
- Fedrigo O, Warner LR, Pfefferle AD, Babbitt CC, Cruz-Gordillo P, Wray GA. 2010. A pipeline to determine RT-QPCR control genes for evolutionary studies: application to primate gene expression across multiple tissues. PLoS ONE. 5:e12545 10.1371/journal.pone.0012545 [DOI] [PMC free article] [PubMed] [Google Scholar]
- Finlay BL, Darlington RB. 1995. Linked regularities in the development and evolution of mammalian brains. Science. 268:1578–1584. 10.1126/science.7777856 [DOI] [PubMed] [Google Scholar]
- Fleige S, Pfaffl MW. 2006. RNA integrity and the effect on the real-time qRT-PCR performance. Mol Aspects Med. 27:126–139. 10.1016/j.mam.2005.12.003 [DOI] [PubMed] [Google Scholar]
- Fu X, Giavalisco P, Liu X, Catchpole G, Fu N, Ning Z-B, Guo S, Yan Z, Somel M, Pääbo S, et al. 2011. Rapid metabolic evolution in human prefrontal cortex. Proc Natl Acad Sci. 108:6181–6186. 10.1073/pnas.1019164108 [DOI] [PMC free article] [PubMed] [Google Scholar]
- Funke L, Dakoji S, Bredt DS. 2005. Membrane-associated guanylate kinases regulate adhesion and plasticity at cell junctions. Annu Rev Biochem. 74:219–245. 10.1146/annurev.biochem.74.082803.133339 [DOI] [PubMed] [Google Scholar]
- Gardoni F, Marcello E, Di Luca M. 2009. Postsynaptic density-membrane associated guanylate kinase proteins (PSD-MAGUKs) and their role in CNS disorders. Neuroscience. 158:324–333. 10.1016/j.neuroscience.2008.07.068 [DOI] [PubMed] [Google Scholar]
- Giagtzoglou N, Ly CV, Bellen HJ. 2009. Cell adhesion, the backbone of the synapse: “vertebrate” and “invertebrate” perspectives. Cold Spring Harb Perspect Biol. 1:a003079. [DOI] [PMC free article] [PubMed] [Google Scholar]
- Gilad Y, Oshlack A, Rifkin SA. 2006. Natural selection on gene expression. Trends Genet. 22:456–461. 10.1016/j.tig.2006.06.002 [DOI] [PubMed] [Google Scholar]
- Gilad Y, Oshlack A, Smyth GK, Speed TP, White KP. 2006. Expression profiling in primates reveals a rapid evolution of human transcription factors. Nature. 440:242–245. 10.1038/nature04559 [DOI] [PubMed] [Google Scholar]
- Gu J, Gu X. 2003. Induced gene expression in human brain after the split from chimpanzee. Trends Genet. 19:63–65. 10.1016/S0168-9525(02)00040-9 [DOI] [PubMed] [Google Scholar]
- Harrison PW, Wright AE, Mank JE. 2012. The evolution of gene expression and the transcriptome–phenotype relationship. Semin Cell Dev Biol. 23:222–229. 10.1016/j.semcdb.2011.12.004 [DOI] [PMC free article] [PubMed] [Google Scholar]
- Haygood R, Fedrigo O, Hanson B, Yokoyama K-D, Wray GA. 2007. Promoter regions of many neural- and nutrition-related genes have experienced positive selection during human evolution. Nat Genet. 39:1140–1144. 10.1038/ng2104 [DOI] [PubMed] [Google Scholar]
- Hellmann I, Zöllner S, Enard W, Ebersberger I, Nickel B, Pääbo S. 2003. Selection on human genes as revealed by comparisons to chimpanzee cDNA. Genome Res. 13:831–837. 10.1101/gr.944903 [DOI] [PMC free article] [PubMed] [Google Scholar]
- Heuer E, Rosen RF, Cintron A, Walker LC. 2012. Nonhuman primate models of Alzheimer-like cerebral proteopathy. Curr Pharm Des. 18:1159–1169. 10.2174/138161212799315885 [DOI] [PMC free article] [PubMed] [Google Scholar]
- Hof PR, Gilissen EP, Sherwood CC, Duan H, Lee PWH, Delman BN, Naidich TP, Gannon PJ, Perl DP, Erwin JM. 2002. Comparative Neuropathology of Brain Aging in Primates. In: Erwin JM, Hof PR, editors. Interdisciplinary Topics in Gerontology. Basel: Karger; pp. 130–154. [Google Scholar]
- Huttenlocher PR. 1979. Synaptic density in human frontal cortex—developmental changes and effects of aging. Brain Res. 163:195–205. 10.1016/0006-8993(79)90349-4 [DOI] [PubMed] [Google Scholar]
- Jacobs B, Schall M, Prather M, Kapler E, Driscoll L, Baca S, Jacobs J, Ford K, Wainwright M, Treml M. 2001. Regional dendritic and spine variation in human cerebral cortex: a quantitative golgi study. Cereb Cortex. 11:558–571. [DOI] [PubMed] [Google Scholar]
- Jayakar SS, Dikshit M. 2004. AMPA receptor regulation mechanisms: future target for safer neuroprotective drugs. Int J Neurosci. 114:695–734. 10.1080/00207450490430453 [DOI] [PubMed] [Google Scholar]
- Jerison. 1975. Evolution of the brain and intelligence. Curr Anthropol. 16:403–426. 10.1086/201571 [DOI] [Google Scholar]
- Jiang H, Jia J. 2009. Association between NR2B subunit gene (GRIN2B) promoter polymorphisms and sporadic Alzheimer's disease in the North Chinese population. Neurosci Lett. 450:356–360. 10.1016/j.neulet.2008.10.075 [DOI] [PubMed] [Google Scholar]
- Johnson RD, Oliver PL, Davies KE. 2008. SNARE proteins and schizophrenia: linking synaptic and neurodevelopmental hypotheses. Acta Biochim Pol. 55:619–628. [PubMed] [Google Scholar]
- Jucker M. 2010. The benefits and limitations of animal models for translational research in neurodegenerative diseases. Nat Med. 16:1210–1214. 10.1038/nm.2224 [DOI] [PubMed] [Google Scholar]
- Kelker MS, Dancheck B, Ju T, Kessler RP, Hudak J, Nairn AC, Peti W. 2007. Structural basis for Spinophilin−Neurabin receptor interaction. Biochemistry (Mosc). 46:2333–2344. 10.1021/bi602341c [DOI] [PubMed] [Google Scholar]
- Khaitovich P, Muetzel B, She X, Lachmann M, Hellmann I, Dietzsch J, Steigele S, Do H-H, Weiss G, Enard W, et al. 2004. Regional patterns of gene expression in human and chimpanzee brains. Genome Res. 14:1462–1473. 10.1101/gr.2538704 [DOI] [PMC free article] [PubMed] [Google Scholar]
- Kim E, Sheng M. 2004. PDZ domain proteins of synapses. Nat Rev Neurosci. 5:771–781. 10.1038/nrn1517 [DOI] [PubMed] [Google Scholar]
- King MC, Wilson AC. 1975. Evolution at two levels in humans and chimpanzees. Science. 188:107–116. 10.1126/science.1090005 [DOI] [PubMed] [Google Scholar]
- Klingenberg CP, Gidaszewski NA. 2010. Testing and quantifying phylogenetic signals and homoplasy in morphometric data. Syst Biol. 59:245–261. 10.1093/sysbio/syp106 [DOI] [PubMed] [Google Scholar]
- Konopka G, Friedrich T, Davis-Turak J, Winden K, Oldham MC, Gao F, Chen L, Wang G-Z, Luo R, Preuss TM, et al. 2012. Human-specific transcriptional networks in the brain. Neuron. 75:601–617. 10.1016/j.neuron.2012.05.034 [DOI] [PMC free article] [PubMed] [Google Scholar]
- Lisman J, Yasuda R, Raghavachari S. 2012. Mechanisms of CaMKII action in long-term potentiation. Nat Rev Neurosci. 13:169–182. [DOI] [PMC free article] [PubMed] [Google Scholar]
- Lu J, Helton TD, Blanpied TA, Rácz B, Newpher TM, Weinberg RJ, Ehlers MD. 2007. Postsynaptic positioning of endocytic zones and AMPA receptor cycling by physical coupling of Dynamin-3 to homer. Neuron. 55:874–889. 10.1016/j.neuron.2007.06.041 [DOI] [PMC free article] [PubMed] [Google Scholar]
- Mazumder B, Seshadri V, Fox PL. 2003. Translational control by the 3′-UTR: the ends specify the means. Trends Biochem Sci. 28:91–98. 10.1016/S0968-0004(03)00002-1 [DOI] [PubMed] [Google Scholar]
- Mima K, Deguchi S, Yamauchi T. 2001. Characterization of 5′ flanking region of α isoform of rat Ca2+/calmodulin-dependent protein kinase II gene and neuronal cell type specific promoter activity. Neurosci Lett. 307:117–121. 10.1016/S0304-3940(01)01941-3 [DOI] [PubMed] [Google Scholar]
- Misra J, Schmitt W, Hwang D, Hsiao LL, Gullans S, Stephanopoulos G, Stephanopoulos G. 2002. Interactive exploration of microarray gene expression patterns in a reduced dimensional space. Genome Res. 127:1112–1120. [DOI] [PMC free article] [PubMed] [Google Scholar]
- Morris RG, Anderson E, Lynch GS, Baudry M. 1986. Selective impairment of learning and blockade of long-term potentiation by an N-methyl-D-aspartate receptor antagonist, AP5. Nature. 319:774–776. 10.1038/319774a0 [DOI] [PubMed] [Google Scholar]
- National Research Council (US) Committee for the Update of the Guide for the Care and Use of Laboratory Animals. 2011. Guide for the Care and Use of Laboratory Animals. 8th edn The National Academies Collection: Reports funded by National Institutes of Health Washington (DC): National Academies Press (US). [PubMed] [Google Scholar]
- Nowick K, Gernat T, Almaas E, Stubbs L. 2009. Differences in human and chimpanzee gene expression patterns define an evolving network of transcription factors in brain. Proc Natl Acad Sci USA. 106:22358–22363. 10.1073/pnas.0911376106 [DOI] [PMC free article] [PubMed] [Google Scholar]
- Oliva C, Escobedo P, Astorga C, Molina C, Sierralta J. 2012. Role of the maguk protein family in synapse formation and function. Dev Neurobiol. 72:57–72. 10.1002/dneu.20949 [DOI] [PubMed] [Google Scholar]
- Pagel M. 1999. Inferring the historical patterns of biological evolution. Nature. 401:877–884. 10.1038/44766 [DOI] [PubMed] [Google Scholar]
- Paradis E, Claude J, Strimmer K. 2004. APE: analyses of phylogenetics and evolution in R language. Bioinformatics. 20:289–290. 10.1093/bioinformatics/btg412 [DOI] [PubMed] [Google Scholar]
- Perez SE, Raghanti MA, Hof PR, Kramer L, Ikonomovic MD, Lacor PN, Erwin JM, Sherwood CC, Mufson EJ. 2013. Alzheimer's disease pathology in the neocortex and hippocampus of the western lowland gorilla (Gorilla gorilla gorilla). J Comp Neurol. 521:4318–4338. [DOI] [PMC free article] [PubMed] [Google Scholar]
- Perry GH, Melsted P, Marioni JC, Wang Y, Bainer R, Pickrell JK, Michelini K, Zehr S, Yoder AD, Stephens M, et al. 2012. Comparative RNA sequencing reveals substantial genetic variation in endangered primates. Genome Res. 22:602–610. 10.1101/gr.130468.111 [DOI] [PMC free article] [PubMed] [Google Scholar]
- Pond SLK, Frost SDW, Muse SV. 2005. HyPhy: hypothesis testing using phylogenies. Bioinformatics. 21:676–679. 10.1093/bioinformatics/bti079 [DOI] [PubMed] [Google Scholar]
- Preuss TM, Goldman-Rakic PS. 1991. Myelo- and cytoarchitecture of the granular frontal cortex and surrounding regions in the strepsirhine primate Galago and the anthropoid primate Macaca. J Comp Neurol. 310:429–474. 10.1002/cne.903100402 [DOI] [PubMed] [Google Scholar]
- R Core Team 2013. R: A language and environment for statistical computing. R Foundation for Statistical Computing, Vienna, Austria: ISBN 3-900051-07-0, URL Available from: URL http://www.R-project.org/. [Google Scholar]
- Revell LJ, Harmon LJ, Collar DC. 2008. Phylogenetic signal, evolutionary process, and rate. Syst Biol. 57:591–601. 10.1080/10635150802302427 [DOI] [PubMed] [Google Scholar]
- Ringnér M. 2008. What is principal component analysis? Nat Biotechnol. 26:303–304. 10.1038/nbt0308-303 [DOI] [PubMed] [Google Scholar]
- Rumbaugh DM, Gill TV. 1973. The learning skills of great apes. J Hum Evol. 2:171–179. 10.1016/0047-2484(73)90073-0 [DOI] [Google Scholar]
- Santos MS, Li H, Voglmaier SM. 2009. Synaptic vesicle protein trafficking at the glutamate synapse. Neuroscience. 158:189–203. 10.1016/j.neuroscience.2008.03.029 [DOI] [PMC free article] [PubMed] [Google Scholar]
- Semendeferi K, Armstrong E, Schleicher A, Zilles K, Van Hoesen GW. 2001. Prefrontal cortex in humans and apes: a comparative study of area 10. Am J Phys Anthropol. 114:224–241. 10.1002/1096-8644(200103)114:3<224::AID-AJPA1022>3.0.CO;2-I [DOI] [PubMed] [Google Scholar]
- Semendeferi K, Teffer K, Buxhoeveden DP, Park MS, Bludau S, Amunts K, Travis K, Buckwalter J. 2011. Spatial organization of neurons in the frontal pole sets humans apart from great apes. Cereb Cortex. 21:1485–1497. [DOI] [PubMed] [Google Scholar]
- Smaers JB, Schleicher A, Zilles K, Vinicius L. 2010. Frontal white matter volume is associated with brain enlargement and higher structural connectivity in anthropoid primates. PLoS ONE. 5:e9123 10.1371/journal.pone.0009123 [DOI] [PMC free article] [PubMed] [Google Scholar]
- Somel M, Franz H, Yan Z, Lorenc A, Guo S, Giger T, Kelso J, Nickel B, Dannemann M, Bahn S, et al. 2009. Transcriptional neoteny in the human brain. Proc Natl Acad Sci USA. 106:5743–5748. 10.1073/pnas.0900544106 [DOI] [PMC free article] [PubMed] [Google Scholar]
- Spocter MA, Hopkins WD, Barks SK, Bianchi S, Hehmeyer AE, Anderson SM, Stimpson CD, Fobbs AJ, Hof PR, Sherwood CC. 2012. Neuropil distribution in the cerebral cortex differs between humans and chimpanzees. J Comp Neurol. 520:2917–2929. 10.1002/cne.23074 [DOI] [PMC free article] [PubMed] [Google Scholar]
- Tang Y-P, Shimizu E, Dube GR, Rampon C, Kerchner GA, Zhuo M, Liu G, Tsien JZ. 1999. Genetic enhancement of learning and memory in mice. Nature. 401:63–69. 10.1038/43432 [DOI] [PubMed] [Google Scholar]
- Traynelis SF, Wollmuth LP, McBain CJ, Menniti FS, Vance KM, Ogden KK, Hansen KB, Yuan H, Myers SJ, Dingledine R. 2010. Glutamate receptor ion channels: structure, regulation, and function. Pharmacol Rev. 62:405–496. 10.1124/pr.109.002451 [DOI] [PMC free article] [PubMed] [Google Scholar]
- Uddin M, Wildman DE, Liu G, Xu W, Johnson RM, Hof PR, Kapatos G, Grossman LI, Goodman M. 2004. Sister grouping of chimpanzees and humans as revealed by genome-wide phylogenetic analysis of brain gene expression profiles. Proc Natl Acad Sci USA. 101:2957–2962. 10.1073/pnas.0308725100 [DOI] [PMC free article] [PubMed] [Google Scholar]
- Varki A, Altheide TK. 2005. Comparing the human and chimpanzee genomes: searching for needles in a haystack. Genome Res. 12:1746–1758. 10.1101/gr.3737405 [DOI] [PubMed] [Google Scholar]
- Vernes SC, Newbury DF, Abrahams BS, Winchester L, Nicod J, Groszer M, Alarcón M, Oliver PL, Davies KE, Geschwind DH, et al. 2008. A Functional genetic link between distinct developmental language disorders. N Engl J Med. 359:2337–2345. 10.1056/NEJMoa0802828 [DOI] [PMC free article] [PubMed] [Google Scholar]
- Wildman DE, Uddin M, Liu G, Grossman LI, Goodman M. 2003. Implications of natural selection in shaping 99.4% nonsynonymous DNA identity between humans and chimpanzees: enlarging genus Homo. Proc Natl Acad Sci. 100:7181–7188. 10.1073/pnas.1232172100 [DOI] [PMC free article] [PubMed] [Google Scholar]
- Wray GA, Hahn MW, Abouheif E, Balhoff JP, Pizer M, Rockman MV, Romano LA. 2003. The evolution of transcriptional regulation in eukaryotes. Mol Biol Evol. 20:1377–1419. 10.1093/molbev/msg140 [DOI] [PubMed] [Google Scholar]
- Zhang J, Nielsen R, Yang Z. 2005. Evaluation of an improved branch-site likelihood method for detecting positive selection at the molecular level. Mol Biol Evol. 22:2472–2479. 10.1093/molbev/msi237 [DOI] [PubMed] [Google Scholar]
- Zheng C-Y, Seabold GK, Horak M, Petralia RS. 2011. MAGUKs, synaptic development, and synaptic plasticity. Neuroscientist. 17:493–512. [DOI] [PMC free article] [PubMed] [Google Scholar]
Associated Data
This section collects any data citations, data availability statements, or supplementary materials included in this article.