

Abstract
The rat globus pallidus (GP) is homologous to the primate GP externus. Studies with injectable anesthetics suggest that GP neurons can be classified into Type-I and Type-II cells based on extracellularly recorded spike shape, or positively coupled (PC), negatively coupled (NC), and uncoupled (UC) cells based on functional connectivity with the cortex. In this study, we examined the electrophysiology of rat GP neurons using the inhalational anesthetic isoflurane which offers more constant and easily regulated levels of anesthesia than injectable anesthetics. In 130 GP neurons recorded using small-tip glass electrodes (<1 μm), all but one fired Type-II spikes (positive/negative waveform). Type-I cells were unlikely to be inhibited by isoflurane since all GP neurons also fired Type-II spikes under ketamine-induced anesthesia. When recorded with large-tip electrodes (~2 μm), however, over 70% of GP neurons exhibited Type-I spikes (negative/positive waveform). These results suggest that the spike shape, recorded extracellularly, varies depending on the electrode used and is not reliable in distinguishing Type-I and Type-II neurons. Using dual-site recording, 40% of GP neurons were identified as PC cells, 17.5% NC cells, and 42.5% UC cells. The three subtypes also differed significantly in firing rate and pattern. Lesions of dopamine neurons increased the number of NC cells, decreased that of UC cells, and significantly shifted the phase relationship between PC cells and the cortex. These results support the presence of GP neuron subtypes and suggest that each subtype plays a different role in the pathophysiology of Parkinson’s disease.
Keywords: 6-Hydroxydopamine, Action Potential Shape, Firing Pattern, Functional Connectivity, Isoflurane, Parkinson’s Disease
Introduction
The rat globus pallidus (GP) is homologous to the human external GP. Based on the shape of the extracellularly recorded action potential (spike), two types of GP neurons have been reported, Type-I and Type-II (Kelland et al., 1995; Napier et al., 1991). Spikes in Type-I neurons have a negative initial phase, whereas those in Type-II cells have a positive initial phase. The two types were found to be in equal abundance under ketamine anesthesia, though Type-I neurons had a faster axonal conduction velocity than Type-II cells and were inhibited, instead of being excited, by the dopamine (DA) receptor agonist apomorphine (Kelland et al., 1995). Studies show that GP neurons can also be classified based on their functional connectivity to the cortex. Positively coupled (PC) or Type-Active neurons fire during the up states of cortical slow oscillation, whereas negatively coupled (NC) or Type-Inactive cells fire during the down states of the slow oscillation (Magill et al., 2000; Mallet et al., 2008; Zold et al., 2007). Neurons whose firing shows no correlation with cortical activity are referred to as uncoupled cells (UC). Studies in rats lesioned with 6-hydroxydopamine (6-OHDA) suggest that NC and PC neurons also differ in anatomical connectivity (Mallet et al., 2012). NC cells innervate primarily downstream basal ganglia nuclei such as the subthalamic nucleus, while PC cells project heavily back to the striatum.
In this study, we asked whether GP neurons in isoflurane-anesthetized rats can be similarly classified. As an inhalational anesthetic, isoflurane provides more constant and easily regulated levels of anesthesia than injectable anesthetics used in previous studies. We further asked whether subtypes of GP neurons differ in other properties including firing rate, firing pattern, and response to DA depletion induced by 6-OHDA.
Methods
All procedures were performed in accordance with protocols approved by the Institutional Animal Care and Use Committee and in compliance with National Institutes of Health Guide for the Care and Use of Laboratory Animals. Male Sprague-Dawley rats (Harlan, Indianapolis, IN), weighing between 250 and 400g, were used. Unless otherwise noted, all drugs were purchased from Sigma-Aldrich (St. Louis, MO).
Electrophysiology
Rats were anesthetized with isoflurane (Butler Schein Animal health, Dublin, OH, 3.0% for surgery, maintained at 1.5%, delivered in oxygen). GP neurons were recorded extracellularly using techniques described previously (Gao et al., 2007; Shi, 2005; Shi et al., 2004). Briefly, glass electrodes (WPI, Sarasota, FL) were pulled using a PE-2 puller (Narishige, Long Island, NY) and filled with 0.5 M NaAc and 1% pontamine sky blue (Bio/Medical Specialties, Santa Monica, CA), providing an impedance of about 30 MΩ (measured in vitro using 100 Hz 1 nA sine wave current). For some recordings, the electrode tip was broken back to about 2 μm and filled with 2 M NaCl or 0.5 M NaAc, providing an impedance of approximately 2.5 and 9.5 MΩ, respectively. In most experiments, GP neurons were recorded using the cells-per-track technique, in which the electrode was passed systematically 9 times through a stereotaxically defined block in the GP (P 0.8-1.2, L 2.6-3.0, V 5.0-7.0 mm from bregma, Paxinos and Watson, 1998). Each track was separated by 200 μm. The number of spontaneously active cells per track was determined based on cells that provided at least 2 minutes of stable recordings. In spike shape analysis, some cells were recorded by lowing the electrode into one or two tracks in the GP. To study the functional connectivity of GP neurons, cortical activity, measured by local field potentials (LFPs), was simultaneously recorded in a subset of animals with an additional electrode inserted into the motor cortex (M1: A 2.0, L 3.0, V 2.0 mm from bregma). Signals were amplified by a CyberAmp 380 (Molecular Devices, Sunnyvale, CA) and fed into two bandpass filters, one for spike recording (0.3-2 kHz) and the other for LFP recording (0.1-100 Hz). Body temperature was maintained at 37±0.5°C with a homeothermic blanket system (Harvard Apparatus Inc., Holliston, MA). Following each recording session, the recording site was marked by electrophoretic ejection of pontamine sky blue through the microelectrode (−20 μA, 10 min) and verified using standard histological techniques (Godfraind, 1969; Hellon, 1971).
6-Hydroxydopamine injections
In some animals, DA neurons were lesioned by 6-hydroxydopamine (6-OHDA, 8 μg/4 μl) injected into the right medial forebrain bundle (P 4.4, L 1.2, V 7.8 mm from bregma). Thirty minutes prior to the injection, animals were pretreated with desipramine (12.5 mg/kg, i.p., Bio Trend, Destin, FL) to protect noradrenergic neurons. Two to three weeks post-lesion, apomorphine (50 μg/kg) was injected subcutaneously, and the number of contralateral rotations counted for 30 minutes. Only animals exhibiting four or more turns per minute were included as lesioned animals. Lesions were further confirmed by immunostaining for tyrosine hydroxylase.
Data Analysis
All analyses were performed using Clampfit 10 (Molecular Devices) and in-house VBA subroutines in Excel (Microsoft, Redmond, WA). Firing rate and pattern were analyzed based on a 2-min stable recording selected from each cell. The firing variability was estimated by the CV2 of interspike intervals (Holt et al., 1996; Taube, 2010). Bursts were detected by the Poisson surprise method (Legendy and Salcman, 1985). An epoch of elevated firing was identified as a burst if it included at least three spikes and had a surprise value greater 3.0 (Chiken et al., 2008; Wichmann and Soares, 2006). The level of bursting can be measured by a number of parameters including burst rate and spikes occurring in bursts. These parameters showed quantitatively similar changes. For simplicity, we report only the percentage of spikes occurring in bursts.
Firing periodicity was analyzed using methods similar to those described previously (Gao et al., 2007; Shi et al., 2004). Briefly, rate histograms (binwidth: 10 ms) were constructed based on a 2 min stable recording selected from each cell. Following tapering using the Hanning-Tukey window function and removal of the linear trend, a fast Fourier transform (FFT) was performed to yield spectra with a resolution of 0.097 Hz. LFP autospectra (down-sampled to 100 Hz) were obtained using similar methods. The degree of correlation between GP cell firing and cortical LFP was evaluated using cross and coherence spectral analysis. A 95% confidence level of coherence was determined by C=1-(1-α)1/(k-1), where α=0.95 and k is the number of non-overlapping windows (Rosenberg et al., 1989). Phase lags were calculated from portions of the phase spectrum encompassing the peak frequencies of cross spectra.
The phase relationship between GP spike activity and cortical LFPs was also analyzed using a Hilbert transform (HT)-based method which has the advantage of being applicable to nonstationary signals and maintaining information in the time domain (Slézia et al., 2011). To focus on cortical slow oscillation, LFPs were filted by a zero-phase, 12-pole Butterworth band-pass filter (0.1-1.5 Hz) before the HT. Following the HT, instantaneous phases corresponding to individual GP spikes were determined, and the circular mean of all spike phases was calculated and reported as the mean phase of a GP neuron relative to cortical LFPs. As shown in Fig 2, phase values obtained from the FFT and HT-based methods were nearly identical. For simplicity, we report only phase values obtained from the HT-based method, unless otherwise noted. In both methods, cortical LFPs were inverted so that the peaks of the cortical up-states were defined as 0° and upward deflections in LFPs represent increases, instead of decreases, in cortical activity. PC neurons were defined as cells showing significant coupling to cortical activity with a phase lag >−90° and <90°. All other coupled cells were classified as NC cells.
Figure 2. Functional connectivity of GP neurons to the motor cortex in isoflurane-anesthetized rats.

A) Recordings from a positively coupled (PC) GP neuron. The top two traces in A1 are segments of single-unit recordings from the cell (GP Spike) and LFPs recorded simultaneously from the primary motor cortex (M1 LFP). Note that LFPs are inverted so that upward deflections correspond to increases, instead of decreases, in cortical activity. The bottom two charts are filtered cortical LFPs and corresponding phases (Ph) derived from the Hilbert-transform (HT), respectively. The gray lines in the bottom chart indicate spike times. A2 shows results of the FFT-based analysis of the recordings. The two autospectra (Auto) on the left suggest the presence of a slow oscillation in both the firing activity of the GP neuron and LFPs in the cortex. The cross (Cr) and coherence (Coh) spectra suggest that the two recordings are significantly correlated, with the squared coherence reaching 0.83 at the peak frequency of the cross spectrum (0.59 Hz). The gray line in the coherence spectrum is the upper limit of a 95% confidence level. The phase (Ph) spectrum on the right further shows that the peak frequency of the cross spectrum, cortical activity lagged the activity of the GP cell by 35° (indicated by the arrow). This relatively short phase lag (<90°) identifies the GP neuron as a PC cell. This classification is consistent with the observation that the cell fired almost exclusively during cortical up-states (top two traces in A1). A3 shows results of the HT-based analysis. The left chart is a circular plot of instantaneous phases of individual spikes (small blue circles). The red line is the mean vector. The angle of the mean vector is the circular mean of all spike phases (−34.6°) which is very close to the phase value obtained with the FFT-based analysis (−35°). The length of the mean vector (0.64), ranging from 0 to 1, measures the dispersion of spike phases. The right chart is a circular histogram showing the distribution of spike phases (bin width: 15°). In both charts, the number inside the gray circle is the radius of the circle. A4 shows the cross correlogram between the activity of the GP neuron and the cortex. The presence of a central peak confirms that the GP neuron was positively coupled to the cortex. B) Results from another GP neuron showing a negative functional coupling between the cell and the cortex. Shown in B1 are segments of single-unit recordings from the cell, simultaneously recorded cortical LFPs, filtered LFPs, and HT of the filtered LFPs, respectively. B2-4 are results of the FFT and HT-based analysis and the cross-correlogram between the activity of the GP cell and the cortex. The cell was identified as a negatively coupled (NC) cell because it fired more spikes during cortical down-states than during the up-states, had a long phase lag (−137.4° based on the FFT method and −139.7° based on the HT method), and showed a central trough in the cross-correlogram. C) Results from an uncoupled (UC) GP neuron. The FFT-based coherence analysis suggests that the activity of this cell is not significantly coupled to cortical LFPs (C2). The HT-based analysis further shows that spike phases were relatively evenly distributed over all angles, with the length of the mean vector close to zero (red arrow, C3). There is no clear central peak or trough observed in the cross-correlogram (C4); the correlation coefficients are close to zero at all time-lags examined.
To confirm further whether a GP neuron is positively or negatively coupled to the cortex, a cross-correlogram was constructed for each cell between GP and cortical activity. The vertical axis values are cross correlation coefficients ranging from −1 to 1. A positively coupled cell would show a central peak in the cross-correlogram, whereas a negatively coupled cell would show a central trough.
Numerical results were expressed as mean±SEM. Unless specified otherwise, statistical differences between cell groups were determined using the two tailed Mann-Whitney U test. Phase values were evaluated using the circular statistical method Watson U2 test, whereas differences in proportion were assessed with the two-proportion Z-test.
Results
Classification Based on Spike Shape
The spike shape was examined in 112 GP neurons of which 40 were recorded using the cells-per-track method from 5 rats and 72 were recorded randomly in the GP from 47 animals. All 112 cells fired Type-II spikes (Fig. 1A). To test whether Type-I cells are suppressed by isoflurane, recordings were made from two ketamine-anesthetized rats using the cells-per-track method. In a previous study using ketamine, 50% of GP neurons were Type-I and 50% Type-II (Kelland et al., 1995). In this study, all GP neurons (n=28) recorded under ketamine anesthesia still fired Type-II spikes. In one cell, the spike initially presented as Type-I, but as the electrode advanced to the vicinity of the cell, the spike transitioned to Type-II (Fig. 1B). There was no difference in firing rate (8.4±2 vs 10.9±3.2 spikes/sec, z=0.56) and CV2 (98.1±5.9 vs 91.9±7.4%, z=0.70) between cells recorded under isoflurane and ketamine-induced anesthesia. The level of bursting (measured by the percentage of spikes occurring in bursts), however, was reduced in the ketamine group (9.4±2.9%) compared to the isoflurane group (22.9±4.3%, z=2.13, p<0.05).
Figure 1. Relationship between spike shape and electrode tip size.
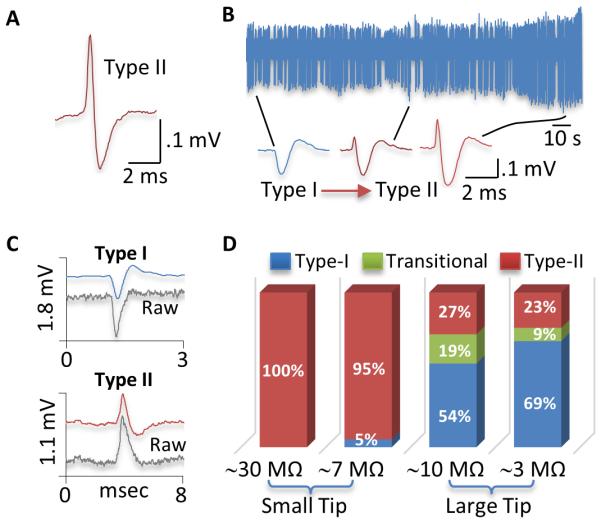
A) Type-II spike of a typical GP neuron recorded in an isoflurane-anesthetized rat using a small-tip, 0.5 M NaAc-filled electrode. B) Recordings from another GP neuron in a ketamine-anesthetized rat showing the transition of spike from Type-I to Type-II as the electrode approached the cell. The leftmost spike (Type-I) was recorded furthest from the cell. In 28 GP neurons recorded in ketamine-anesthetized rats, this was the only cell that showed Type-I spikes. All other cells exhibited Type-II spikes only. C) Type-I and Type-II spikes from two different GP neurons recorded using large-tip electrodes filled with 2 M NaCl. Unfiltered, raw signals were simultaneously recorded and shown as gray lines. As shown, the polarity of the initial phase was unaltered by the filter used in this study. D) Proportions of Type-I (blue), Type-II (red), and transitional cells (green) in isoflurane-anesthetized rats recorded using 4 different types of electrodes. All GP neurons showed Type-II spikes when recorded with small-tip electrodes containing 0.5M NaAc (29.3±0.5 MΩ). Most GP neurons (95%) also showed Type-II spike when small-tip electrodes were filled with 2M NaCl (7.1±0.2 MΩ). In contrast, over 70% of GP neurons fired Type-I spikes when recorded with large-tip electrodes filled with 0.5M NaAc (9.5±0.4 MΩ) or 2M NaCl (2.5±0.1 MΩ).
To determine whether the electrode solution has an effect on spike shape, electrodes were filled with the same solution used by Kelland et al, i.e., 2 M NaCl. The impedance of the electrode is much reduced (7.1±0.2 MΩ, n=4) compared to electrodes containing 0.5 M NaAc (29.3±0.5 MΩ, n=4). In 19 cells recorded in an isoflurane-anesthetized rat, 18 fired Type-II spikes and only one showed Type-I spikes, suggesting that the spike shape depends more on other factors than on the electrode solution. The latter, however, had a significant effect on firing rate and pattern of GP neurons. In general, cells were less stable when recorded with electrodes containing the high concentration of electrolytes. Of the 19 cells recorded, only 5 provided stable recordings for more than 2 minutes, resulting in fewer cells per track (0.56 vs 0.89, Table I). The average firing rate was significantly higher than that of cells recorded with the low-electrolyte containing electrodes (z=2.96, p<0.005), whereas CV2 and the level of bursting were reduced (CV2, z=3.0, p<0.005; burst, z=2.260, p<0.05, Table I).
Table 1.
Comparison of GP neurons recorded with 4 different types of electrodes.
| Electrode Type | Cells/Track | Rate | CV2 | Burst |
|---|---|---|---|---|
| Normal (Small, 0.5 M NaAc) | 0.89 | 8.4±2.0 | 98.1±5.9 | 22.9±4.3 |
| Small, 2MNaCI | 0.56 | 38.6±11.5* | 37.6±4.0* | 0* |
| Large, 0.5 M NaAc | 0.78 | 35.6±6.2* | 39.9±2.2* | 0.1* |
| Large, 2 M NaCI | 0.22 | 33.5±18.4* | 33.3±10.7* | 0* |
Significantly different from cells recorded with normal electrodes. See text for detailed statistics.
To test whether the spike shape depends on the electrode tip size, the electrode tip was broken back to about 2 μm (Kelland et al., 1995). When filled with 2 M NaCl, these large-tip electrodes had an impedance of 2.5 ±0.1 MΩ (n=4). Using these electrodes, 35 GP cells were recorded in 2 isoflurane-anesthetized rats, of which 24 were identified as Type-I, 8 Type-II, and 3 initially Type-I and then transitioned into Type-II when the electrode was moved closer to the cell. Altogether, 77% of cells fired Type-I spikes. Only 4 cells provided stable recordings for more than 2 minutes, yielding 0.22 cells/track. Their mean firing rate was significantly higher than that of cells recorded with our routinely used, small-tip electrodes (z=2.21, p<0.05). Both CV2 and the level of bursting were reduced (CV2, z=2.82, p<0.01; burst, z=2.04, p<0.05, Table I).
Recordings were also made with large-tip electrodes filled with 0.5 M NaAc. Although the impedance of these electrodes (9.5±0.4 MΩ, n=4) was higher than that of small-tip electrodes filled with 2 M NaCl (7.1±0.2 MΩ, n=4), 73% of cells recorded fired Type-I spikes, suggesting that the electrode tip size is more critical than the electrode impedance or solution in determining the spike shape. Thus, in 37 GP neurons recorded from two isoflurane-anesthetized rats, 20 were identified as Type-I, 10 Type-II, and 7 initially Type-I and then transitioned into Type-II. Of these cells, 14 provided stable recordings for more than 2 min (0.78 cells/track). Their average firing rate was significantly higher than that cells recorded with small-tip electrodes (z=4.34, p<0.001), whereas CV2 (z=4.42, p<0.001) and the level of bursting (z=3.29, p<0.001) were reduced (Table I).
The high firing rate observed with large-tip electrodes raises the possibility that Type-I cells are fast-firing neurons detectable only by large-tip electrodes. This possibility is unlikely because cells recorded with small-tip, 2 M NaCl-filled electrodes also had high firing rates, but all cells except one fired Type-II spikes. Furthermore, in cells recorded with large-tip electrodes, the firing rate of the so-called Type-II cells (42±11 spikes/sec, n=7) was not lower than that of Type-I (20±9, n=4) or transitional cells (37±10, n=7). Their firing rate was also much higher than that of the same type of cells recorded with our routinely used, small-tip electrodes (z=3.34, p<0.001), further suggesting that the electrode solution may diffuse out of the electrode tip and affect both Type-I and Type-II cells. Consistent with this possibility, cells tended to be unstable when recorded with electrodes that had a large tip and/or contained a high concentration of electrolytes.
Fig 1C shows typical Type-I and Type-II spikes recorded with large-tip electrodes filled 2 M NaCl. Shown also in the figure are simultaneously recorded unfiltered, raw signals. Comparison of filtered and unfiltered signals suggests that the filter we used do not transform a Type-I waveform into a Type-II or vice versa. Fig 1D shows the proportions of Type-I, Type-II, and transitional cells recorded using the 4 different types of electrodes.
Type-I cells may have a narrow initial rising phase only detectable by a small-tip electrode. Supporting this possibility, Type-II spikes recorded with large-tip electrodes were narrower (0.24±0.01 ms, measured at half maximum, n=18) than those recorded with small-tip electrodes (0.33±0.01 ms, n=80, z=3.95, p<0.001). However, in cells recorded with large-tip electrodes, the initial positive phase of transitional cells, which might be Type-I, was broader (0.29±0.02 ms, n=10) than that of Type-II cells (0.24±0.01 ms, n=18, z=2.4, p<0.05). These results, combined with those described above, suggest that both the spike polarity and spike width vary depending on the electrode used and neither is reliable in identifying Type-I and Type-II GP neurons.
Classification Based on Functional Connectivity
To determine the functinal connecctivity of GP neurons to the cortex, dual-site recordings were made from the GP (single unit) and motor cortex (LFP) in 5 isoflurane-anesthetized rats. All GP neurons were recorded using the cells-per-track technique and small-tip electrodes containing 0.5 M NaAc. In 40 cells recorded (0.89 cells/track), 23 showed a significant coherence with the cortex (Fig 2A and B), of which 16 had an absolute phase lag to the cortex shorter than 90° and were, therefore, classified as positively coupled (PC) cells. The remaining 7 cells had a phase lag longer than 90° and were identified as negatively coupled (NC) cells. In all PC cells, the cross-correlogram showed a central peak, confirming a positive correlation between the firing of PC cells and the activity of the cortex. In all NC cells, the cross-correlogram showed a central trough, suggesting a negative coupling between NC cells and the cortex. Fig 2 shows results from three representative GP neurons.
Fig 3 and Table II summarize results from all cells recorded. As expected, UC cells showed a lower level of coherence with the cortex compared to PC (z=4.83, p<0.001) and NC cells (z=3.72, p<0.001). No significant difference in coherence was found between PC and NC cells (z=1.20). When data from all cells (n=40) are pooled, a modest correlation (r=0.59) is observed between the level of coherence and the relative amplitude of cortical slow oscillation (measured by the mean spectral density between 0.1-1.5 Hz), suggesting that the low level of coherence seen in UC cells is partially related to a low level of cortical slow oscillation during the time of recording. Consistent with this possibility, the amplitude of cortical slow oscillation was smaller in UC cells than in NC cells (z=2.06, p<0.05). However, no significant difference was found between UC and PC cells (z=1.87, Table II), suggesting that the functional coupling between GP neurons and the cortex depends on other factors in addition to the magnitude of cortical oscillation.
Figure 3. Firing properties of GP neurons in control and 6-OHDA-lesioned rats.

A) In control animals, 40% of GP neurons recorded were identified as PC cells, 17.5% NC cells, and 42.5% UC cells (upper left). As expected, UC cells showed a lower level of coherence with the cortex compared to both PC and NC cells (upper center). Cortical slow oscillation (SO) was smaller in amplitude during UC cell recording than during NC cell recording. However, no difference in cortical slow oscillation was observed between PC and UC cells (upper right). NC cells fired significantly faster (lower left) and showed a reduced level of firing variability (CV2, lower center) and bursting (lower right) compared PC and NC cells. B) In lesioned rats, 42.3% of GP neurons were PC cells, 36.5% NC cells, and 21.2% UC cells (upper left). UC cells showed a lower level of coherence with the cortex compared to both PC and NC cells (upper center). Cortical slow oscillation was reduced during NC cell recording than during PC cell recording. No differences were found between UC and PC cells and between UC and NC cells (upper right). NC cells fired significantly faster (lower center) and had a reduced CV2 and a lower level of bursting than PC and NC cells (lower center and right). A significant difference in bursting was also observed between PC and UC cells. *p<0.05, **p<0.01, ***p<0.005, ****p<0.001.
Table II.
Comparison of GP neuron subtypes in control and 6-OHDA lesioned rats
| Cell Type | % | Coherence | Cortical SO | Rate | CV2 | Burst | |
|---|---|---|---|---|---|---|---|
| Control | All | 100% | 0.39±0.04 | 3.3±0.2 | 8.4±2.0 | 98.1±5.9 | 22.9±4.3 |
| PC | 40% | 0.54±0.03 | 3.6±0.3 | 5.2±2.8 | 105±5.2 | 30.4±7.7 | |
| NC | 17.5% | 0.65±0.08 | 4.0±0.2 | 20±5.5p,u | 58.3±8.7p,u | 0.1±0.1p,u | |
| UC | 42.5% | 0.14±0.02p,n | 2.6±0.3n | 6.7±2.8 | 108±10.7 | 25.3±6.0 | |
| Lesion | All | 100% | 0.46±0.03 | 3.4±0.1 | 15.4±3.0 | 90.1±5.2 | 26.4±4.1 |
| PC | 42.3% | 0.51±0.04 | 3.9±0.1 | 2.8±0.8 | 114±4.7 | 48.7±5.7 | |
| NC | 36.5%* | 0.54±0.04 | 3.0±0.2* | 36.3±5.2p,u | 50.2±3.7p,u | 0.2±0.2p,u | |
| UC | 21.2%* | 0.18±0.03p,n | 3.2±0.4 | 4.4±2.9 | 111±9.3 | 27±7.6P | |
Significantly different from the same subtype in the control group.
Significantly different from PC cells in the same group.
Significantly different from NC cells in the same group.
Significantly different from UC cells in the same group. See text and Fig 3 for detailed statistics.
PC, NC, and UC cells differed from each other not only in their functional connectivity and percentage in the population (40%, 17.5%, and 42.5%, respectively), but also in firing rate, CV2, and degree of bursting (Fig 3, Table II). Specifically, NC cells fired significantly faster and had a redcued CV2 and a lower level of bursting compared to PC (Rate, z=3.14, p<0.005, CV2, z=3.21, p<0.005, burst, z=2.67, p<0.01) and UC neurons (Rate, z=2.57, p=0.01, CV2, z=2.25, p<0.05, burst, z=2.51, p<0.05, Table II).
Effects of 6-OHDA Lesions
In 6 rats lesioned with 6-OHDA, GP neurons were recorded using the cells-per-track technique and small-tip, 0.5 M NaAc-filled electrodes. In 52 cells recorded (0.96 cells/track), 22 were identified as PC cells, 19 NC cells, and 11 UC cells (Fig 3 and Table II).
As expected, UC cells showed a significantly lower level of coherence to the cortex compared to PC and NC cells (PC, z=4.16, p<0.001; NC, z=3.79, p<0.001). Unexpectedly, no correlation (r=0.06) was found between the level of coherence and the amplitude of cortical slow oscillation in lesioned rats. Cortical slow oscillation was larger in amplitude in PC cells compared to NC cells (z=3.79, p<0.001). No difference was found between PC and UC cells (z=1.15) and between NC and UC cells (z=1.14). As observed in controls, the firing rate was significantly higher in NC cells than in PC (z=5.23, p<0.001) and UC cells (z=3.94, p<0.001), whereas CV2 and the level of bursting were lower in NC cells than in PC (CV2, z=5.23, p<0.001; Burst, z=4.94, p<0.001) and UC cells (CV2, z=4.2, p<0.001; Burst, z=3.55, p<0.001, Fig 4, Table II). Compared to controls, DA depletion significantly increased the proportion of NC cells (z=2.01, p<0.05), decreased that of UC cells (z=2.21, p<0.05), and had no significant effect on PC cells (z=0.22, Z-test, Table II). When subtypes of GP neurons were compared to their counterparts in control animals, only NC cells showed a difference in amplitude of cortical slow oscillation (z=3.2, p<0.005, Fig 3, Table II).
Figure 4. Phase shift of GP neurons induced by DA depletion.

A) A1 and A2 show the circular plot (left) and circular histogram (right) of phases of PC neurons in control and lesioned rats, respectively. In control rats, 44% of PC cells had a negative phase relative to the cortex, suggesting that the activity of these cells precedes the activity of the cortex (A1). In lesioned rats, most PC cells (91%) had a positive phase (A2). As a result, the mean phase was shifted from −11.6° in control animals to 20.7° in lesioned animals (red line in the circular plot). A3 shows the cumulative distributions (CP, cumulative probability) of phases of PC cells in control (blue) and lesioned rats (red). Circular statistical analysis suggests that the phase shift induced by 6-OHDA lesions is significant. B) Unlike in PC cells, 6-OHDA lesions produced no significant change in phase in NC cells. The mean phase was −137.7° in control rats (B1) and −132.8° in lesion rats (B2). Circular statistical analysis suggests no significant difference between the two groups of cells.
Although DA depletion had no significant effect on the number of PC cells, it significantly shifted the phase relationship between PC cells and the cortex (Fig 4). Thus, in control rats, 44% of PC cells had a negative phase lag, suggesting that GP activity leads cortical activity in these cells. In lesioned animals, however, only 9% of PC cells led the cortex. As a result, the mean phase was shifted from −11.6° in control animals to 20.7° in lesioned rats. Circular statistical analysis suggests that this change is significant (u2=0.20, p<0.05, U2-test, Fig 4 upper charts). In contrast, no significant change in phase was observed in NC cells (u2=0.13). In both the control and lesion group, the activity of most NC cells lagged behind cortical activity (Fig 4, lower charts).
Discussion
This study showed that most GP neurons fired Type-II spikes when recorded with small-tip electrodes. Type-I spikes were almost exclusively observed with large-tip electrodes. PC, NC, and UC neurons were present in isoflurane-anesthetized rats, differed significantly from each other in firing rate and pattern, and were differentially affected by 6-OHDA lesions.
Type-I and Type-II GP Neurons
Earlier studies found two types of striatal neurons based on spike shape, Type-I and Type-II (Skirboll et al., 1979). Studies in the GP observed similar waveforms and used the same designations (Bergstrom et al., 1982; Bergstrom et al., 1984; Kelland et al., 1995; Napier et al., 1991; Pan et al., 1990; Walters et al., 1987). In this study, all GP neurons recorded with our routinely used small-tip electrodes fired Type-II spikes. This lack of Type-I spikes is apparently not due to the use of isoflurane since all GP neurons recorded under ketamine anesthesia also fired Type-II spikes. In a study by Kelland et al., equal numbers of Type-I and Type-II cells were found in ketamine-anesthetized rats (Kelland et al., 1995). The finding that more than 70% of GP neurons exhibited Type-I spikes when large-tip electrodes were used further suggests that the spike shape depends critically on the electrode tip geometry. Using electrodes with a tip diameter of about 1.5 μm, Magill et al also found that all GP neurons fired Type-II spikes (Magill et al., 2001). Their electrodes are smaller than our large electrodes (~2 μm), but larger than our small electrodes (<1 μm). This comparison, however, may not be entirely appropriate since it is the inner diameter that determines the actual surface area of an electrode. For a given outer diameter, the inner diameter may vary depending on the thickness of the glass wall. Using tungsten electrodes with a much larger surface area (2-3 μm in diameter and 10-12 μm in length), Toan and Schultz found all GP neurons to be Type-I (Toan and Schultz, 1985). Similar results were obtained with tungsten electrodes that have a diameter of 38-50 μm (Benhamou et al., 2012). Nisenbaum et al showed that the initial positivity of Type-II waveforms decreases with increasing tip size (Nisenbaum et al., 1988), further supporting the suggestion that the spike shape depends critically on the electrode tip size.
The electrode solution appears to play less of a role in spike shape than does the electrode tip size. When small-tip electrodes were filled with a high-electrolyte solution, 95% of GP cells recorded still exhibited Type-II spikes even though the impedance of those electrodes was lower than that of large-tip electrodes filled with a low-electrolyte solution. When large-tip electrodes were used, the percentage of cells firing Type-I spikes was only slightly increased (from 73% to 79%) when the electrode solution was changed from a low to a high-electrolyte solution. The electrode solution, however, had a significant effect on the firing rate of GP neurons. Thus, cells tended to fire fast when recorded with electrodes that had a large tip and/or a high centration of electrolytes. These cells also tended to be unstable, raising the possibility that the electrode solution diffuses out of the electrode tip and influences the firing of a recorded cell. It is unlikely that the electrode solution preferentially activates Type-I cells since all but one cell recorded with small-tip, high electrolyte-containing electrodes fired Type-II spikes only. Furthermore, the firing rate of Type-II cells recorded with large-tip electrodes was not lower than that of Type-I cells recorded using the same electrodes. Their firing rate was also significantly higher than that of the same type of cells recorded with small-tip, low electrolyte-containing electrodes, suggesting that electrode solution diffusing out of the electrode affects both Type-I and Type-II cells.
Type-I and Type-II cells differ from each other not only in spike shape, but also in axonal conduction velocity and response to apomorphine (Kelland et al., 1995). While our recordings do not allow classification based on polarity of the initial peak, it is possible that cells with a narrow initial phase are Type-I and those with a broad initial phase are Type-II, and the narrow initial phase in Type-I cells is only detectable by small-tip electrodes. Consistent with this possibility, the initial positive peak recorded with small-tip electrodes were significantly wider than those recorded with large-tip electrodes. However, in cells recorded with large-tip electrodes, the initial positive peak of transitional cells, which might be Type-I, was significantly wider than that of cells initially presenting as Type-II. Taken together, these results suggest that neither the spike polarity nor the spike width recorded extracellularly is reliable in identifying Type-I and Type-II GP neurons.
Classification based on functional connectivity
This study showed that GP neurons can be classified into PC, NC, and UC cells based on functional connectivity to the cortex. The proportions of these cells (PC 40%, NC 17.5%, UC 42.5%), however, were different from those reported previously. In one study, 91% of GP cells recorded in ketamine-anesthetized rats were functionally coupled to the cortex, while under urethane most GP cells were uncoupled (Magill et al., 2000). In another study also using urethane, 72% of GP neurons were PC and 2% NC (Zold et al., 2007). In a study using urethane supplemented with ketamine, only 15% were PC and 10% NC (Mallet et al., 2008). Multiple factors may have contributed to the discrepancy, including differences in anesthesia, data analysis, and electrode. Low-impedance electrodes have been suggested to preferentially record NC cells (Mallet et al., 2012).
This study also showed that PC, NC, and UC cells differed from each other in firing rate and pattern. NC cells fired significantly faster and showed a reduced firing variability and a lower level of bursting compared to PC and UC cells. These results raise the possibility that NC cells correspond to the high frequency, low CV pausers (HFPs) found in the primate external GP, whereas PC and/or UC cells correspond to low frequency, high CV bursters (LFBs, DeLong, 1971). The proportions of PC, NC, and UC cells, however, do not match the number of HFPs and LFBs found in primates in which 85% of neurons recorded in the external GP were HFPs and only 15% were LFBs (DeLong, 1971). This difference could be due to the fact that our recordings were made from isoflurane-anesthetized rats, whereas the study by DeLong was performed in awake primates.
The presence and identification of HFPs and LFBs in the rodent GP have been extensively studied and remain uncertain. Using in vivo intracellular recording in rats, Kita and Kitai found three types of GP neurons: repetitive-firing (73%), bursting (18%), and silent cells (9%, Kita and Kitai, 1991). Since no data on firing rate were reported, it is unknown whether the repetitive-firing cells correspond to HFPs, whereas the bursting neurons correspond to LFBs. More bursting cells in the GP (Type I, 59%) were found using intracellular recording in cat brain slices (Nambu and Llinas, 1994). Unlike those recorded in vivo, however, bursting cells in slices were silent and fired bursts only when activated by current injections. In the same study, 37% of GP neurons were spontaneously active and showed repetitive firing (Type-II). These cells also exhibited a higher input resistance and narrower spikes than Type-I, bursting cells. The remaining 4% cells were silent, non-bursting cells. Cooper and Stanford also reported three types of GP neurons based on whole cell recordings in rat brain slices (Cooper and Stanford, 2000). In their study, 63% cells were classified as Type-A which were characterized by the presence of a large Ih current and the regularity of firing. Type-B cells (32%) showed no evidence of Ih and fired irregularly. Type-B cells also had a lower input resistance compared to Type-A cells. These results suggest that Type-A cells may correspond to the regular spiking, Type-II cells described by Kita and Kitai and by Nambu and Llinas, whereas Type-B cells correspond to Type-I, bursting cells. However, unlike Type-I cells whose action potential has a longer duration than that of Type II cells, Type-B cells exhibited narrower action potentials than Type-A cells. Using cell-attached and whole-cell recording in rat brain slices, Bugaysen et al also found three types of GP neurons (Bugaysen et al., 2010). Of the three, Type-A appears to be similar to the Type-B cells described by Cooper and Stanford as they also fired at a relatively low rate with an irregular firing pattern. However, unlike the Type-B cells described by Cooper and Stanford, Type-A cells described by Bugaysen et al had a larger Ih current, higher input resistance, and broader action potentials than the other two GP cell types. More recently, using extracellular recording in freely moving rats, Benhamou et al show that GP neurons in rats are different from those in primates in that the firing rate of HFPs and that of LFBs are not significantly different from each other and the spike width of LFB neurons is shorter, instead of being longer, than in HFP neurons (Benhamou et al., 2012). Taken together, these results not only show the difficulty in identifying HFPs and LFBs based on intrinsic membrane properties, but further suggest that the differences in firing rate and pattern between HFPs and LFBs depend on not just the intrinsic properties of the cell, but more on synaptic inputs (Deister et al., 2013).
The different functional connectivity of PC, NC, and UC cells with the cortex suggests that the cortex regulates different GP neuron subtypes differently. The cortex may modulate PC cells through subthalamic glutamate neurons and NC cells through striatal GABA neurons (Bevan et al., 1995; Fernández-Suárez et al., 2012; Kita and Kita, 2012). Two observations suggest that this scheme might be overly simplified. First, NC cells fired significantly faster than PC cells, suggesting that NC cells also receive an excitatory input and/or PC cells are tonically inhibited by an inhibitory input. Second, cortical activity lagged behind GP activity in 44% of PC cells, suggesting that the firing of these PC neurons are not driven solely by the cortex, but in conjunction with other areas. For example, the thalamus, known to trigger cortical slow oscillation (Crunelli and Hughes, 2010), also provides extensive glutamate projections to the striatum and subthalamic nucleus (Castle et al., 2005; Lanciego et al., 2004; Lanciego et al., 2012). A direct projection from the thalamus to the GP has also been demonstrated (Castle et al., 2005). A recent computer modeling study suggests that inputs from the striatum, thalamus and cortex are all important in regulating the activity of GP neurons (Nevado-Holgado et al., 2014). The study shows that inhibitory connections from the striatum were much stronger to NC (TI) neurons than to PC (TA) neurons, whereas excitatory connections from the thalamus were much stronger to PC (TA) and subthalamic neurons than to NC (TI) neurons.
Effects of 6-OHDA lesions
Two main effects of 6-OHDA lesions were observed. First, the lesions increased the proportion of NC cells from 17.5% to 36.5%, decreased that of UC cells from 42.5% to 21.2%, and produced no significant effect on PC cells (from 40% to 42.3%). In a previous study using urethane supplemented with ketamine, 6-OHDA lesions similarly increased NC cells from 10% to 72% and had only a small effect on PC cells (Mallet et al., 2008). However, in another study also using urethane, 6-OHDA lesions decreased PC neurons from 72% to about 30%, increased NC cells from about 2% to 43%, and slightly increased UC cells (Zold et al., 2007). Again, the cause for the discrepancy is unknown and may be related to the anesthesia, method of data analysis, and electrode used in different studies.
The second main effect of 6-OHDA lesions was the shift in phase in PC cells. Under control conditions, GP activity preceded cortical activity in nearly half of PC cells recorded (44%). Following 6-OHDA lesions, almost all PC cells (91%) lagged behind the cortex. This change in phase was accompanied with no change in the proportion of PC cells. In contrast, DA depletion increased the number of NC cells without affecting their phase relationship to the cortex. If PC and NC cells are coupled to the cortex through the subthalamic nucleus and striatum, respectively, these results would suggest a significant change in information transmission through both nuclei by DA depletion.
To summarize, Type-I and Type-II GP neurons, while likely representing distinct neuronal populations, are poorly represented by the spike shape, even though this is how they were originally defined. PC, NC, and UC cells are present in isoflurane-anesthetized rats. They differ from each other not only in functional connectivity, but also in firing rate, firing pattern, and response to 6-OHDA lesions (Fig 5). These results support the suggestion that PC, NC, and UC neurons play different roles in the pathophysiology of Parkinson’s disease.
Figure 5. Diagram summarizing classification of GP neurons based on functional connectivity and effects of DA depletion.
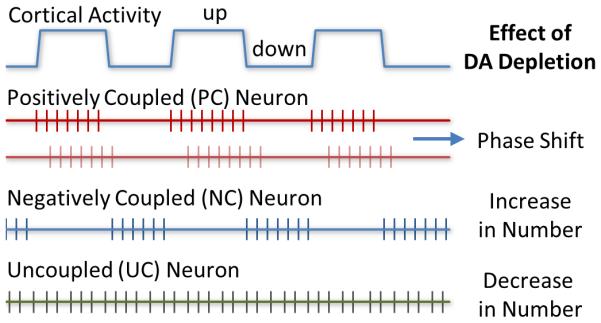
Both PC and NC neurons were functionally coupled to the cortex. PC cells fired predominantly during cortical up states, whereas NC cells fired preferentially during cortical down states. UC cells showed no significant functional coupling to the cortex. Lesions of DA neurons induced by 6-OHDA differentially affected the three subtypes of GP neurons. The number of NC cells was increased, whereas that of UC cells was decreased. The lesions had no significant effect on the number of PC cells, but they induced a significant rightward shift in phase in the activity of PC cells relative to cortical activity.
Acknowledgements
The authors thank the excellent technical assistance provided by Sherry Chak, Keziah Chau, Sonjia Dennis, Hee Kim, Christine Kojayan, Chuan Main Lin, Stephanie Van, and Jinglei Wang. We also would like to thank Willie Davis, Elwood Siagian, and Paul Williams for comments and suggestions. The present study was supported in part by Loma Linda University School of Pharmacy and NIH grant DA032857 (WXS).
References
- Benhamou L, Bronfeld M, Bar-Gad I, Cohen D. Globus Pallidus External Segment Neuron Classification in Freely Moving Rats: A Comparison to Primates. PLoS ONE. 2012;7(9):e45421. doi: 10.1371/journal.pone.0045421. [DOI] [PMC free article] [PubMed] [Google Scholar]
- Bergstrom DA, Bromley SD, Walters JR. Apomorphine increases the activity of rat globus pallidus neurons. Brain Research. 1982;238(1):266–271. doi: 10.1016/0006-8993(82)90795-8. [DOI] [PubMed] [Google Scholar]
- Bergstrom DA, Bromley SD, Walters JR. Dopamine agonists increase pallidal unit activity: Attenuation by agonist pretreatment and anesthesia. European Journal of Pharmacology. 1984;100(1):3–12. doi: 10.1016/0014-2999(84)90309-1. [DOI] [PubMed] [Google Scholar]
- Bevan MD, Francis CM, Bolam JP. The glutamate-enriched cortical and thalamic input to neurons in the subthalamic nucleus of the rat: Convergence with GABA-positive terminals. The Journal of Comparative Neurology. 1995;361(3):491–511. doi: 10.1002/cne.903610312. [DOI] [PubMed] [Google Scholar]
- Bugaysen J, Bronfeld M, Tischler H, Bar-Gad I, Korngreen A. Electrophysiological Characteristics of Globus Pallidus Neurons. PLoS ONE. 2010;5(8):e12001. doi: 10.1371/journal.pone.0012001. [DOI] [PMC free article] [PubMed] [Google Scholar]
- Castle M, Aymerich MS, Sanchez-Escobar C, Gonzalo N, Obeso JA, Lanciego JL. Thalamic innervation of the direct and indirect basal ganglia pathways in the rat: Ipsi-and contralateral projections. J Comp Neurol. 2005;483(2):143–153. doi: 10.1002/cne.20421. [DOI] [PubMed] [Google Scholar]
- Chiken S, Shashidharan P, Nambu A. Cortically Evoked Long-Lasting Inhibition of Pallidal Neurons in a Transgenic Mouse Model of Dystonia. The Journal of Neuroscience. 2008;28(51):13967–13977. doi: 10.1523/JNEUROSCI.3834-08.2008. [DOI] [PMC free article] [PubMed] [Google Scholar]
- Cooper AJ, Stanford IM. Electrophysiological and morphological characteristics of three subtypes of rat globus pallidus neurone in vitro. The Journal of Physiology. 2000;527(2):291–304. doi: 10.1111/j.1469-7793.2000.t01-1-00291.x. [DOI] [PMC free article] [PubMed] [Google Scholar]
- Crunelli V, Hughes SW. The slow (<1 Hz) rhythm of non-REM sleep: a dialogue between three cardinal oscillators. Nat Neurosci. 2010;13(1):9–17. doi: 10.1038/nn.2445. [DOI] [PMC free article] [PubMed] [Google Scholar]
- Deister CA, Dodla R, Barraza D, Kita H, Wilson CJ. Firing rate and pattern heterogeneity in the globus pallidus arise from a single neuronal population. Journal of Neurophysiology. 2013;109(2):497–506. doi: 10.1152/jn.00677.2012. [DOI] [PMC free article] [PubMed] [Google Scholar]
- DeLong MR. Activity of pallidal neurons during movement. J Neurophysiol. 1971;34(3):414–427. doi: 10.1152/jn.1971.34.3.414. [DOI] [PubMed] [Google Scholar]
- Fernández-Suárez D, Celorrio M, Lanciego JL, Franco R, Aymerich MS. Loss of Parvalbumin-Positive Neurons From the Globus Pallidus in Animal Models of Parkinson Disease. Journal of Neuropathology & Experimental Neurology. 2012;71(11):973–982. doi: 10.1097/NEN.0b013e3182717cba. 910.1097/NEN.1090b1013e3182717cba. [DOI] [PubMed] [Google Scholar]
- Gao M, Liu CL, Yang S, Jin GZ, Bunney BS, Shi WX. Functional coupling between the prefrontal cortex and dopamine neurons in the ventral tegmental area. J Neurosci. 2007;27(20):5414–5421. doi: 10.1523/JNEUROSCI.5347-06.2007. [DOI] [PMC free article] [PubMed] [Google Scholar]
- Godfraind J. Localization of glass microelectrode extremities in the central nervous system by pontamine electrophoresis. J Physiol (Paris) 1969;61(Suppl 2):436–437. [PubMed] [Google Scholar]
- Hellon R. The marking of electrode tip positions in nervous tissue. J Physiol. 1971;214(Suppl):12P. [PubMed] [Google Scholar]
- Holt GR, Softky WR, Koch C, Douglas RJ. Comparison of discharge variability in vitro and in vivo in cat visual cortex neurons. J Neurophysiol. 1996;75(5):1806–1814. doi: 10.1152/jn.1996.75.5.1806. [DOI] [PubMed] [Google Scholar]
- Kelland MD, Soltis RP, Anderson LA, Bergstrom DA, Walters JR. In vivo characterization of two cell types in the rat globus pallidus which have opposite responses to dopamine receptor stimulation: Comparison of electrophysiological properties and responses to apomorphine, dizocilpine, and ketamine anesthesia. Synapse. 1995;20(4):338–350. doi: 10.1002/syn.890200407. [DOI] [PubMed] [Google Scholar]
- Kita H, Kitai ST. Intracellular study of rat globus pallidus neurons: membrane properties and responses to neostriatal, subthalamic and nigral stimulation. Brain Research. 1991;564(2):296–305. doi: 10.1016/0006-8993(91)91466-e. [DOI] [PubMed] [Google Scholar]
- Kita T, Kita H. The Subthalamic Nucleus Is One of Multiple Innervation Sites for Long-Range Corticofugal Axons: A Single-Axon Tracing Study in the Rat. The Journal of Neuroscience. 2012;32(17):5990–5999. doi: 10.1523/JNEUROSCI.5717-11.2012. [DOI] [PMC free article] [PubMed] [Google Scholar]
- Lanciego JL, Gonzalo N, Castle M, Sanchez-Escobar C, Aymerich MS, Obeso JA. Thalamic innervation of striatal and subthalamic neurons projecting to the rat entopeduncular nucleus. European Journal of Neuroscience. 2004;19(5):1267–1277. doi: 10.1111/j.1460-9568.2004.03244.x. [DOI] [PubMed] [Google Scholar]
- Lanciego JL, Luquin N, Obeso JA. Functional neuroanatomy of the basal ganglia. Cold Spring Harb Perspect Med. 2012;2(12):a009621. doi: 10.1101/cshperspect.a009621. [DOI] [PMC free article] [PubMed] [Google Scholar]
- Legendy CR, Salcman M. Bursts and recurrences of bursts in the spike trains of spontaneously active striate cortex neurons. Journal of Neurophysiology. 1985;53(4):926–939. doi: 10.1152/jn.1985.53.4.926. [DOI] [PubMed] [Google Scholar]
- Magill PJ, Bolam JP, Bevan MD. Relationship of activity in the subthalamic nucleus-globus pallidus network to cortical electroencephalogram. J Neurosci. 2000;20(2):820–833. doi: 10.1523/JNEUROSCI.20-02-00820.2000. [DOI] [PMC free article] [PubMed] [Google Scholar]
- Magill PJ, Bolam JP, Bevan MD. Dopamine regulates the impact of the cerebral cortex on the subthalamic nucleus-globus pallidus network. Neuroscience. 2001;106(2):313–330. doi: 10.1016/s0306-4522(01)00281-0. [DOI] [PubMed] [Google Scholar]
- Mallet N, Micklem Benjamin R, Henny P, Brown Matthew T, Williams C, Bolam JP, Nakamura Kouichi C, Magill Peter J. Dichotomous Organization of the External Globus Pallidus. Neuron. 2012;74(6):1075–1086. doi: 10.1016/j.neuron.2012.04.027. [DOI] [PMC free article] [PubMed] [Google Scholar]
- Mallet N, Pogosyan A, Marton LF, Bolam JP, Brown P, Magill PJ. Parkinsonian Beta Oscillations in the External Globus Pallidus and Their Relationship with Subthalamic Nucleus Activity. J Neurosci. 2008;28(52):14245–14258. doi: 10.1523/JNEUROSCI.4199-08.2008. [DOI] [PMC free article] [PubMed] [Google Scholar]
- Nambu A, Llinas R. Electrophysiology of globus pallidus neurons in vitro. 1994:1127–1139. doi: 10.1152/jn.1994.72.3.1127. [DOI] [PubMed] [Google Scholar]
- Napier TC, Simson PE, Givens BS. Dopamine electrophysiology of ventral pallidal/substantia innominata neurons: comparison with the dorsal globus pallidus. Journal of Pharmacology and Experimental Therapeutics. 1991;258(1):249–262. [PubMed] [Google Scholar]
- Nevado-Holgado AJ, Mallet N, Magill PJ, Bogacz R. Effective connectivity of the subthalamic nucleus–globus pallidus network during Parkinsonian oscillations. The Journal of Physiology. 2014;592(7):1429–1455. doi: 10.1113/jphysiol.2013.259721. [DOI] [PMC free article] [PubMed] [Google Scholar]
- Nisenbaum E, Orr W, Berger T. Evidence for two functionally distinct subpopulations of neurons within the rat striatum. The Journal of Neuroscience. 1988;8(11):4138–4150. doi: 10.1523/JNEUROSCI.08-11-04138.1988. [DOI] [PMC free article] [PubMed] [Google Scholar]
- Pan HS, Engber TM, Chase TN, Walters JR. The effects of striatal lesion on turning behavior and globus pallidus single unit response to dopamine agonist administration. Life Sciences. 1990;46(1):73–80. doi: 10.1016/0024-3205(90)90060-5. [DOI] [PubMed] [Google Scholar]
- Paxinos G, Watson C. The Rat Brain in Stereotaxic Coordinates. 4th. Academic Press, Inc.; 1998. [DOI] [PubMed] [Google Scholar]
- Rosenberg JR, Amjad AM, Breeze P, Brillinger DR, Halliday DM. The Fourier approach to the identification of functional coupling between neuronal spike trains. Progress in Biophysics and Molecular Biology. 1989;53(1):1–31. doi: 10.1016/0079-6107(89)90004-7. [DOI] [PubMed] [Google Scholar]
- Shi WX. Slow oscillatory firing: a major firing pattern of dopamine neurons in the ventral tegmental area. J Neurophysiol. 2005;94(5):3516–3522. doi: 10.1152/jn.00317.2005. [DOI] [PubMed] [Google Scholar]
- Shi WX, Pun CL, Zhou Y. Psychostimulants induce low-frequency oscillations in the firing activity of dopamine neurons. Neuropsychopharmacology. 2004;29(12):2160–2167. doi: 10.1038/sj.npp.1300534. [DOI] [PubMed] [Google Scholar]
- Skirboll LR, Grace AA, Bunney BS. Dopamine Auto-and Postsynaptic Receptors: Electrophysiological Evidence for Differential Sensitivity to Dopamine Agonists. Science. 1979;206(4414):80–82. doi: 10.1126/science.482929. [DOI] [PubMed] [Google Scholar]
- Slézia A, Hangya B, Ulbert I, Acsády L. Phase Advancement and Nucleus-Specific Timing of Thalamocortical Activity during Slow Cortical Oscillation. The Journal of Neuroscience. 2011;31(2):607–617. doi: 10.1523/JNEUROSCI.3375-10.2011. [DOI] [PMC free article] [PubMed] [Google Scholar]
- Taube JS. Interspike interval analyses reveal irregular firing patterns at short, but not long, intervals in rat head direction cells. J Neurophysiol. 2010;104(3):1635–1648. doi: 10.1152/jn.00649.2009. [DOI] [PMC free article] [PubMed] [Google Scholar]
- Toan DL, Schultz W. Responses of rat pallidum cells to cortex stimulation and effects of altered dopaminergic activity. Neuroscience. 1985;15(3):683–694. doi: 10.1016/0306-4522(85)90070-3. [DOI] [PubMed] [Google Scholar]
- Walters JR, Bergstrom DA, Carlson JH, Chase TN, Braun AR. D1 dopamine receptor activation required for postsynaptic expression of D2 agonist effects. Science. 1987;236(4802):719–722. doi: 10.1126/science.2953072. [DOI] [PubMed] [Google Scholar]
- Wichmann T, Soares J. Neuronal Firing Before and After Burst Discharges in the Monkey Basal Ganglia Is Predictably Patterned in the Normal State and Altered in Parkinsonism. 2006:2120–2133. doi: 10.1152/jn.01013.2005. [DOI] [PubMed] [Google Scholar]
- Zold CL, Ballion B, Riquelme LA, Gonon F, Murer MG. Nigrostriatal lesion induces D2-modulated phase-locked activity in the basal ganglia of rats. European Journal of Neuroscience. 2007;25(7):2131–2144. doi: 10.1111/j.1460-9568.2007.05475.x. [DOI] [PubMed] [Google Scholar]