

Abstract
Human arginase deficiency is characterized by hyperargininemia and infrequent episodes of hyperammonemia that cause neurological impairment and growth retardation. We previously developed a neonatal mouse adeno-associated viral vector (AAV) rh10-mediated therapeutic approach with arginase expressed by a chicken β-actin promoter that controlled plasma ammonia and arginine, but hepatic arginase declined rapidly. This study tested a codon-optimized arginase cDNA and compared the chicken β-actin promoter to liver- and muscle-specific promoters. ARG1−/− mice treated with AAVrh10 carrying the liver-specific promoter also exhibited long-term survival and declining hepatic arginase accompanied by the loss of AAV episomes during subsequent liver growth. Although arginase expression in striated muscle was not expected to counteract hyperammonemia, due to muscle's lack of other urea cycle enzymes, we hypothesized that the postmitotic phenotype in muscle would allow vector genomes to persist, and hence contribute to decreased plasma arginine. As anticipated, ARG1−/− neonatal mice treated with AAVrh10 carrying a modified creatine kinase-based muscle-specific promoter did not survive longer than controls; however, their plasma arginine levels remained normal when animals were hyperammonemic. These data imply that plasma arginine can be controlled in arginase deficiency by muscle-specific expression, thus suggesting an alternative approach to utilizing the liver for treating hyperargininemia.
Introduction
Two arginase isoforms are expressed in mammals: arginase 1 (ARG1) and arginase 2 (ARG2).1 These are the products of distinct genes located on different chromosomes with independent regulation; both are expressed in many cell types, and both are inducible by a wide range of agents and in many pathophysiological conditions.2,3,4 The arginases catalyze the divalent cation-dependent hydrolysis of l-arginine to form the nonprotein amino acid l-ornithine and urea. In the liver, in coordination with the other enzymes, this urea cycle reaction constitutes the final step in ureagenesis and is performed by ARG1.5 ARG1 is expressed most prevalently in hepatocytes and red blood cells, is cytosolic, and is the best characterized of the mammalian arginases. Arginase has been detected in a number of nonhepatic tissues that lack a complete urea cycle; in these locations (mainly in the kidney and brain),5,6 the second isozyme, ARG2, is mitochondrial and the reaction is thought to provide a source of ornithine, the biosynthetic precursor of proline and polyamines. The human type 1 and 2 arginases are related by 58% sequence identity but are immunologically distinct.6
Arginase deficiency is an autosomal recessive disorder resulting from a loss of ARG1. Neonatal and early infantile presentations are rare and cause severe hyperammonemia7,8; ARG1 deficiency usually presents later in life beginning in late infancy to the second year of life with microcephaly, spasticity, seizures, clonus, loss of ambulation (often manifesting as spastic diplegia), and failure to thrive associated with hyperargininemia9 but without profound hyperammonemia. The neurologic manifestations seen in arginase deficiency may arise from the accumulation of arginine and its metabolites, but recent studies in both humans10 and mice11 suggest that guanidino compounds, previously considered the presumptive cause, may not be related to the central nervous system dysfunction characteristic of this disorder. The neurologic impairment and developmental regression are associated with corticospinal12 and pyramidal tract deterioration. The lack of frequent episodes of hyperammonemia in humans is possibly due to an increase in ARG2 which compensates for the lack of ARG15 (ARG2 has been found to be induced in the kidneys of ARG1-deficient patients)13; if this hypothesis is correct, nonhepatic arginase expression may be an important consideration in developing therapy for these patients. Currently, long-term therapy rests on provision of a low-protein diet and administration of sodium benzoate and sodium phenylbutyrate. While these dietary and pharmaceutical interventions can partially alleviate the hyperargininemia of ARG1 deficiency, no completely effective therapy is available.
We have developed a gene therapy approach for treating ARG1−/− animals with neonatal onset of the disorder by using an adeno-associated viral (AAV) vector expressing ARG114. In these studies, we utilized AAV driven by the ubiquitously expressing chicken β-actin promoter/cytomegalovirus (CMV) enhancer (CBA) resulting in hepatic arginase expression; however, only very low levels of activity remained after the neonatal period. In these mice, other organs and tissues (particularly the heart and skeletal muscle) also expressed ARG1, and activity in these remained substantially higher than in liver; whether this had any beneficial effects was unclear. We thus hypothesized that arginase deficiency may be a urea cycle disorder where extrahepatic ARG1 expression in striated muscle might moderate hyperargininemia. The potential therapeutic advantage is that while hepatocytes undergo frequent cell division during early life14,15,16 resulting in a substantial loss of AAV vector genomes, most cardiac and skeletal myocytes are postmitotic at birth17,18 and exhibit greater stability of episomal AAV genomes following both adult19 and neonatal vector administration15. This could be advantageous as a neonatal gene therapy approach for hyperargininemia and would have important clinical implications for treating this disorder. In these studies, we have compared the effects of treating ARG1 deficient mice with AAVrh10 vectors carrying a muscle-specific or liver-specific regulatory cassette driving expression of ARG1 to limit expression to myocytes or hepatocytes, respectively.
Results
Codon-optimized ARG1 results in increased expression
Human 293 cells were transfected in culture by one of three plasmids to assess change in the level of expression by codon optimization (co) of the murine ARG1 cDNA: CBA promoter-ARG1, CBA promoter-ARG1-woodchuck postregulatory enhancer (WPRE), and CBA promoter-coARG1 (Figure 1). The results demonstrated that expression with the codon-optimized form of the cDNA increased expression over 100% of the wild-type cDNA (P = 0.03), while arginase expression was similar between the CBA promoter-ARG1 and CBA promoter-ARG1-WPRE transfected cells (P = 0.70) (overall P value of 0.008).
Figure 1.

Codon-optimized arginase cDNA improves arginase expression levels. HEK293 cells were transfected with plasmids to assess the function of a codon-optimized version of murine arginase compared to the wild-type cDNA; studies were performed in duplicate. Plasmid DNA was transfected into 293 cells and arginase activity was examined 2 days later.
Comparison of ubiquitous and tissue-specific promoters for expressing ARG1 in hepatic and striated muscle
AAVrh10 vectors were developed carrying either the ubiquitously expressing CBA promoter, the liver-specific thyroxine-binding globulin promoter (TBG), or the CK8 regulatory cassette, containing modified components from the mouse M-creatine kinase enhancer and proximal promoter that exhibit high-level striated muscle-specific expression in both cardiomyocytes and skeletal muscle fibers.20 These were ligated to a luciferase transgene and 3 × 10¹² genome copies/kg were administered intravenously to mice on the second day of life (DOL) followed by bioluminescence imaging at 3 weeks of age. Figure 2a demonstrates the areas of gene expression in 3-week-old mice. With the TBG promoter, expression is almost exclusively restricted to the liver (white arrow). Animals injected with the CBA promoter exhibit expression throughout most tissues with highest expression in the heart (red arrow) and liver. With the CK8 promoter, bioluminescence is present throughout the animal, due to the bodywide distribution of skeletal muscle,21 but is particularly high in skeletal myocytes of the lower extremities (orange arrow) and abdomen, and the cardiac myocytes of the heart.
Figure 2.
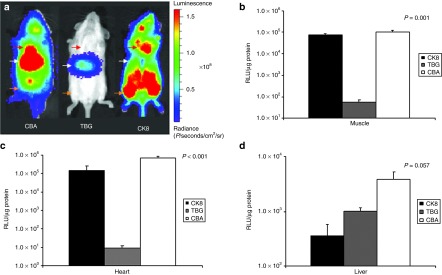
Whole-mouse luciferase expression to assess promoter activity and tissue specificity. Mice were injected intravenously with 3 × 10¹² genome copies/kg of AAV serotype rh10 expressing luciferase on neonatal day 2. At 3 weeks of age, whole-animal bioluminescent imaging and tissue luminometry was performed to assess expression in different tissues in wild-type animals. (a) In vivo bioluminescent imaging demonstrates photon diffusion patterns among representative images. Left panel: CBA promoter exhibits expression in the heart (red arrow) and the liver (white arrow). Middle panel: Liver-specific thyroxine-binding globulin promoter exhibits expression in the liver (white arrow). Right panel: The striated muscle-specific CK8 regulatory cassette exhibits expression in the heart (red arrow) and skeletal muscle (orange arrow). For all groups, images were acquired with the mice in the ventral position. Images were set with the same references such that side-by-side comparison can be made. After removal of individual tissues, levels of luciferase protein expressed as relative light units (RLU) per µg protein was compared in skeletal muscle (b), the heart (c), and the liver (d). (Data is presented as mean + SD with n of 3–5 per tissue.)
Luminometry of dissected tissues corroborated the bioluminescent findings (Figure 2b–d). At 3 weeks of age, the CBA promoter (white) demonstrated the highest expression in skeletal muscle (Figure 2b) (1.0 × 10⁵ ± 5.4 × 10⁴ relative light units (RLU)/µg protein), followed by the CK8 promoter (7.6 × 10⁴ ± 2.4 × 10⁴ RLU/µg protein), while the TBG promoter (5.4 × 101 ± 3.7 × 101 RLU/µg protein) had negligible expression (P = 0.51 comparing CK8 and CBA promoters, P = 0.01 comparing CK8 and TBG promoters, and P = 0.04 comparing CBA and TBG promoters) (Overall P value 0.001). In the heart (Figure 2c), a similar expression pattern was seen: expression was highest with the CBA promoter (6.0 × 10⁵ ± 2.2 × 10⁵ RLU/µg protein), followed by the CK8 promoter (1.6 × 10⁵ ± 1.1 × 10⁵ RLU/µg protein), with minimal expression by the TBG promoter (9.6 × 100 ± 2.5 × 100 RLU/µg protein) (P = 0.04 comparing CBA and CK8 promoters, P = 0.04 comparing CK8 and TBG promoters, and P = 0.01 comparing CBA and TBG promoters) (Overall P < 0.001). Examination of hepatic expression (Figure 2d) demonstrated that the CBA promoter was nearly four times stronger than the TBG promoter (3.8 × 10³ ± 3.2 × 10³ versus 1.0 × 10³ ± 3.6 × 10² RLU/µg protein) whereas expression of the CK8 promoter was only about 10% of the CBA promoter in the liver (3.6 × 10² ± 4.7 × 10² RLU/µg protein) (P = 0.02 comparing CK8 and CBA promoters, P = 0.03 comparing CK8 and TBG promoters, and P = 0.11 comparing CBA and TBG promoters) (Overall P value 0.057). This is probably due to CK8 expression by hepatic myofibroblasts.21 (All were n = 3–5 per group and data is expressed as average ± SD). We have previously demonstrated that expression does decline, particularly in the liver, over the next several weeks as the animals reach maturity and adult organ size.15 With respect to the relative expression levels of the CBA and CK8 promoters in skeletal and cardiac muscle, it should be noted that CBA drives expression in myocytes as well as in the many nonstriated muscle cells in these tissues, whereas CK8 has almost no transcriptional activity in nonmuscle cells. Thus, the slightly higher luminometry data observed with CBA may not be due to higher CBA than CK8 promoter activity in myocytes, but rather due to the additional expression by nonmuscle cells.20
Widespread and liver-only expression of ARG1 results in long-term survival of ARG1-deficient mice
ARG1−/− mice received an intravenous injection on the second DOL of one of the following AAV vectors: (i) 3 × 10¹³ genome copies per kilogram (gc/kg) of rAAVrh10-CBA-ARG1-WPRE (n = 45); (ii) 1 × 10¹⁴ gc/kg of rAAVrh10-TBG-coARG1 (n = 42); (iii) 8 × 10¹³ gc/kg rAAVrh10-CK8-coARG1 (n = 8); (iv) 1 × 10¹⁴ gc/kg of rAAVrh10-TBG-luciferase (n = 4); and (v) 1 × 10¹⁴ gc/kg rAAVrh10-CK8-luciferase (n = 5). In addition, a group of littermate controls (n = 34) (heterozygotes) and untreated ARG1−/− (n = 38) were included and followed.
In the control groups, DOL two ARG1−/− mice injected intravenously with 1 × 10¹⁴ gc/kg with AAV rh10 carrying a reporter gene (luciferase) driven by either the TBG promoter or the CK8 regulatory cassette all perished by DOL 18 (P < 0.0001 when compared with ARG1+/− littermate controls) (Figure 3). Similarly, all untreated ARG1−/− mice were dead by DOL 14 (P < 0.0001 when compared with littermate controls). Untreated ARG1−/− mice and rAAV-luciferase-treated ARG1−/− animals were either found dead or were in extremis and then killed. Other ARG1−/− mice treated with rAAV rh10-ARG1 gene therapy were killed for blood collection and tissue harvesting. The ARG1−/− mice treated with the CBA vector expressing ARG1 exhibited better long-term survival (P = 0.08 compared to littermate controls) than those treated with the TBG vector expressing ARG1 (P = 0.0001 compared to littermate controls), about 90% versus 60% survival to day 240 (end of study for TBG mice), compared to littermate controls (97% survival at 1 year). However, ARG1−/− mice treated with the muscle-specific CK8 promoter expressing ARG1 did not exhibit improved survival with all animals dying by DOL 14: CK8-ARG1 versus CK8-luciferase, P = 0.99; CK8-arginase versus untreated, P = 0.28; CK8-arginase versus normal ARG1+/− littermates, P < 0.0001.
Figure 3.

Rescue of ARG1−/−mice. Survival comparisons in days between untreated ARG1−/− mice (n = 38), littermate controls (n = 34) (heterozygotes), and ARG1−/− mice injected with rAAVrh10-CBA-ARG1-WPRE (n = 45), rAAVrh10-TBG-coARG1 (n = 42), rAAVrh10-CK8-coARG1 (n = 8), rAAVrh10-TBG-luciferase (n = 4), and rAAVrh10-CK8-luciferase (n = 5). (*= end of study).
AAV expression in myocytes is long-lived and results in improved control of hyperargininemia compared to hepatocyte-only expression
Endogenous ARG1 activity is primarily found in the liver with minimal or no contribution from the heart, kidney, and skeletal muscle (Figure 4a). Hepatic arginase activity also increases several fold over the first month of life. In contrast, 2-day-old AAV-treated neonatal ARG1−/− mice with AAV expressing arginase from the CBA promoter, exhibit early expression in the liver but this declines over the next 2 months to levels indistinguishable from the assay background (Figure 4b). As we have previously demonstrated, this decline is due to the rapid loss of AAV episomes in these animals (14 and Figure 5g). However, cardiac expression remains high (with some decline at 8 months of life) and skeletal muscle expression remains modest (Figure 4b). Immunohistochemical examination of tissues in these mice demonstrates myocyte expression of arginase in both cardiac and skeletal muscle (Figure 5c,f). Furthermore and unlike the liver, AAV copy number in cardiac and skeletal myocytes remains relatively stable over this time (Figure 5g). Additionally and irrespective of its nonhepatic source, ARG1, expressed by the CBA promoter provides modest control of ammonia and results in plasma arginine levels being about normal as previously reported (in ref. 14).
Figure 4.

Arginase activity in different tissues depends on the promoter. Total protein was isolated from liver, heart, kidney, and skeletal muscle of either control littermate heterozygotes (a) or ARG1−/− mice that were injected intravenously on neonatal day two with AAV carrying either the (b) chicken β-actin promoter/CMV enhancer or (c) the liver-specific thyroxine-binding globulin promoter linked to the codon-optimized ARG1 cDNA. Arginase activity was measured with a colorimetric assay determining the quantity of urea converted from arginine by each tissue lysate. Results are expressed as mean ± SD. (Heterozygote, CBA, TBG, respectively: 7 days: n = 23, 9, 12; 1 month: n = 8, 9, 6; 2 months: n = 10, 7, 4; 4 months: n = 4, 4, 4; 8 months: n = 4, 4, 5.)
Figure 5.

Immunohistochemical analysis of cardiac and skeletal muscle expression of arginase following rAAV-ARG1 administration to ARG1−/−neonatal mice. Neonatal ARG1−/− mice were intravenously injected with AAV-TBG-coARG1, AAV-CK8-coARG1 or AAV-CBA-ARG1. Immunostaining for murine arginase is shown for cardiac muscle: (a) AAV-TBG-coARG1; (b) AAV-CK8-coARG1; (c) AAV-CBA-ARG1) and skeletal muscle: (d) AAV-TBG-coARG1; (e) AAV-CK8-coARG1; (f) AAV-CBA-ARG1). TBG and CBA mice were 4 months old when killed and CK8 mice were 2 weeks old when killed due to their hyperammonemic symptoms. (g) AAV genome copy numbers in liver, skeletal and cardiac muscle were analyzed at selected time points, and are plotted as the mean ± SD (n = 3–5 per group). AAV, adeno-associated viral vector.
A different picture is seen with ARG1−/− mice treated with AAV-expressing arginase from the TBG promoter (Figure 4c) where expression is almost exclusively hepatic. Even though these mice were administered a larger dose with the codon-optimized cDNA to compensate for the decreased strength of the TBG promoter compared to the CBA promoter, early hepatic expression was about half that of the CBA-treated mice (Figure 4b); and then, as seen with the CBA promoter, hepatic expression declined over the first 2 months of life such that the sensitivity of the assay could not detect differences from background.
Ammonia (Figure 6a), arginine (Figure 6b) and glutamine (Figure 6c) were less well-controlled in treated AAV-TBG-coARG1-injected ARG1−/− animals compared to control ARG1+/− mice. There were also substantial differences between the plasma levels of other important urea cycle-related amino acids (Table 1).
Figure 6.

Improvement of plasma urea cycle metabolite levels following neonatal delivery of rAAV-TBG-coARG1. Plasma metabolite levels were measured at ~1 and 3 weeks, and then monthly thereafter in the AAV-TBG-coARG1-injected ARG1−/− animals. Metabolites examined were: (a) ammonia, (b) arginine, and (c) glutamine. In (a) ammonia levels in untreated ARG1−/− mice were measured in clinically ill animals as these mice all died from hyperammonemia by day 18. Heterozygous controls were included for comparisons. All samples levels are plotted as mean ± SD, n = 3–4 per group. AAV, adeno-associated viral vector.
Table 1. Ammonia and urea cycle-related amino acids in AAV gene therapy studies to arginase knockout mouse model and controls.

The decline in hepatic expression of the TBG promoter-mediated arginase corresponded to a dramatic decline, in the first month of life, of arginase expression in the liver (Figure 7a–g) and the hepatic AAV viral copy number (>2 logs) (Figure 5g). After an initial decline in arginase expressing cell numbers over time, clusters of cells were detected by immunohistochemistry (Figure 7f, g). In these animals, renal expression of arginase also appears to increase with time (Figure 4c).
Figure 7.
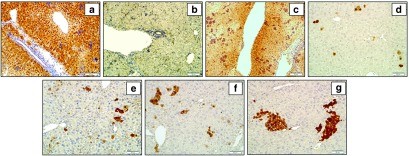
Immunohistochemical detection of arginase expression in hepatocytes at progressive times following neonatal delivery of rAAV-TBG-coARG1 to ARG1−/−mice. Representative images show arginase in the hepatocytes of: (a) untreated wild type age day 7 and (b) untreated ARG1−/− day 7 mice and in AAV-TBG-treated ARG1−/− mice: (c) AAV-TBG-treated ARG1−/− day 7 of age, (d) AAV-TBG-treated ARG1−/− 1 month of age, (e) AAV-TBG-treated ARG1−/− 2 months of age, (f) AAV-TBG-treated ARG1−/− 4 months of age, and (g) AAV-TBG-treated ARG1−/− 8 months of age following rAAV-TBG-coARG1 delivery. AAV, adeno-associated viral vector.
Taken together, these data suggest improved survival following neonatal delivery and better biochemical parameters with both hepatic and myocyte expression of ARG1 driven by the CBA promoter compared to hepatocyte-specific expression. This is probably due to the substantial vector loss from dividing hepatocytes. Additionally, the total number of transduced cells that express arginase is almost certainly greater when using the constitutively active CBA promoter.
Guanidino compounds are elevated in mice with liver-only expression of ARG1
We also examined the levels of two plasma guanidino compounds in mice (which appeared phenotypically normal) that received AAVrh10 expressing arginase by the TBG promoter and compared these to heterozygous controls. The guanidino group of arginine is needed to yield guanidinoacetate (GAA) and, subsequently, creatine by transaminidation. The treated ARG1−/− mice demonstrated nonstatistically significant elevations in creatine compared to heterozygous controls (236.8 ± 189.0 µmol/l (treated knockout) versus 129.8 ± 28.6 µmol/l (heterozygous control), P = 0.25 (n = 5 per group)) (untreated ARG1−/− 300.0 ± 158.04 µmol/l). While untreated ARG1−/− mice have very high GAA levels (13.52 ± 6.35 µmol/l), GAA was improved in treated animals but remained with a statistically significant difference (9.5 ± 4.8 µmol/l) compared to heterozygous controls (2.7 ± 0.5 µmol/l) (P = 0.01 (n = 5 per group)) (both mean ± SD). However, from a behavioral standpoint the treated ARG1−/− mice appeared normal.
Muscle-specific expression does not prolong survival but does improve hyperargininemia
The effect of restricting therapeutic arginase expression to striated muscles was examined by injecting 2-day neonatal ARG1−/− mice with 8 × 10¹³ gc/kg AAVrh10 carrying the highly muscle-specific CK8 regulatory cassette (n = 8). ARG1 expression in striated muscle controlled plasma arginine to normal levels (502.0 ± 183 µmoles/l, n = 6; versus 2,898.1 ± 1,185.6 µmol/l, n = 4, P = 0.001 in untreated ARG1−/− mice (Figure 8a)); there was no statistically significant difference in plasma arginine levels between heterozygotes and AAV-CK8-treated mice (P = 0.69) (overall P < 0.001). This finding was consistent with the detection of significantly elevated arginase levels in the heart and skeletal muscles of the treated ARG1−/− mice (Figure 8b). Additionally, while expression in skeletal muscle fibers was substantially less than cardiomyocytes (see also Figure 5b,e), the abundance of skeletal muscle would provide for a relatively large total amount of low-level arginase activity if transduced systemically. However, among the CK8 ARG1-treated mice, six still became profoundly ill with clinical evidence of hyperammonemia on day 13 and the remaining two became ill on day 14. ARG1 activity in striated muscle tissues was thus not beneficial in terms of counteracting the hyperammonemic phenotype of ARG1−/− mice as their plasma ammonia levels were about 16-fold higher than those of ARG1+/− littermate controls (Figure 8c). (Comparing plasma ammonia between heterozygotes and untreated knockouts or AAV-CK8-treated knockouts, the P value for both was <0.05 while comparing plasma ammonia levels between untreated knockouts and AAV-CK8-treated knockouts, there was no difference (P = 0.74) (overall P = 0.018).
Figure 8.
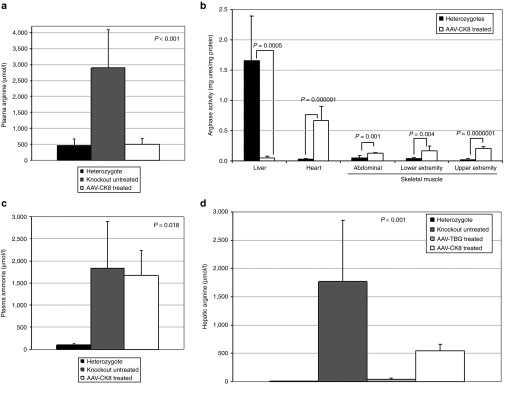
Plasma ammonia and arginine and arginase activity in selected organs after AAV-CK8-coARG1 delivery to neonatal mice. Animals were examined 2 weeks after intravenous administration of AAV-CK8-coARG1. Plasma arginine (a) and ammonia (c) in these mice was compared to untreated ARG1−/− and heterozygote littermate control mice. Selected organs and tissues (b) were examined for arginase expression (heterozygotes: liver, n = 5; heart, n = 9; skeletal muscle of abdomen, n = 9, lower extremity n = 5, upper extremity n = 5; and AAV-CK8-coARG1-injected ARG1−/−: liver, n = 6; heart, n = 6; skeletal muscle of abdomen, n = 9, lower extremity, n = 6, upper extremity, n = 6). Hepatic arginine was examined also (d) and compared with untreated ARG1−/−, heterozygote, and ARG1−/− mice treated with AAV-TBG-coARG1 (heterozygotes n = 5, ARG1−/− untreated n = 4, ARG1−/− AAV-TBG-treated n = 5, AAV-CK8-treated n = 6). All samples are expressed as mean ± SD. AAV, adeno-associated viral vector.
When these studies were begun, it was not possible to know if reducing or normalizing arginine in the periphery would normalize arginine levels in the liver. From these 2-week-old mice, we prepared lysates of the liver from heterozygotes, untreated ARG1−/−, and ARG1−/− mice that received either AAV with the liver-specific promoter or with the muscle-specific regulatory cassette. These studies demonstrated that, as expected, the heterozygotes had very low levels of hepatic arginine as did the animals treated with the liver-specific AAV (7.7 ± 2.2 µmol/l, 32.6 ± 28.9 µmol/l (P = 0.06)). Also as expected, untreated ARG1−/− mice demonstrated markedly elevated hepatic arginine levels (1,766.2 ± 1,087.9 µmol/l). However ARG1−/− mice treated with AAV expressing arginase from the CK8 regulatory cassette demonstrated markedly reduced hepatic arginine levels of about one-third that of untreated animals (543.0 ± 114.0 µmol/l) (P = 0.0003 when compared with untreated knockouts) (Figure 8d) suggesting that peripheral metabolism of arginine is able to partially deplete the very high levels of arginine in the liver (overall P < 0.001).
Discussion
ARG1-deficient mice were previously generated in our laboratory and these mice completely lack liver ARG1 activity. Plasma ammonia levels of ARG1-deficient mice in metabolic crisis are increased greater than 10-fold and their livers are abnormal with histopathological features similar to those seen in human arginase-deficient patients who died with hyperammonemia later in life.22 ARG1−/− mice on the C57BL/6 strain typically die by day 14 while the untreated murine model on the NIH-Swiss background that was used for the studies described here, die by days 14–17; and all untreated animals die with hyperammonemia, hyperargininemia, and evidence of neurologic injury. Our earlier studies with a neonatally administered helper-dependent adenoviral vector expressing murine ARG1 under the control of a liver-specific PEPCK gene promoter demonstrated that short-term phenotypic correction of this disease was possible in mice; however due to loss of vector with hepatocyte division, all treated mice still died by day 27 of life.23 More recently we have demonstrated that ARG1−/− mice treated as neonates with AAV expressing wild-type murine ARG1 by a ubiquitous (CBA) promoter can lead to long-term survival; however the animals remained vulnerable to nitrogen crises if challenged.11
The main findings described in this manuscript are: (i) The codon-optimized version of murine ARG1 demonstrates higher expression than the wild-type cDNA; (ii) the ubiquitous-expressing (CBA) promoter leads to higher hepatic levels of expression than a liver-specific regulatory element (TBG); (iii) both the CBA and the TBG promoters result in rapid hepatic loss of AAV vector episomes in the first month of life while vector copy number is maintained at higher levels in heart and skeletal muscle for many months with the CBA promoter; (iv) arginase expression from the CBA promoter leads to peripheral metabolism of arginine keeping plasma arginine levels controlled whereas the TBG promoter does not control plasma arginine as well likely due to loss of vector with hepatocyte proliferation and (v) the muscle-specific CK8 regulatory cassette can control plasma arginine levels by muscle-specific arginine metabolism and thus reduce intrahepatic arginine; however animals are not protected from hyperammonemia due to lack of hepatic expression of arginase.
In these studies, we attempted to ascertain whether arginase expression in myocytes may have a therapeutic benefit in the treatment of arginase deficiency. This seemed possible since skeletal muscle tissue accounts for 42 and 36% of body mass in average adult males and females.24 Transduction of these nondividing myofibers could thus provide a distinct advantage for the treatment of arginase deficiency for at least two important reasons. First, the loss of episomal AAV vector in hepatocytes after injection in neonatal mice15,25 and nonhuman primates (in the first week of life)26 is substantial and relatively few vector genomes remain by the time the animals reach adulthood; however, relatively rare small clusters of liver cells exhibit persistent ARG1 expression. A similar loss of genomes would be expected with administration to a human neonate. As the hepatic loss of vector genomes occurs, and as also demonstrated in mice injected with AAV carrying a liver-specific regulatory cassette (Figure 5g), ammonia is less well-controlled (Figure 6a). Additionally, survival is inferior to that of mice injected with AAV carrying the ubiquitously expressing CBA promoter that maintains arginase in both myocytes and liver (albeit at low levels in hepatocytes) thereby controlling plasma arginine levels.
Second, in ARG1−/− mice, striated muscle appears to peripherally metabolize arginine when expressing ARG1. Consequently, the relatively large total striated muscle tissue mass, even if limited in its transduction to low-level arginase expression, provides substantial capacity for metabolizing both muscle-derived and peripheral arginine delivered via the plasma. Furthermore, since myocytes are generally postmitotic at birth,18,27 the loss of episomal AAV with animal growth is substantially less15 than in hepatocytes.
When we began these studies it was unknown if the ARG1 reaction could occur outside of the liver, and if so whether it would result in survival and biochemical benefit to ARG1 deficient mice. Although there was every reason to believe the liver was not necessary for ARG1 activity, we did not know a priori if in vivo enzymatic activity would require tissue-specificity. In addition, while ARG1 may be part of a larger complex in the liver, there was no evidence of this elsewhere; and the presence of ARG2, the second isoform which is extrahepatic, suggested that ARG1 would likely function in striated muscle. Other supportive evidence included findings demonstrating that ARG1 does not require any cofactors. However, what remained unknown was if the mechanism of Mn2+ ARG1 activation was hepatic-specific.
Our results demonstrate that ARG1 expression in muscle leads to improved control of hyperargininemia and elevated hepatic arginine by peripheral metabolism of plasma arginine. While this was suggested by the previous ubiquitous promoter AAV studies,14 current neonatal results with AAV delivery of ARG1 driven by the muscle-specific CK8 regulatory cassette demonstrate that plasma arginine levels as well as initial mouse growth and development are near normal prior to death at 2 weeks with metabolic and clinical evidence of hyperammonemia. However there is an important caveat. As mouse survival was only of 2 weeks, the true duration of muscle-specific ARG1 expression from AAV-CK8 is not known. It is possible if immunologic tolerance was not present or did not develop to ARG1 because of lack of the presence of ARG1 protein (during thymic selection), immune responses to this transgene-encoded protein could potentially develop. However, the presence of endogenous murine ARG2 (NM_009705.3) expression in these animals, with 55.5% sequence homology to ARG1 (NM_007482.3),28 may decrease the risk of humoral immune responses since some potential epitopes would be shared between these proteins.
These studies demonstrate that ARG1 expression in striated myocytes could reduce the total burden of arginine in the first 2 weeks of life, but could not, at the dose of AAV administered, reduce the elevated liver levels completely. Given the size of the liver as compared to the whole animal, we can speculate that about two-thirds of the arginine burden was reduced by the muscle expression. There are at least two explanations why there was no mitigation of the hyperammonemia. First, in ARG1 deficient mice, decreasing hepatic arginine, even to normal levels, may not eliminate the need for arginase on site to mitigate the hyperammonemia and that this might not occur even if the arginine level could be reduced completely to normal. This could be due to compartmentalization of urea cycle activity with high arginine in the periportal area where the urea cycle functions. The second explanation is that the AAV CK8 vector at the dose administered did not lower arginine enough to unleash the urea cycle itself. This could only be tested by developing a more powerful muscle-specific promoter, possibly markedly increasing the dose of vector, or developing a transgenic mouse with high-level muscle-specific expression of ARG1 and subsequently reducing liver arginine to normal or showing that it is impossible to do so. Taken together, these data demonstrate that arginine can be metabolized outside of the liver in muscle to correct plasma hyperargininemia and this extrahepatic expression has little or no effect on the control of ammonia at the level of expression attained.
These studies have a direct potential implication for human arginase deficiency gene therapy strategies. We propose that when this disorder is diagnosed in a neonate by newborn screening that treatment via AAV vectors expressing arginase from a ubiquitous-expressed promoter would be initially advantageous to assist with ureagenesis. Then, although hepatic AAV episomes would decline with hepatocyte proliferation during liver growth, plasma arginine levels would be maintained in a normal range as transduced myocytes would metabolize arginine peripherally. Later in life, it may then be desirable to augment arginase expression by intravascular administration of AAV (most likely employing a different AAV serotype) expressing ARG1 from a muscle-specific promoter to assist in the control of plasma arginine. Although ureagenesis itself may not be of benefit from striated muscle ARG1 expression, this might not be critical since hyperammonemia is uncommon in these patients.29 Additionally, muscle specific regulatory cassettes are not expressed in immune system antigen-presenting cells,30 and thus tend to cause fewer immunological problems associated with immunologically novel therapeutic proteins.
In the case of null-expressing mutations diagnosed in juvenile and adult patients, establishing expression in the liver may allow for tolerance induction to the transgene-encoded protein.31,32 In addition, the early neonatal ubiquitous and persistent expression may also have a role in induction of immunological tolerance in patients with truncation mutations. If the immunologic data from murine models by our group14,16,33 and others and those from nonhuman primates presently under investigation (unpublished data) hold true in humans, tolerance to the transgene encoded protein could be induced.
For juvenile and adult patients with arginase deficiency, administration of AAV expressing ARG1 with a ubiquitous promoter may be most appropriate to control plasma hyperargininemia and correct other biochemical abnormalities which are poorly controlled by today's onerous oral therapies and dietary modifications. However, determining whether ARG1 cross-reactive immunologic material was present and the nature of the ARG1 gene defect would be important before administration since epitopes not shared with ARG2 might lead to immune responses in cross-reactive immunologic material-negative patients. As the most frequent presentation of arginase deficiency in humans results in childhood (not neonatal) onset of hyperargininemia and rarely in hyperammonemia, gene-based therapy utilizing muscle-specific expression strategies may have substantial utility in treating these affected patients and should overcome the issues of hepatic episomal AAV vector loss.
Materials and Methods
AAV plasmid construction and virus production. Codon optimization of the murine arginase1 cDNA was performed by DNA2.0 (Menlo Park, CA).
CBA noncodon-optimized ARG1 WPRE. This construct has been previously described.14
CBA noncodon-optimized ARG1. The noncodon-optimized murine arginase cDNA was amplified from a pre-existing plasmid in our laboratory using PfuUltra II Fusion HotStart DNA Polymerase (Cat#600670, Agilent Technologies, Santa Clara, CA) using Forward Primer: NOP mAI F (EcoRI) 5′- CGG AAT TCA TGA GCT CCA AGC CAA AGT CCT TA-3′ and Reverse Primer: NOP mAI R (KpnI) 5′ CGG GGT ACC TCA CTT AGG TGG TTT AAG GTA-3′ with denaturation at 95 °C for 2 minutes, 40 cycles of 95 °C for 30 seconds, 63 °C for 30 seconds, and 72 °C for 3 minutes with a prolonged extension after for 3 minutes. The PCR amplicon was digested with EcoRI and KpnI as was the p1044 plasmid followed by ligation.
TBG codon-optimized ARG1. The codon-optimized arginase cDNA was released from the p68037 plasmid (DNA 2.0, Menlo Park, CA) by digesting at Kpn I and Mlu I. The AAV plasmid p1015 (University of Pennsylvania) was digested with Mlu I and Kpn I and ligated with the codon-optimized murine ARG1 cDNA.
TBG luciferase. pGL-3 (Promega, Madison, WI) was digested with Xba I followed by blunting. After inactivation, the plasmid was digested with Kpn I and the luciferase cDNA was isolated by cutting the band from an agarose gel. P1015 was digested with Hinc II and Kpn I and luciferase was ligated with the plasmid by directional cloning.
CK8 luciferase. TBG luciferase was digested with Bgl II followed by blunting. After inactivation, the blunted TBG luciferase was digested with Nhe I to get rid of the TBG promoter by cutting the band from an agarose gel. Plasmid of pCK8CAT-4436bp was digested with Sal I followed by blunting. After inactivation, the blunted pCK8CAT-4436bp was digested with Nhe I. The CK8 promoter was released by cutting the band from an agarose gel and the CK8 promoter was ligated with TBG-free luciferase plasmid DNA.
CK8 codon-optimized ARG1. The liver-sp-codonoptmAI plasmid was digested with Nye I. This digest releases the liver specific promoter from the plasmid. The 4.5 kb band containing the backbone and the codonoptmAI was then purified. The pCK8CAT plasmid was digested with Nhe I and Sal I to release the CK8 regulatory cassette which was then purified. The two products were ligated and the correct clone was identified by using Not I and Pvu II.
AAV vectors were packaged into serotype rh10, purified by cesium chloride centrifugation, and titered by qPCR as previously described.15
In vitro cellular testing. To compare the level of arginase expression between codon-optimized and noncodon-optimized plasmids, CBA-ARG1, CBA-ARG1-WPRE, and CBA codon-optimized ARG1 plasmids were tested in duplicate by transfecting 200,000 HEK-293 cells using calcium phosphate-mediated transfection by standard methods. Two days after transfection, cells were harvested with a cell scraper and arginase activity was measured with a colorimetric assay determining the quantity of urea converted from arginine by each tissue lysate (as below).
Bioluminescent imaging and tissue luminometry. Bioluminescent imaging of luciferase expression was performed as previously described15 as was tissue luminometry.15
Mouse procedures. The targeted ARG1 allele contains a deletion in exon 4 of the ARG1 gene.22 All mice were housed under specific pathogen-free conditions; food and water were provided ad libitum. All mice were kept according to the National Institutes of Health guidelines and all experimental procedures were conducted in accordance with guidelines for the care and use of research animals at our institution. Two-day neonatal mice were injected via the superficial facial vein with recombinant AAV diluted in pharmaceutical grade saline. The injections were performed in a total volume of 50 µl. Male and female mice were equally represented throughout the study. After the vector injection, scheduled blood sampling was taken from retro-orbital plexus. Plasma was frozen immediately and stored at −80 °C until analysis.
PCR genotyping. Genomic DNA was prepared from tail tip by standard methods. Anion-exchange column-purified genomic DNA was subjected to PCR for genotyping. Primer sets for wild-type gene: KO reverse primer: Exon 5 reverse 5′-ACGATGTCTTTGGCAGATATGC-3′ and wild-type forward primer: mAI forward 5′-AACCAGCACCTCTAAGGTCTATGG-3′. Primer sets for KO: wild type/KO reverse primer: Exon 5 reverse 5′-ACGATGTCTTTGGCAGATATGC -3′ and KO forward primer: Neo forward 5′-GCCCATTCGACCACCAAG-3′. Cycle parameters: Denaturation: 94 °C for 30 seconds, Annealing: 60 °C for 30 seconds, Elongation: 72 °C for 3 minutes for 40 cycles using DNA polymerase (Takara, Mountain View, CA, Catalog #RR006A).
Metabolite and ammonia analysis. Plasma amino acid analysis was performed on a Biochrom 30 HPLC amino acid analyzer (Biochrom, Cambridge, UK). In brief, 30–50 µl of plasma was mixed with equal volumes of Biochrom Seraprep (Pickering Laboratories, Mountain View, CA) and Lithium dilution buffer (Biochrom). Protein was precipitated by centrifugation and 10 µl of supernatant was injected into the analyzer. Physiological amino acid standard (Sigma-Aldrich, St. Louis, MO) was used to calibrate and determine analyte concentration. Data analysis was performed using EZchrom Elite software (Agilent Technologies). Liver amino acid levels were similarly measured after the tissue was weighed and homogenized in water to a concentration of 0.2 g/ml. The supernatant was then removed and sonicated and 1 ml was removed, followed by the addition of 70 mg of sulfosalicylic acid. The samples were then centrifuged and the lysates were processed as above. Ammonia was determined in 20 µl plasma samples by reductive amination of 2-oxoglutarate and oxidation of nicotinamide adenine dinucleotide phosphate employing a commercial kit (Sigma-Aldrich).
Biochemical analysis of GAA and creatine in plasma. A detailed description of the methods used to determine the plasma creatine and GAA levels was published previously.34 Briefly 30 µl of plasma was used. Proteins were precipitated from plasma with acetonitrile. The samples were derivatized (3N HCl in N-Butanol, Regis Technologies, Morton Grove, IL) before injection into the Waters Acquity ultra performance liquid chromatography (UPLC) MS/MS (Waters Corporation, Milford, MA). UPLC was performed on an Atlantic HILIC column (Waters Corporation) (2.1 × 100 mm, 5 µm). An isocratic 95% acetonitrile solution containing 0.05% formic acid was used as the running buffer at 0.2 ml/minute. Other settings were as follows: ESI+, Source temperature, 130 °C; desolvation temperature, 350 °C; collision energy, 15 eV; nebulizer gas, 60–90 l/hour; desolvation gas, 500 l/hour. Data were acquired and processed using Waters Masslynx software (Waters Corporation).
Immunohistochemistry for arginase expression. Tissues were removed from killed animals and placed in 4% paraformaldehyde for 18–24 hours. After rinsing with tap water for 15 minutes, tissues were placed in 70% ethanol followed by routine processing and embedding in paraffin. Tissue sections (4–5 µm thick) were deparaffinized and rehydrated with ethanol and xylene by routine procedures Slides were removed from tap water and placed in a microwaveable vessel filled with sodium citrate buffer (10 mmol/l sodium citrate, 0.05% Tween 20, pH 6.0) for antigen retrieval. Tissues were then permeabilized with 1× Tris-buffered saline (TBS) + 0.2% Triton X-100 (Pierce Biotechnology, Rockford, IL) for 5–10 minutes followed by 1× TBS + 0.025% Triton X-100 for 5 minutes. Tissues were blocked with protein blocker (Dako, Carpinteria, CA; Cat# X0909) + 0.1% Tween 20 for 20 minutes. Primary antibody was applied to the sections: Rabbit arginase I (H-52) antibody (Santa Cruz Biotechnology, Santa Cruz, CA; catalog number sc-20150) diluted in protein blocker +0.1% Tween 20 at 1:50 ratio and incubated overnight at 4 °C. After rinsing twice for 5 minutes with 1×TBS 0.025% Triton slides were incubated in 0.3% H2O2 in TBS for 15 minutes followed by application of the secondary antibody (Goat antirabbit IgG-HRP (Santa Cruz, catalog number sc-2301) (1:100 in protein blocker + 0.1% Tween 20)) and incubated 1 hour at room temperature. After rinsing three times with 1×TBS, slides were developed with ImmPACT DAB kit (Vector, Burlingame, CA; Cat# SK-4105) for 3 minutes at room temperature. Slides were counterstained with hematoxylin and coverslipped. Slides were analyzed using an Olympus BX40 microscope and images were captured with cellSens software (Olympus, Center Valley, PA).
AAV vector copy number analysis
Wild-type arginase. At regular intervals, mice were killed and skeletal muscle, heart, and liver were removed. Genomic DNA was extracted using the DNAEasy Kit (Qiagen, Valencia, CA) and quantitated by nanodrop (Implen, Westlake Village, CA). Using real-time quantitative PCR (MyIQ2; Bio-Rad Laboratories, Hercules, CA) of the HGH polyadenylation signal (Forward primer: 5′AATCTTGGCTCACTGCAATCTCCG3′, Reverse primer: 5′CATGCAT GCCTGGAATCCCAACAA3′) with SsoAdvanced SYBR Green Supermix (Bio-Rad), quantification of vector genomes in DNA was determined in duplicate as previously described.11
Codon-optimized arginase. At regular intervals, mice were killed and liver tissue was removed. Genomic DNA was extracted using the DNAEasy Kit (Qiagen) and quantitated by nanodrop (Implen, Westlake Village, CA). Using real-time quantitative PCR (MyIQ2; Bio-Rad Laboratories) for TBG-codon-optimizedArg virus detection. (Forward primer: 5′GGT GGC CCT CAC GCT TGC TT 3′, Reverse primer: 5′ATC CCC CGG GCT GCA GGA AT 3′) with SsoAdvanced SYBR Green Supermix (Bio-Rad), quantification of vector genomes in DNA was determined in duplicate.
Determination of arginase levels. Arginase activity of lysates was measured by a colorimetric assay described previously.23,35 Livers were homogenized in 40 µl of 0.1% Triton X-100 and 1×HALT protease inhibitor cocktail (Pierce Biotechnology) per mg tissue. About 10 µl of lysate was diluted with lysis buffer to a final volume of 100 µl, and added to 50 µl of 50 mmol/l Tris–HCl (pH 7.5) and 50 µl of 10 mmol/l MnCl2. Arginase was activated by heating sample at 56 °C for 10 minutes. About 25 µl of 0.5 mol/l l-arginine (pH 7.9) was added in to 10 ul of the above sample mixture and incubated at 37 °C for 1 hour. Then 65 μl of ddH2O was added to adjust the final volume to 100 µl. The conversion of arginine to urea was stopped by the addition of 400 µl of acid mix (1:3:7 mixture of H2SO4 (96%):H3PO4 (85%):water). About 25 µl of 0.9% 1-phenyl-1,2-propanedione-2-oxime dissolved in 100% ethanol was added and heated to 95 °C for 30 minutes for color development. About 200 µl of each sample was measured for absorbance at 540 nm. Urea standards ranging from 0.03 to 0.5 µmol were used to create a calibration curve for each assay. Arginase activity was normalized to the total protein content via the Lowry-based assay (Bio-Rad).
Statistical analysis. Survival curves were computed in each group of mice using the Kaplan–Meier method and compared across groups using the log rank test. Calculations were made using SAS version 9.2 (SAS Institute, Cary, NC). T-test was used for paired comparisons while the comparison of three or more groups was performed using analysis of variance. P < 0.05 was considered significant.
Acknowledgments
The authors thank Daniela Markovic for assistance with the statistical evaluation of animal survival. The authors declare no financial or other conflict of interest. This work was supported by grants from the National Institutes of Health (5K08HD057555-05, 1R01NS071076-02A1, and R01NS071076-04S1), and research in the Hauschka lab was supported by grants from the NIH (5RO1AR18860, 1PO1 NS045788), and the Muscular Dystrophy Association. J.K. was a recipient of an award from the American Society of Transplant Surgeons and a training award from the California Institute for Regenerative Medicine. D.S.T. received funding from the Society of University Surgeons and was a recipient of a NIGMS Medical Genetics NIHT32 (GM008243).
References
- Jenkinson CP, Grody WW, Cederbaum SD. Comparative properties of arginases. Comp Biochem Physiol B, Biochem Mol Biol. 1996;114:107–132. doi: 10.1016/0305-0491(95)02138-8. [DOI] [PubMed] [Google Scholar]
- Mori M, Gotoh T. Regulation of nitric oxide production by arginine metabolic enzymes. Biochem Biophys Res Commun. 2000;275:715–719. doi: 10.1006/bbrc.2000.3169. [DOI] [PubMed] [Google Scholar]
- Mori M. Regulation of nitric oxide synthesis and apoptosis by arginase and arginine recycling. J Nutr. 2007;137 suppl. 2:1616S–1620S. doi: 10.1093/jn/137.6.1616S. [DOI] [PubMed] [Google Scholar]
- Kepka-Lenhart D, Mistry SK, Wu G, Morris SM., Jr Arginase I: a limiting factor for nitric oxide and polyamine synthesis by activated macrophages. Am J Physiol Regul Integr Comp Physiol. 2000;279:R2237–R2242. doi: 10.1152/ajpregu.2000.279.6.R2237. [DOI] [PubMed] [Google Scholar]
- Iyer R, Jenkinson CP, Vockley JG, Kern RM, Grody WW, Cederbaum S. The human arginases and arginase deficiency. J Inherit Metab Dis. 1998;21 suppl. 1:86–100. doi: 10.1023/a:1005313809037. [DOI] [PubMed] [Google Scholar]
- Vockley JG, Jenkinson CP, Shukla H, Kern RM, Grody WW, Cederbaum SD. Cloning and characterization of the human type II arginase gene. Genomics. 1996;38:118–123. doi: 10.1006/geno.1996.0606. [DOI] [PubMed] [Google Scholar]
- Jain-Ghai S, Nagamani SC, Blaser S, Siriwardena K, Feigenbaum A. Arginase I deficiency: severe infantile presentation with hyperammonemia: more common than reported. Mol Genet Metab. 2011;104:107–111. doi: 10.1016/j.ymgme.2011.06.025. [DOI] [PMC free article] [PubMed] [Google Scholar]
- Picker JD, Puga AC, Levy HL, Marsden D, Shih VE, Degirolami U.et al. (2003Arginase deficiency with lethal neonatal expression: evidence for the glutamine hypothesis of cerebral edema J Pediatr 142349–352. [DOI] [PubMed] [Google Scholar]
- Prasad AN, Breen JC, Ampola MG, Rosman NP. Argininemia: a treatable genetic cause of progressive spastic diplegia simulating cerebral palsy: case reports and literature review. J Child Neurol. 1997;12:301–309. doi: 10.1177/088307389701200502. [DOI] [PubMed] [Google Scholar]
- Deignan JL, De Deyn PP, Cederbaum SD, Fuchshuber A, Roth B, Gsell W.et al. (2010Guanidino compound levels in blood, cerebrospinal fluid, and post-mortem brain material of patients with argininemia Mol Genet Metab 100suppl. 1S31–S36. [DOI] [PubMed] [Google Scholar]
- Lee EK, Hu C, Bhargava R, Ponnusamy R, Park H, Novicoff S.et al. (2013AAV-based gene therapy prevents neuropathology and results in normal cognitive development in the hyperargininemic mouse Gene Ther 20785–796. [DOI] [PMC free article] [PubMed] [Google Scholar]
- Oldham MS, VanMeter JW, Shattuck KF, Cederbaum SD, Gropman AL. Diffusion tensor imaging in arginase deficiency reveals damage to corticospinal tracts. Pediatr Neurol. 2010;42:49–52. doi: 10.1016/j.pediatrneurol.2009.07.017. [DOI] [PMC free article] [PubMed] [Google Scholar]
- Grody WW, Kern RM, Klein D, Dodson AE, Wissman PB, Barsky SH.et al. (1993Arginase deficiency manifesting delayed clinical sequelae and induction of a kidney arginase isozyme Hum Genet 911–5. [DOI] [PubMed] [Google Scholar]
- Lee EK, Hu C, Bhargava R, Rozengurt N, Stout D, Grody WW.et al. (2012Long-term survival of the juvenile lethal arginase-deficient mouse with AAV gene therapy Mol Ther 201844–1851. [DOI] [PMC free article] [PubMed] [Google Scholar]
- Hu C, Busuttil RW, Lipshutz GS. RH10 provides superior transgene expression in mice when compared with natural AAV serotypes for neonatal gene therapy. J Gene Med. 2010;12:766–778. doi: 10.1002/jgm.1496. [DOI] [PMC free article] [PubMed] [Google Scholar]
- Hu C, Lipshutz GS. AAV-based neonatal gene therapy for hemophilia A: long-term correction and avoidance of immune responses in mice. Gene Ther. 2012;19:1166–1176. doi: 10.1038/gt.2011.200. [DOI] [PMC free article] [PubMed] [Google Scholar]
- Partridge TA. Cells that participate in regeneration of skeletal muscle. Gene Ther. 2002;9:752–753. doi: 10.1038/sj.gt.3301764. [DOI] [PubMed] [Google Scholar]
- Kohn RR.1975Aging gametes: their biology and pathology. Blandau RJ.ed.). Proceedings of the International Symposium on Aging Gametes S. Karger: Basel, Switzerland; 1–18. [Google Scholar]
- Schnepp BC, Clark KR, Klemanski DL, Pacak CA, Johnson PR. Genetic fate of recombinant adeno-associated virus vector genomes in muscle. J Virol. 2003;77:3495–3504. doi: 10.1128/JVI.77.6.3495-3504.2003. [DOI] [PMC free article] [PubMed] [Google Scholar]
- Himeda CL, Chen X, Hauschka SD. Design and testing of regulatory cassettes for optimal activity in skeletal and cardiac muscles. Methods Mol Biol. 2011;709:3–19. doi: 10.1007/978-1-61737-982-6_1. [DOI] [PubMed] [Google Scholar]
- Mayer DC, Leinwand LA. Sarcomeric gene expression and contractility in myofibroblasts. J Cell Biol. 1997;139:1477–1484. doi: 10.1083/jcb.139.6.1477. [DOI] [PMC free article] [PubMed] [Google Scholar]
- Iyer RK, Yoo PK, Kern RM, Rozengurt N, Tsoa R, O'Brien WE.et al. (2002Mouse model for human arginase deficiency Mol Cell Biol 224491–4498. [DOI] [PMC free article] [PubMed] [Google Scholar]
- Gau CL, Rosenblatt RA, Cerullo V, Lay FD, Dow AC, Livesay J.et al. (2009Short-term correction of arginase deficiency in a neonatal murine model with a helper-dependent adenoviral vector Mol Ther 171155–1163. [DOI] [PMC free article] [PubMed] [Google Scholar]
- Marieb EN, Hoehn K. Human Anatomy and Physiology. Benjamin Cummings; San Francisco; 2010. [Google Scholar]
- Cunningham SC, Dane AP, Spinoulas A, Logan GJ, Alexander IE. Gene delivery to the juvenile mouse liver using AAV2/8 vectors. Mol Ther. 2008;16:1081–1088. doi: 10.1038/mt.2008.72. [DOI] [PubMed] [Google Scholar]
- Wang L, Bell P, Lin J, Calcedo R, Tarantal AF, Wilson JM. AAV8-mediated hepatic gene transfer in infant rhesus monkeys (Macaca mulatta) Mol Ther. 2011;19:2012–2020. doi: 10.1038/mt.2011.151. [DOI] [PMC free article] [PubMed] [Google Scholar]
- Sdek P, Zhao P, Wang Y, Huang CJ, Ko CY, Butler PC.et al. (2011Rb and p130 control cell cycle gene silencing to maintain the postmitotic phenotype in cardiac myocytes J Cell Biol 194407–423. [DOI] [PMC free article] [PubMed] [Google Scholar]
- Pearson WR, Wood T, Zhang Z, Miller W. Comparison of DNA sequences with protein sequences. Genomics. 1997;46:24–36. doi: 10.1006/geno.1997.4995. [DOI] [PubMed] [Google Scholar]
- Crombez EA, Cederbaum SD. Hyperargininemia due to liver arginase deficiency. Mol Genet Metab. 2005;84:243–251. doi: 10.1016/j.ymgme.2004.11.004. [DOI] [PubMed] [Google Scholar]
- Salva MZ, Himeda CL, Tai PW, Nishiuchi E, Gregorevic P, Allen JM.et al. (2007Design of tissue-specific regulatory cassettes for high-level rAAV-mediated expression in skeletal and cardiac muscle Mol Ther 15320–329. [DOI] [PubMed] [Google Scholar]
- Passini MA, Bu J, Fidler JA, Ziegler RJ, Foley JW, Dodge JC.et al. (2007Combination brain and systemic injections of AAV provide maximal functional and survival benefits in the Niemann-Pick mouse Proc Natl Acad Sci USA 1049505–9510. [DOI] [PMC free article] [PubMed] [Google Scholar]
- Zhang P, Sun B, Osada T, Rodriguiz R, Yang XY, Luo X.et al. (2012Immunodominant liver-specific expression suppresses transgene-directed immune responses in murine pompe disease Hum Gene Ther 23460–472. [DOI] [PMC free article] [PubMed] [Google Scholar]
- Hu C, Cela RG, Suzuki M, Lee B, Lipshutz GS. Neonatal helper-dependent adenoviral vector gene therapy mediates correction of hemophilia A and tolerance to human factor VIII. Proc Natl Acad Sci USA. 2011;108:2082–2087. doi: 10.1073/pnas.1015571108. [DOI] [PMC free article] [PubMed] [Google Scholar]
- Sun Q, O'Brien WD., Jr2010Diagnosis of creatine metabolism disorders by determining creatine and guanidinoacetate in plasma and urine. In: Uttam, G and Hammett-Stabler, C. (eds). Clinical Applications of Mass Spectrometry.Humana Press (Springer): Berlin, Germany. pp. 175-185. [DOI] [PubMed]
- Gebhardt R, Mecke D. Heterogeneous distribution of glutamine synthetase among rat liver parenchymal cells in situ and in primary culture. EMBO J. 1983;2:567–570. doi: 10.1002/j.1460-2075.1983.tb01464.x. [DOI] [PMC free article] [PubMed] [Google Scholar]