

Abstract
Objective To develop a cost-effective, case-based reasoning framework for clinical research eligibility screening by only reusing the electronic health records (EHRs) of minimal enrolled participants to represent the target patient for each trial under consideration.
Materials and Methods The EHR data—specifically diagnosis, medications, laboratory results, and clinical notes—of known clinical trial participants were aggregated to profile the “target patient” for a trial, which was used to discover new eligible patients for that trial. The EHR data of unseen patients were matched to this “target patient” to determine their relevance to the trial; the higher the relevance, the more likely the patient was eligible. Relevance scores were a weighted linear combination of cosine similarities computed over individual EHR data types. For evaluation, we identified 262 participants of 13 diversified clinical trials conducted at Columbia University as our gold standard. We ran a 2-fold cross validation with half of the participants used for training and the other half used for testing along with other 30 000 patients selected at random from our clinical database. We performed binary classification and ranking experiments.
Results The overall area under the ROC curve for classification was 0.95, enabling the highlight of eligible patients with good precision. Ranking showed satisfactory results especially at the top of the recommended list, with each trial having at least one eligible patient in the top five positions.
Conclusions This relevance-based method can potentially be used to identify eligible patients for clinical trials by processing patient EHR data alone without parsing free-text eligibility criteria, and shows promise of efficient “case-based reasoning” modeled only on minimal trial participants.
Keywords: information storage and retrieval, clinical trials, electronic health records, artificial intelligence
1. OBJECTIVE
Secondary use of electronic health records (EHRs) has shown great promise for accelerating clinical research.1,2 Among various biomedical applications—for example, drug discovery, disease modeling, and personalized medicine3–6—EHRs have also been proved to be useful for efficiently identifying eligible patients for clinical trials to reduce potential delays due to recruitment difficulties.7–9 To accomplish this goal, most existing strategies generally derive a computable representation of clinical trial eligibility criteria and apply it to EHR data to allow clinical investigators to search for eligible patients.9–12 However, free-text eligibility criteria are difficult to parse due to their varied and complicated semantic structures (e.g., presence of negated sentence, absence of explicit separation between inclusion and exclusion criteria) and cannot be easily aligned with heterogeneous EHR representations.13,14
An alternative is to computationally model a small sample of trial participants.15 In this case, the information of existing trial participants is used to derive a general representation for a “target patient,” which is then used to discover new eligible patients. The ideal “target patient” of a clinical trial summarizes all the patterns in the participant EHRs that can effectively discriminate unseen patients between eligible and ineligible. The primary expected advantage of this solution is that it uses only EHR data without eligibility criteria. One recent implementation of this idea applies an automatic classifier to determine if a patient is eligible for the trial or not.16 That method requires, in addition to the list of participants, a list of ineligible patients to train the classifiers. However, finding these ineligible patients can be as difficult and laborious as finding eligible patients.
This article presents a novel method that improves upon the state of the art without requiring the identification of ineligible patients. This novel method generates a representation of the “target patient” by processing only the EHR data of a minimal sample of enrolled clinical trial participants. It requires no other additional information or manual work. The clinical trial eligibility of any unseen patient can then be determined according to his or her relevance to the corresponding “target patient.” The original contribution of this work is 4-fold: we (1) present a novel methodology to derive an EHR-based “target patient” representation only from trial participants, (2) embed this representation in a ranking framework where groups of patients can be ranked by their similarity to the “target patient”, (3) show that the method is effective in finding eligible patients from a set of unseen individuals, and (4) show that eligible patients are likely to be near the top of the recommended ranked list of candidates, thus greatly reducing the time needed for clinical trial investigators to find potential participants.
2. BACKGROUND AND SIGNIFICANCE
Randomized controlled trials generate high-quality medical evidence for disease treatment and therapeutic development but still face recruitment problems, which delay 90% of such trials.8,17 Various methods have been proposed to facilitate electronic screening of patients for clinical trials. Most strategies transform free-text clinical trial eligibility criteria specifications into computable forms that can be efficiently reused for classification, clustering, and retrieval.18–23 These representations have been used to facilitate recruitment in two major ways. On one hand, several works focused on providing intuitive search engines to help research volunteers search for trials online.24–27 On the other hand, computable eligibility criteria were matched to EHR data to discover eligible patients in a clinical database.10 The core functionality of this approach is the alignment between eligibility criteria and patient data to evaluate whether a given patient is eligible for the trial.7,28–31 Although EHR data have proven useful for clinical trial recruitment,32,33 none of these approaches is completely successful, partly because of the differences in semantic representations for key eligibility concepts between EHRs and eligibility criteria. For example, a patient of “Type 2 diabetes mellitus” can be identified using different information in the EHRs, such as objective lab values of A1c (i.e., glycated hemoglobin) greater than 7.0, presence of the “250.00” ICD-9 code, “Type 2 diabetes mellitus” mentioned in the free-text clinical notes, and so on. Differently, clinical trial eligibility criteria usually simply mention “with Type 2 diabetes mellitus” or “have DMII” in their text. Thus, it is nontrivial to match this high-level concept with the highly specific, diversified EHR data representations partially coded by various terminologies.
To overcome these difficulties, our proposed method relies exclusively on the EHR data for known participants and unseen patients by applying the “case-based reasoning” (CBR) paradigm. The purpose of CBR is to use previous knowledge and experiences to solve a new problem.34 In this case, the “new problem” refers to discovering patients eligible for a trial, whereas the “previous knowledge” can be seen as the set of enrolled clinical trial participants. Although CBR is both a recognized and well-established method for health sciences,35 to the best of our knowledge, only a single recent study explored and evaluated the application of CBR to improve recruitment. In this study, Köpcke et al.16 compared several classification models (i.e., random forests, support vector machine, logistic regression) to determine if patients were eligible for a trial. All models were trained using both trial participants and a set of ineligible patients from the same patient database. As previously mentioned, in contrast to this related work, we propose to use only the trial participants for training, consequently not requiring any additional ground truth (i.e., the ineligible patients), which might be costly and time-consuming to collect.
3. MATERIAL AND METHODS
Figure 1 shows the conceptual framework for the proposed eligibility screening method. Initially, a set of (e.g., 3–5) eligible patients or clinical trial participants is manually identified. Then their EHRs are aggregated to derive the “target patient,” a computable model summarizing the clinical trial. This model is then applied to any unseen patient of a clinical data warehouse to check his or her eligibility status. For each patient, the model returns a relevance score; the higher the value, the more likely the patient is eligible for the trial. Preidentified groups of patients (or the entire database as well) can then be ranked according to their relevance score. This ranked list is provided to the investigator for manually review; because the score of a relevant patient is supposed to be high, the investigator can quickly identify potentially eligible patients by reviewing only a small number of high-scoring patients at the top of the list.
Figure 1:

Overview of the “case-based reasoning” framework to discover eligible patients for a clinical trial through the “target patient,” a representation of the trial derived from the EHR data of a minimal sample of participants.
3.1. Framework Implementation
This framework allows flexible customization at each step, especially in terms of how to (1) process and summarize patient EHR data, (2) represent the clinical trial participants, and (3) discover potential eligible patients. We describe below one possible implementation to show the feasibility of the framework and, in particular, of using only minimal trial participants to discover new potentially eligible patients. Therefore, we favored simple designs to ensure a focused and correct evaluation for this explorative study. We will briefly review potential alternative strategies in the discussion section.
3.1.1. EHR Data Processing
The procedure to extract and aggregate EHR data aims to arrive at a generic patient representation that can be applied to any EHR regardless of specific hospital information systems. Therefore, we used four generally available EHR data types: medication orders, diagnosis, laboratory results, and free-text clinical notes. Other common variables (e.g., gender, age, location) were not included because they were straightforward to use to determine patient eligibility and hence did not need the same representation and reasoning that the other four data types would require. All data were extracted from Columbia University clinical data warehouse, which relies on reconciliation methods to ensure the completeness of the medical concept list.36,37 At this aim, all codes for labs, diagnosis, and medications are organized and normalized by a concept-oriented reference terminology named Medical Entities Dictionary (MED).38–40 For example, MED maps all medication concepts to the latest version of RxNorm41 and normalizes their pill formulation for aggregated analysis. Consequently, researchers are able to perform high-level medical concept retrieval without being concerned about the underlying heterogeneity in source data representations.
The handling of data differed by data type. For medications and diagnosis, we just counted the presence of each MED-based normalized code in the patient EHRs. For each laboratory result, if a test was recorded with categorical results (e.g., “positive” or “negative,” “high” or “low,” or a free-text summary), we simply noted that the test was performed without normalizing heterogeneous result expressions. If the test had numerical values, to avoid processing data represented in different numerical scales, for each patient we retained the average of these values only if all of them were recorded using the same unit measures; if they were not, we just retained the fact that the test was performed.
Free-text clinical notes required more sophisticated processing, including named entity recognition, semantically similar concepts aggregation, negation detection, redundancy handling, and topic modeling. First, text processing techniques20 were used to extract relevant tags from each note, where the tag relevance was determined by the grammatical role of the words, limited presence of stop words, and matching with the Unified Medical Language System (UMLS) lexicon.42 We retained only tags belonging to UMLS semantic types considered relevant for clinical notes (e.g., diseases and syndromes, finding, body parts, medications).43 All tags were normalized using the UMLS concept unique identifiers in order to aggregate synonyms and semantically similar tags under the same concept to reduce the sparseness of the representation.20 A tag that appeared as negated in the note was considered not relevant and discarded.43 To do this, we applied NegEx, a regular expression algorithm that implements several phrases indicating negation, filters out sentences containing phrases that falsely appear to be negation phrases, and limits the scope of the negation phrases.44 For each patient, we then analyzed similarities in the representation of temporally consecutive notes to remove duplicated information (e.g., notes recorded twice by mistake).45 Preliminary experimental results, not reported here for brevity, showed that this raw representation was not effective in capturing patterns in the trial participants. For this reason, we added a semantic level by modeling notes using topic modeling,46 an unsupervised inference process that captures patterns of word co-occurrences within documents to define topics and represent a document as a multinomial over these topics. Topic modeling has been widely applied to generalize clinical notes and improve automatic processing of patients data (e.g., see47–49). We used latent Dirichlet allocation50 as our implementation of topic modeling; each note was eventually summarized as a multinomial of topic probabilities.
Each patient was then represented by four vectors, one per data type (see the left side of Figure 2). In particular, the medication and diagnosis code vectors summarized how often each relevant code occurred in the patient EHRs, the lab vector combined averaged test result values and test frequency, and the note vector reported the average topic representation across all the patient notes.
Figure 2:

Overview of the process to derive the clinical trial’s “target patient” by modeling the EHR data of minimal enrolled participants.
3.1.2. EHR-based Representation of the “Target Patient”
The EHR representations of the available trial participants were analyzed and aggregated to derive a profile of the “target patient.” We applied a simple training model based on finding common concepts in each data type (e.g., diagnosis occurrences, highly probable topics, performed lab tests) and averaging the corresponding values. This choice was motivated by the small number of participants available for some of the trials (e.g., 3–4 patients), to which more sophisticated statistical models could not be applied.
Figure 2 illustrates the process and its major steps. Data of each participant were extracted and parsed as described in the previous section; participants with no data remaining after this step were considered outliers and removed. For each data type, we retained only the concepts frequently shared by the participants and then averaged their occurrences over all participants. To estimate the threshold to consider a concept as being frequent, we initialized an algorithm with a frequency value of 80% (i.e., a concept had to appear in at least 80% of the trial participants to be retained) and decreased this value until at least 10 concepts for each data type were retained. If this minimum count could not be achieved due to sparse patient data, we just retained all the concepts of each patient for that data type. Consequently, every trial’s “target patient” was represented by four vectors—medications, diagnosis, notes, and lab—highlighting the aggregated common patterns among that trial’s participants (see right side of Figure 2). This representation of the trial’s “target patient” follows the same data structure of a real patient (thus facilitating comparisons) and combines all relevant characteristics from the trial’s actual participants.
3.1.3. Patient Eligibility Classification
For a given trial, the EHR data of a new unseen patient is matched to the “target patient” to obtain a relevance score indicating the patient eligible likelihood. The higher the relevance score, the more likely is the patient eligible. We implemented “relevance” as a pairwise similarity relationship between the patient and the “target patient.” In particular, relevance scores were obtained by (1) computing pairwise cosine similarity within each data type separately and (2) aggregating these scores using a weighted linear combination. The final score ranged between 0 and 1, with 1 meaning “perfect similarity” (and thus high relevance). Weights were defined automatically during training for each trial by seeking the combination of coefficients that maximized the pairwise similarity among all the participants. We used cosine similarity because it processes only the entries shared by the compared data,51 allowing the similarity scores to be based only on the concepts associated with the “target patient.”
Patients can then be classified as “eligible” or “ineligible” by using a pre-set relevance threshold value so that only patients with a relevance score greater than this threshold would be considered eligible. A group of patients can also be listed in descending order of relevance score for manual review.
3.2. Evaluation Design
By exploiting previously established collaborations with in-house clinical investigators, we were able to obtain the EHR data for 262 unique participants enrolled in 13 clinical trials conducted at Columbia University to use as our gold standard. These studies were our convenient sample of diversified clinical trials with gold standard (i.e., known participants). These trials represented different diseases, including Type 2 diabetes mellitus, HIV, and multiple myeloma (see Table 1 for the details of each trial). The number of participants per trial ranged from 4 to 128; each participant was enrolled in only one trial. We also obtained the EHRs for 30 000 patients with sufficient data—in particular, at least laboratory results, diagnosis, and clinical notes—randomly selected from the Columbia University’s clinical data warehouse52 for evaluation. The data warehouse contains longitudinal records for about 4.5 million patients. This random set of patients was chosen to generalize the evaluation on a larger scale and to simulate a real-world use case scenario where the eligible patients are mixed with other unseen patients. As we demonstrated in a prior study about which measure matters for evaluating electronic screening methods,9 in order to help clinical investigators meet the recruitment goal, the practical need is to identify an adequate number of eligible patients with minimal manual effort in least time. Exclusion of all ineligible patients is often unnecessary to meet this goal. For example, if a clinical data warehouse contains 4.6 million patients, including more than 120 000 diabetic patients, while a study aims at recruiting 50 diabetics, it would be unnecessary for the clinical investigator to exclude more than 3.4 million patients who have no diabetes. It would be totally fine to focus the search energy to identify 50 true diabetics and then move on. Following this design principle, the scope of this evaluation is to identify truly eligible patients in the dataset rather than identifying all possible ineligible patients.
Table 1:
Brief description of the 13 clinical trials used to evaluate the feasibility of relevance-based eligibility screening using only EHR data. The trial abbreviation will be used since now on to name the trials along the article
| Trial | Title | Start Date | End Date | No. of Participants |
|---|---|---|---|---|
| A | Avoiding Cardiovascular Events through Combination Therapy in Patients Living with Systolic Hypertension | January 2003 | May 2005 | 12 |
| B | Atherothrombosis Intervention in Metabolic Syndrome with Lowhdl/High Triglyceride and Impact on Global Health Outcomes | May 2006 | November 2012 | 6 |
| C | Diabetes Reduction Assessment with Ramipril and Rosiglitazone Medication | June 2001 | December 2006 | 26 |
| D | Exenatide Study of Cardiovascular Event Lowering Trial | July 2011 | July 2016 | 4 |
| E | Growth Hormone and Rosiglitazone for Visceral Adiposity in HIV | June 2004 | April 2009 | 6 |
| F | Liraglutide Effect and Action in Diabetes: Evaluation of Cardiovascular Outcome Results | February 2011 | February 2016 | 6 |
| G | Action to Control Cardiovascular Risk in Diabetes | September 1999 | December 2012 | 128 |
| H | Sitagliptin Cardiovascular Outcome Study | December 2008 | December 2014 | 32 |
| I | A Safety and Efficacy Study of Carfilzomib and Pomalidomide with Dexamethasone in Patients with Relapsed or Refractory Multiple Myeloma | November 2011 | October 2015 | 4 |
| J | Lenalidomide and Dexamethasone With/Without Stem Cell Transplant in Patients with Multiple Myeloma | November 2012 | February 2015 | 4 |
| K | 2 × 2 Factorial Design Study to Evaluate the Effects of Lantus vs. Standard Care and Omega-3 Fatty Acids vs. Placebo | May 2005 | November 2012 | 6 |
| L | A 26-week Randomized, Double-blind, Parallel Group Study to Compare the Efficacy, Safety, and Tolerability of Rosiglitazone (2 mg b.i.d. and 4 mg b.i.d.) vs. Placebo in Combination with Glyburide and Metformin in Patients with Type 2 Diabetes Mellitus | January 1999 | December 2006 | 14 |
| M | Targeting Inflammation Using Salsalate for Type 2 Diabetes | October 2006 | December 2010 | 14 |
All trial participants and patients were preprocessed according to the method described in the previous sections. Topic model was estimated using a random subset of 10 000 patients and applied to all 30 262 patients in the dataset. We estimated the number of topics through perplexity analysis over 5000 different random patients. Perplexity is a measurement of how well a probability model predicts a sample and is algebraically equivalent to the inverse of the geometric mean per-word likelihood50; lower perplexity scores indicate better generalization performance. We found that 100 topics achieved the best generalization; therefore, each note was summarized by a 100-topic vector.
For each trial, we conducted a 2-fold cross validation experiment, where, in each fold, half of the participants were used for deriving the “target patient” and the other half was used for testing. Each participant was used as test patient for the corresponding trial exactly once. According to the trial under processing, for each patient we considered only the data occurring in a time period ranging from the first event recorded up to one year after the beginning of trial recruitment (to simulate potential delays in recruitment and to discard data that would not be available in a real scenario). In all the experiments, the test set with half of the participants for each trial was merged with all the other patients in the ground truth set (unless those used for training) as well as with the 30 000 random patients. For each fold and each trial, relevance scores were then computed between the estimated “target patient” and every patient in the test set. On these data, we performed classification and ranking experiments, details and results of which are reported in the following section.
3.2.1. Classification Evaluation
For each trial, we classified a test patient as eligible if his or her relevance score with the “target patient” of that trial exceeded a threshold value, not eligible otherwise. We ranged the relevance threshold from 0 to 1 and, for each value, evaluated the classification performances of all trial folds. We reported the area under the receiver operating characteristic curve (AUC-ROC), which is a common metric to evaluate binary classifier performances. The ROC curve is a plot of true positive rate versus false positive rate found over the set of predictions. AUC is computed by integrating the ROC curve and it is upper bounded by 1; random guessing would result in an AUC of 0.5.51 We compared the proposed approach based on a weighted combination of the cosine similarities of each data type (i.e., “w-comb”), with alternative strategies computing relevance using one data type at a time. In this case, we included approaches using only medications (i.e., “only-med”), only diagnosis (i.e., “only-diag”), only note topic-based representations (i.e., “only-note”), and only lab results (i.e., “only-lab”).
3.2.2. Ranking Evaluation
We ranked the patients in the fold test sets of each trial according to their relevance with the corresponding “target patient” and evaluated their position in the ranking list. In addition to the strategies described in the previous section, we evaluated two additional baseline strategies: “lower-bound,” which randomly ranks the test collection and represent the worst results achievable; and “upper-bound,” which refers to the best results possible (i.e., the eligible patients are all at the top of the ranking list).
We reported different measures averaged through all the experiments: precision-at-k (Pk), mean average precision (MAP), and mean reciprocal rank (MRR).51 All these metrics give more weight to the top of the list, since it is usually the most relevant part for the users of a search engine. Pk is the precision when the top-k patients are retrieved, that is, the fraction true positives in the top-k of the ranking. We used k = 5 and k = 10. MAP averages the precision at each point in the ranking list where a patient is correctly retrieved and is a measure of the quality of the entire ranking list. MRR averages the inverse of the rank of the first relevant patient for each list and is a measure of the level of the ranking list at which the information need of the investigator is first fulfilled.
4. RESULTS
Figure 3 shows the average classification results of the 2-fold cross validation experiment when ranging the relevance threshold values from 0 to 1. As it can be seen, w-comb obtained the best results; in fact, the different data types appeared to be strongly complementary with each other, leading to the improvement achieved by combining them in one single score. There was no difference in the results with a threshold value between 0.1 and 0.5 (all obtaining an AUC >0.9). Thus, presetting a threshold value in this range potentially leads to the identification of eligible patients with good precision. The best overall AUC was 0.952 and was obtained using a relevance threshold of 0.3. Table 2 reports the AUC values for each clinical trial and each fold in this last case.
Figure 3:
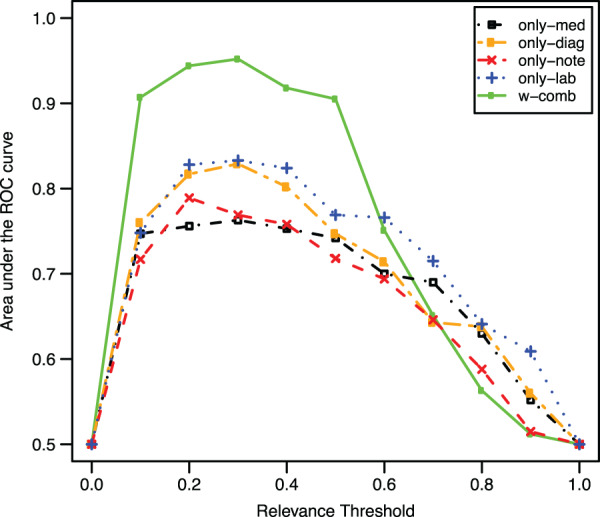
Classification results in terms of the area under the ROC curve averaged over both the evaluation folds. A patient was considered eligible if its relevance score with the corresponding “target patient” was over a threshold (ranged between 0 and 1), ineligible otherwise.
Table 2:
Classification results obtained by w-comb for each clinical trial in the 2-fold experiments
| W-Comb, Relevance Threshold = 0.3 | |||
|---|---|---|---|
| Area under the ROC curve |
|||
| Clinical Trial | Fold 1 | Fold 2 | Average |
| A | 0.976 | 0.876 | 0.926 |
| B | 0.977 | 0.973 | 0.975 |
| C | 0.983 | 0.913 | 0.948 |
| D | 0.993 | 0.970 | 0.981 |
| E | 0.997 | 0.833 | 0.915 |
| F | 0.997 | 0.996 | 0.996 |
| G | 0.899 | 0.919 | 0.909 |
| H | 0.945 | 0.946 | 0.946 |
| I | 0.999 | 0.999 | 0.999 |
| J | 0.999 | 0.997 | 0.998 |
| K | 0.814 | 0.902 | 0.858 |
| L | 0.993 | 0.988 | 0.991 |
| M | 0.903 | 0.961 | 0.932 |
The threshold relevance value was set to 0.3, whereby all the patients in the test set obtaining a relevance score with the “target patient” > 0.3 were considered eligible. The mean area under the ROC curve over all the trials and folds was 0.952.
Table 3 shows the ranking experiment results averaged over the two evaluation folds. As in Figure 3, w-comb obtained the best results; in particular, the approach worked better at the top of the ranking list than toward the bottom of the list because MRR is greater than MAP. The MRR values highlighted that every trial (in average) was likely to rank at least one relevant patient in the first 2 positions. In addition, 57% of the relevant patients were ranked in the top 5 positions of the corresponding ranking list, while about 70% of them were ranked in the first 10 positions. To corroborate this statement, Figure 4 shows P5 measures obtained by each trial in the two folds. As can be seen, for every trial and every fold, w-comb ranked at least one relevant patient within the top 5 positions (i.e., P5 ≥ 0.2). Trial C, for example, obtained P5 values for the 2-fold experiments of 0.8 and 0.6, respectively, out of an upper bound of 1 (i.e., all the top 5 patients could be eligible). This means that w-comb ranked 4 eligible patients in top 5 positions during the first-fold experiment and 3 during the second-fold experiment.
Table 3:
Ranking results in terms of precision-at-{5, 10} (P5, P10), MAP, and MRR averaged over the two evaluation folds
| Algorithm | P5 | P10 | MAP | MRR | |
|---|---|---|---|---|---|
| Baseline | lower-bound | 0.008 | 0.004 | 0.001 | 0.005 |
| upper-bound | 0.718 | 0.477 | 1.000 | 1.000 | |
| Data Type Relevance | only-med | 0.077 | 0.046 | 0.096 | 0.137 |
| only-diag | 0.031 | 0.055 | 0.135 | 0.187 | |
| only-note | 0.069 | 0.106 | 0.186 | 0.267 | |
| only-lab | 0.185 | 0.132 | 0.281 | 0.374 | |
| Linear Weighted Combination of Data Type Relevance | w-comb | 0.415 | 0.324 | 0.558 | 0.717 |
Patients in each test set were ranked by their relevance score with the corresponding trial representation; the higher the relevance, the higher the rank.
Figure 4:
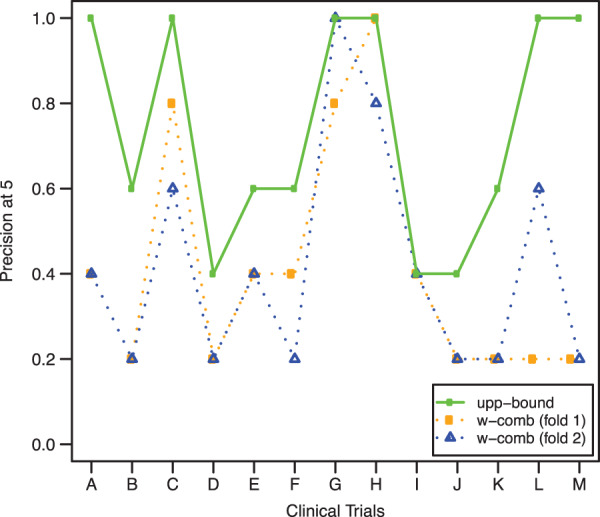
Precision-at-5 (P5) obtained by w-comb for every fold and every clinical trial. We derived each trial’s “target patient” from the corresponding training participants, ranked the test patients by their relevance with the trial, and measured how many eligible patients were within the top five positions. Results for upper-bound are included for comparison as well; in this case, there is no distinction between folds because results were identical.
5. DISCUSSION
The proposed method represents a novel combinatory reuse of clinical and research data, that is, the clinical data in EHRs, and research data from clinical trial management systems, specifically the information about trial participants, to improve clinical trial recruitment and screening. In particular, the results demonstrate the feasibility of using the EHR data of clinical trial participants to recommend potentially eligible patients to that trial without processing its free-text eligibility criteria or requiring identifying controls for designing classifiers. Classification and ranking results were consistent among multiple trials of different medical conditions and the approach was sufficiently robust to adapt to different contextual details, such as the number of training participants, the medical condition investigated in the trial, and the duration of the trial. In particular, satisfactory results were achieved regardless of the number of participants used for training. The above merits potentially make the approach usable early in a trial, when only a small number of participants (e.g., 2–3) have been enrolled, potentially leading to a significant increase in the patient screening pool.
5.1. Potential Applicative Scenarios
In a real-world scenario, this CBR approach can be exploited in three different ways. First, it can be used as a self-standing tool, which constantly monitors a clinical data warehouse and alerts investigators when a new potentially eligible patient is identified (i.e., when the relevance score of the patient with the trial is greater than a certain threshold, e.g., 0.3).11 To this end, the classification experiment showed that the proposed approach is able to highlight eligible patients from a pool of unseen candidates with a good precision. Second, an investigator can use it to rank all the patients in a data warehouse (or a relevant subset of them). Ranking results showed indeed that the approach is likely to place some eligible patients in the top five positions, thus potentially reducing the effort required for the investigator to manually review. The CBR framework can also integrate strategies matching EHR data and eligibility criteria toward more effective systems. In fact, combining these two different but complementary approaches might overcome their individual limitations and consequently improve the state of the art of clinical trial eligibility screening methods. Third, depending on the data types included in the EHR patient representation, this case-base reasoning framework might allow for a high degree of interoperability. In fact, in the case of multiple institutions using compatible coding systems as well as patient feature conventions, the inferred “target patient” might be shared among these institutions to allow investigators searching for potential eligible patients across different clinical data warehouses. This would considerably increase the pool of eligible patients.
5.2. Limitations and Future Works
This study has several limitations, which leave room for future methodology enhancement. As an early step in this research direction, we simplified the problem scenario by assuming that each clinical trial includes only one group of patients and hence that only one target patient is needed. For clinical trials that involve multiple cohorts, we can simply repeat the same process and build a target patient model for each group. Thus, the proposed methodology is expected to generalize to more complex clinical trial designs when needed.
The main goal of the exploratory study was to test the feasibility of applying CBR using only minimal clinical trial participants to find other eligible patients. For this reason, implementation choices were simple in order to avoid introducing biases and complexities in the evaluation. However, future studies are required to test if more sophisticated techniques could lead to even better results. For example, in terms of patient EHR representation, a model of laboratory results accounting for the temporal trends of the values (rather than just the mean) is likely to benefit the identification of eligible patients. Similarly, modeling diagnosis and medications using a well-chosen probability distribution (e.g., Gaussian, Dirichlet) might help to handle the incompleteness problem of EHR data,53 thus improving overall performances. The derivation of the “target patient” representation can benefit from more sophisticated techniques as well. In particular, all statistical models that can be trained by only estimating the distributions of participants associated with each trial (e.g., mixture models, hidden Markov models) as opposed to optimize a discriminant function in the training data (e.g., support vector machines) might be a suitable solution in this context to obtain better and more robust predictions.54 Moreover, this study relied on a simple concept-based reasoning provided by UMLS and MED; we expect that supporting EHR processing with additional medical ontologies might further improve the precision and recall of eligible patient search.
Future work will most likely address these points. In particular, we plan to use ontologies and focus on exploring more sophisticated statistical models to improve the EHR-based “target patient” representation. Besides benefitting clinical research, we believe that this direction might promote research in the machine learning community as well, since most of the models presented in the literature work well only with large training datasets (as opposed to this context where only a few participants might be available). Finally, we plan to extend the evaluation by adding trials covering different diseases to the experimental set, in order to develop an even more reliable and effective prototype.
6. CONCLUSIONS
This article demonstrated the potential usefulness of an application of “case-based reasoning” (CBR) to expedite electronic patient screening for clinical trials. In particular, given a trial and a set of trial participants, the proposed approach modeled the EHR data of the participants to derive a general representation of the “target patient” that can be used to discover and rank new potentially eligible patients from a clinical data warehouse. Evaluation results on classification and ranking tasks demonstrated the feasibility of this method by showing satisfactory benefits.
FUNDING
The work was supported by National Library of Medicine grants R01LM009886 and R01LM010815 and National Center for Advancing Translational Sciences grant UL1 TR000040 (PI: Ginsberg).
COMPETING INTERESTS
None.
CONTRIBUTORS
R.M. conducted the research and wrote the article. C.W. initiated the idea, collected data, supervised the research, and edited the article.
REFERENCES
- 1. Hersh WR. Adding value to the electronic health record through secondary use of data for quality assurance, research, and surveillance. Am J Manag Care. 2007;13(6):277–278. [PubMed] [Google Scholar]
- 2. Jensen PB, Jensen LJ, Brunak S. Mining electronic health records: towards better research applications and clinical care. Nat Rev Genet. 2012;13(6):395–405. [DOI] [PubMed] [Google Scholar]
- 3. Hripcsak G, Albers DJ. Next-generation phenotyping of electronic health records. J Am Med Inform Assoc. 2013;20(1):117–121. [DOI] [PMC free article] [PubMed] [Google Scholar]
- 4. Sun J, Wang F, Hu J, Edabollahi S. Supervised patient similarity measure of heterogeneous patient records. ACM SIGKDD Explorations Newsletter. 2012;14(1):16–24. [Google Scholar]
- 5. Wu J, Roy J, Stewart WF. Prediction modeling using EHR data: challenges, strategies, and a comparison of machine learning approaches. Med Care. 2010;48(6 Suppl):S106–S113. [DOI] [PubMed] [Google Scholar]
- 6. Yao L, Zhang Y, Li Y, et al. Electronic health records: Implications for drug discovery. Drug Discov Today. 2011;16 (13–14):594–599. [DOI] [PubMed] [Google Scholar]
- 7. Embi PJ, Jain A, Clark J, Harris CM. Development of an electronic health record-based clinical trial alert system to enhance recruitment at the point of care. AMIA Annu Symp Proc. 2005;231–235. [PMC free article] [PubMed] [Google Scholar]
- 8. Sullivan J. Subject recruitment and retention: barriers to success. Appl Clin Trials. 2004;50–54. [Google Scholar]
- 9. Thadani SR, Weng C, Bigger JT, et al. Electronic screening improves efficiency in clinical trial recruitment. J Am Med Inform Assoc. 2009;16(6):869–873. [DOI] [PMC free article] [PubMed] [Google Scholar]
- 10. Cuggia M, Besana P, Glasspool D. Comparing semi-automatic systems for recruitment of patients to clinical trials. Int J Med Inform. 2011;80(6):371–388. [DOI] [PubMed] [Google Scholar]
- 11. Weng C, Batres C, Borda T, et al. A real-time screening alert improves patient recruitment efficiency. AMIA Annu Symp Proc. 2011;1489–1498. [PMC free article] [PubMed] [Google Scholar]
- 12. Weng C, Bigger JT, Busacca L, et al. Comparing the effectiveness of a clinical registry and a clinical data warehouse for supporting clinical trial recruitment: a case study. AMIA Annu Symp Proc. 2010;867–871. [PMC free article] [PubMed] [Google Scholar]
- 13. Ross J, Tu SW, Carini S, Sim I. Analysis of eligibility criteria complexity in clinical trials. AMIA Summits Transl Sci Proc. 2010;46–50. [PMC free article] [PubMed] [Google Scholar]
- 14. Weng C, Tu SW, Sim I, Richesson R. Formal representation of eligibility criteria: a literature review. J Biomed Inform 2010;43(3):451–467. [DOI] [PMC free article] [PubMed] [Google Scholar]
- 15. Dussart C, Pommier P, Siranyan V, et al. Optimizing clinical practice with case-based reasoning approach. J Eval Clin Pract. 2008;14(5):718–720. [DOI] [PubMed] [Google Scholar]
- 16. Köpcke F, Lubgan D, Fietkau R, et al. Evaluating predictive modeling algorithms to assess patient eligibility for clinical trials from routine data. BMC Med Inform Decis Mak. 2013;13:134. [DOI] [PMC free article] [PubMed] [Google Scholar]
- 17. Tassignon JP, Sinackevich N. Speeding the critical path. Appl Clin Trials. 2004;13(1):42–48. [Google Scholar]
- 18. Boland MR, Miotto R, Gao J, Weng C. Feasibility of feature-based indexing, clustering, and search of clinical trials on ClinicalTrials.gov: a case study of breast cancer trials. Methods Inf Med. 2013;52(5):382–394. [DOI] [PMC free article] [PubMed] [Google Scholar]
- 19. Luo Z, Miotto R, Weng C. A human-computer collaborative approach to identifying common data elements in clinical trial eligibility criteria. J Biomed Inform. 2013;46(1):33–39. [DOI] [PMC free article] [PubMed] [Google Scholar]
- 20. Miotto R, Weng C. Unsupervised mining of frequent tags for clinical eligibility text indexing. J Biomed Inform. 2013;46(6):1145–1151. [DOI] [PMC free article] [PubMed] [Google Scholar]
- 21. Parker CG, Embley DW. Generating medical logic modules for clinical trial eligibility criteria. AMIA Annu Symp Proc. 2003;964. [PMC free article] [PubMed] [Google Scholar]
- 22. Tu SW, Peleg M, Carini S, et al. A practical method for transforming free-text eligibility criteria into computable criteria. J Biomed Inform. 2011;44(2):239–250. [DOI] [PMC free article] [PubMed] [Google Scholar]
- 23. Weng C, Wu X, Luo Z, et al. EliXR: an approach to eligibility criteria extraction and representation. J Am Med Inform Assoc. 2011;18 (Suppl 1):i116–i124. [DOI] [PMC free article] [PubMed] [Google Scholar]
- 24. ClinicalTrials.gov. http://www.clinicaltrials.gov/. Accessed April 1, 2014.
- 25. Ask Dory! http://dory.trialx.com/ask/. Accessed April 1, 2014.
- 26. TrialReach. http://www.trialreach.com/. Accessed April 1, 2014.
- 27. Miotto R, Jiang S, Weng C. eTACTS: a method for dynamically filtering clinical trial search results. J Biomed Inform. 2013;46(6):1060–1067. [DOI] [PMC free article] [PubMed] [Google Scholar]
- 28. Afrin LB, Oates JC, Boyd CK, Daniels MS. Leveraging of open EMR architecture for clinical trial accrual. AMIA Annu Symp Proc. 2003;16–20. [PMC free article] [PubMed] [Google Scholar]
- 29. Li L, Chase HS, Patel CO, et al. Comparing ICD9-encoded diagnoses and NLP-processed discharge summaries for clinical trials pre-screening: a case study. AMIA Annu Symp Proc. 2008;404–408. [PMC free article] [PubMed] [Google Scholar]
- 30. Ohno-Machado L, Parra E, Henry SB, et al. AIDS2: a decision-support tool for decreasing physicians' uncertainty regarding patient eligibility for HIV treatment protocols. Annu Symp Comput Appl Med Care. 1993;429–433. [PMC free article] [PubMed] [Google Scholar]
- 31. Papaconstantinou C, Theocharous G, Mahadevan S. An expert system for assigning patients into clinical trials based on Bayesian networks. J Med Syst. 1998;22(3):189–202. [DOI] [PubMed] [Google Scholar]
- 32. Köpcke F, Trinczek B, Majeed RW., et al. Evaluation of data completeness in the electronic health record for the purpose of patient recruitment into clinical trials: a retrospective analysis of element presence. BMC Med Inform Decis Mak. 2013;13:37. [DOI] [PMC free article] [PubMed] [Google Scholar]
- 33. Sumi E, Teramukai S, Yamamoto K, et al. The correlation between the number of eligible patients in routine clinical practice and the low recruitment level in clinical trials: a retrospective study using electronic medical records. Trials. 2013;14:426. [DOI] [PMC free article] [PubMed] [Google Scholar]
- 34. Aamodt A, Plaza E. Case-based reasoning: foundational issues, methodological variations, and system approaches. AI Commun. 1994;7(1):39–59. [Google Scholar]
- 35. Begum S, Ahmed MU, Funk P, et al. Case-based reasoning systems in the health sciences: a survey of recent trends and developments. IEEE T Syst Man Cy C. 2011;41(4):421–434. [Google Scholar]
- 36. Owen MC, Chang NM, Chong DH, Vawdrey DK. Evaluation of medication list completeness, safety, and annotations. AMIA Annu Symp Proc. 2011;1055–1061. [PMC free article] [PubMed] [Google Scholar]
- 37. Vawdrey DK, Chang N, Compton A, et al. Impact of electronic medication reconciliation at hospital admission on clinician workflow. AMIA Annu Symp Proc. 2010;822–826. [PMC free article] [PubMed] [Google Scholar]
- 38. Forman BH, Cimino JJ, Johnson SB, et al. Applying a controlled medical terminology to a distributed, production clinical information system. Proc Annu Symp Comput Appl Med Care. 1995;421–425. [PMC free article] [PubMed] [Google Scholar]
- 39. Cimino JJ, Clayton PD, Hripcsak G, Johnson SB. Knowledge-based approaches to the maintenance of a large controlled medical terminology. J Am Med Inform Assoc. 1994;1(1):35–50. [DOI] [PMC free article] [PubMed] [Google Scholar]
- 40. Cimino JJ. From data to knowledge through concept-oriented terminologies: experience with the Medical Entities Dictionary. J Am Med Inform Assoc. 2000;7(3):288–297. [DOI] [PMC free article] [PubMed] [Google Scholar]
- 41. RxNorm. http://www.nlm.nih.gov/research/umls/rxnorm/index.html. Accessed April 1, 2014.
- 42. Lindberg C. The Unified Medical Language System (UMLS) of the National Library of Medicine. J Am Med Rec Assoc. 1990;61(5):40–42. [PubMed] [Google Scholar]
- 43. Plaza L, Diaz A. Retrieval of similar electronic health records using UMLS concept graphs. NLDB. 2010;6177:296–303. [Google Scholar]
- 44. Chapman WW, Bridewell W, Hanbury P, et al. A simple algorithm for identifying negated findings and diseases in discharge summaries. J Biomed Inform. 2001;34(5):301–310. [DOI] [PubMed] [Google Scholar]
- 45. Cohen R, Elhadad M, Elhadad N. Redundancy in electronic health record corpora: analysis, impact on text mining performance and mitigation strategies. BMC Bioinformatics. 2013;14:10. [DOI] [PMC free article] [PubMed] [Google Scholar]
- 46. Blei DM. Probabilistic topic models. Commun ACM. 2012;55(4):77–84. [Google Scholar]
- 47. Arnold CW, El-Saden SM, Bui AA, Taira R. Clinical case-based retrieval using latent topic analysis. AMIA Annu Symp Proc. 2010;26–30. [PMC free article] [PubMed] [Google Scholar]
- 48. Bisgin H, Liu Z, Fang H, et al. Mining FDA drug labels using an unsupervised learning technique - topic modeling. BMC Bioinformatics. 2011;12 (Suppl 10):S11. [DOI] [PMC free article] [PubMed] [Google Scholar]
- 49. Perotte A, Bartlett N, Elhadad N, Wood F. Hierarchically supervised latent Dirichlet allocation. NIPS. 2011;2609–2617. [Google Scholar]
- 50. Blei DM, Ng AY, Jordan MI. Latent Dirichlet allocation. J Mach Learn Res. 2003;3(4–5):993–1022. [Google Scholar]
- 51. Manning CD, Raghavan P, Schütze H. Introduction to Information Retrieval. New York, NY: Cambridge University Press; 2008: 482. [Google Scholar]
- 52. Johnson SB. Generic data modeling for clinical repositories. J Am Med Inform Assoc. 1996;3(5):328–339. [DOI] [PMC free article] [PubMed] [Google Scholar]
- 53. Weiskopf NG, Hripcsak G, Swaminathan S, Weng C. Defining and measuring completeness of electronic health records for secondary use. J Biomed Inform. 2013;46(5):830–836. [DOI] [PMC free article] [PubMed] [Google Scholar]
- 54. Ng AY, Jordan MI. On discriminative vs. generative classifiers: a comparison of logistic regression and naive Bayes. NIPS. 2002;841–848. [Google Scholar]