

Abstract
Background
Relatively lower executive functioning is characteristic of individuals with schizophrenia. As low socioeconomic status (SES) early in life, i.e. parent SES, has been linked with lower executive skills in healthy children, we hypothesized that parental SES would be more strongly related to executive functioning in individuals with schizophrenia than in controls and have a greater impact on prefrontal cortical morphology.
Method
Healthy controls (N = 125) and individuals with schizophrenia (N = 102) completed tests assessing executive functioning and intelligence. The groups were matched on parent SES, which was evaluated with the Hollingshead-Redlich scale. A principal component analysis was conducted on 10 variables from 6 executive tests, yielding three specific components (fluency, planning, and response inhibition). Voxel-based morphometry (VBM) was used to evaluate effects of parent SES on gray matter concentration.
Results
Lower parent SES was associated with lower scores across the three executive functioning components, and a significant group by parent SES interaction was observed such that low parent SES especially affected individuals with schizophrenia. These effects remained significant when intellectual ability, education, and self SES were added as covariates. VBM revealed that lower parent SES was associated with reduced gray matter volume in several anterior brain regions, especially the superior frontal gyrus, in patients, but not in controls.
Conclusions
These findings suggest that individuals with schizophrenia may be especially vulnerable to the adverse impact of low parental SES, in terms of both lower executive skills and reduced anterior gray matter volumes.
Keywords: schizophrenia, socioeconomic status, executive function, frontal lobes, voxel-based morphometry
Growing up in an impoverished socioeconomic environment is associated with a number of environmental, health, and developmental disparities in children that persist well into adulthood. Though genetic factors clearly affect brain development, there is also substantial evidence for early sociocultural influences on the risk of developing both schizophrenia (van Os, 2010) and relatively lower cognitive functioning (Nisbett et al., 2012). Socioeconomic status (SES) in particular has been frequently examined for its impact on cognitive skills (Hanscombe et al., 2012). The effects of low socioeconomic status (SES) are probably greater in some cognitive domains than others. Executive or “frontal lobe” skills may be especially affected (Hackman et al., 2010). The neurological substrate for these skills includes diverse prefrontal regions that frequently show morphological abnormalities in schizophrenia (Eisenberg and Berman, 2010). The adverse effects of low SES may also be greater for some individuals than others, including individuals vulnerable to schizophrenia. We have suggested that a cardinal feature of schizophrenia is reduced canalization, i.e., difficulty in getting development back on a normal trajectory following significant perturbations (Yeo et al., 1999, Yeo et al., 2007). Consistent with this perspective, individuals at risk for schizophrenia have been found to be more influenced by such environmental issues as obstetric complications (McNeil et al., 2000) and marijuana (Habets et al., 2011) and alcohol use (Welch et al., 2011). The current study thus sought to test the hypothesis that low parental SES (pSES) has a greater adverse impact on executive skills and cortical morphology in individuals with schizophrenia than healthy controls.
Impaired executive functioning is one of the most commonly noted deficits associated with schizophrenia (Eisenberg and Berman, 2010). Several different types of correlated skills are typically subsumed under “executive” or “frontal lobe” skills, including planning, monitoring, working memory, fluency, cognitive control, and self-regulation/impulse control. Of course, other cognitive deficits are common in schizophrenia and recent large-scale factor analytic studies demonstrate the existence of a generalized cognitive deficit, in addition to deficits in secondary factors (Dickinson et al., 2011). Executive deficits may also be central to the endophenotype of schizophrenia (Gottesman and Gould, 2003) for several reasons. Executive ability is heritable (Friedman et al., 2008) and non-schizophrenic relatives of individuals with schizophrenia have relatively impaired executive performance (Snitz et al., 2006) and reduced prefrontal gray matter volumes (Goghari et al., 2010). Moreover, a study with first episode patients showed that severe impairment of executive functioning was present at the beginning of the disease (Hutton et al., 1998). It is also important to note that executive deficits have important real-world consequences for individuals with schizophrenia. Lower executive skills predict reduced insight (Chan et al., 2012), reduced daily living skills (Puig et al., 2012), and reduced levels of remission (Hofer et al., 2011). Despite these prominent correlates, caution must be exercised in asserting the primary cognitive importance of executive deficits, as general intellectual ability (“g”) correlates substantially with most measures of executive skill.
The manner in which low parental SES might impact executive skill and its anatomical substrates is poorly understood. A recent meta-analysis of functional neuroimaging studies concluded that similar brain networks were activated in both individuals with schizophrenia and controls during performance of executive tasks, e.g., dorsolateral, ventrolateral, and midline prefrontal regions, as well as the anterior cingulate gyrus (Minzenberg et al., 2009). We are not aware of any studies that have specifically examined the impact of pSES on these brain structures, though studies of related social factors have begun to emerge. Healthy children of healthy parents with low income were found to have reduced hippocampal volume in a recent voxel-based morphometry (VBM) study (Hanson et al., 2011), but prefrontal regions were not examined. Other studies focusing on adverse childhood experiences have found that healthy adults with substantial early life stress had reduced anterior cingulate and caudate volumes (Cohen et al., 2006), while a related study noted that childhood emotional maltreatment was associated with reduced medial prefrontal cortex volumes (van Harmelen et al., 2010). An important question is whether the regions identified in these studies are affected by low pSES in individuals with schizophrenia.
The first goal of the current study was to investigate the association of parental SES with executive function in both healthy controls and patients with schizophrenia. Results indicated a greater impact of pSES in patients than controls. To follow up this finding, the second major goal of the current study was to evaluate the impact of pSES on cortical gray matter in both groups using VBM.
Methods
Participants
Data was collected from four different sites: the Mind Research Network/University of New Mexicoin Albuquerque, New Mexico, the University of Minnesota, Massachusetts General Hospital, and the University of Iowa. Patients were recruited from hospitals and outpatient clinics associated with the sites. Patients with a history of neurologic or psychiatric diseases other than schizophrenia were excluded. Additionally, patients who experienced head injuries, a history of substance dependence or abuse, or an IQ less than or equal to 70 were excluded. All study participants underwent an extensive clinical diagnostic assessment that included either the SCID-I/P or NP (First et al., 2002) or the Comprehensive Assessment of Symptoms and History (CASH) (Andreasen et al., 1992). Control participants were recruited using flyers, newspaper ads, and word-of-mouth. For statistical purposes, ethnicity was quantified as “minority” (African American, Asian, Native American, Hispanic/Latino, or mixed) or “non-minority”. Patient and control groups did not differ in terms of age, handedness, or parental socioeconomic status. As expected, however, controls were had significantly more education than patients, better self SES (sSES), and were more apt to be male and minority group members. Participants included 102 schizophrenia patients (male, female) and 125 healthy controls (male, female). Demographic information, including age, ethnicity, pSES, and sSES are shown in Table 1.
Table 1. Demographic Information.
| Controls | Patients | Significance | |
|---|---|---|---|
| Age (mean, SD) | 32.39 (10.92) | 34.36(10.89) | ns |
| Education (mean, SD) | 15.35 (1.98) | 13.26(2.63) | <0.001 |
| Parent SES | 2.70 (.77) | 2.82 (1.00) | ns |
| Self SES | 2.66 (.53) | 3.53 (.98) | <0.001 |
| Sex (M, F) | 76, 49 | 76, 26 | .03 |
| Ethnicity (% minority) | 11 | 24 | .01 |
Note. Significance levels determined by independent samples t- test or chi square analysis. Ethnicity was coded as “minority” and “not-minority”.
Measures
Cognitive Tests
Participants completed a number of tests of diverse cognitive skills (Sponheim et al., 2010). However, only measures of intelligence and executive functioning will be discussed in the current report, as these skills have been most frequently studied with respect to SES. For additional information on the neuropsychological assessments used in the current study see (Lezak, 2012). Intelligence was assessed with selected subtests of the Wechsler Adult Intelligence Scale III (Wechsler, 1997): Block Design, Letter Number, Vocabulary, and Similarities. An estimate of intelligence was calculated from the average of these age-corrected subtest scaled scores. Executive skills were assessed with a battery of six tests, yielding a total of 10 variables. Verbal fluency was assessed with the letter fluency (letters F, A, and S) and category fluency tests (animals, fruits) from the Delis-Kaplan Executive Functional System (Delis, 2001). Both total time and number of errors on the Trail Making Test B, a measure of processing speed, working memory, and sequencing, were also assessed. A computerized version of the Tower of London test (Shallice, 1982) was administered to assess planning and problem solving. Three variables from this test were used: excess moves on the 3, 4, and 5 ring problems. The California Computerized Assessment Package (CalCap) taps processing speed, attention and executive skills (LaPointe, 2007). We included false positive errors from the Serial Pattern Matching 1 and Serial Pattern Matching 2subtests, as false positive errors in part reflects impulsive responding, a core component of executive skill. A measure of general intellectual functioning was obtained by averaging scaled scores from four subtests of the Wechsler Adult Intelligence Scale, Third Edition (WAIS – 3)): Block Design, Vocabulary, Similarities, and Letter Number Sequencing.
Socioeconomic Status (SES
SES is generally viewed in terms of capital, including material resources (financial capital), nonmaterial resources such as education (human capital), and resources obtained through social connection (social capital) (Bradley and Corwyn, 2002). For the purposes of this report, pSES was calculated using the modified Hollingshead-Redlich scale (Hollingshead, 1958). This scale established a “global” rating of the highest SES level sustained for a significant period of time. The Hollingshead-Redlich scale is based on occupation and educational level of both parents and is ranked on a five-point scale (1 = highest, 5 = lowest). Occasionally, classification involved some clinical judgment.
Symptom Scales
The global ratings for delusions and hallucinations on the Scale for the Assessment of Positive Symptoms (Andreasen, 1983) provided a measure of positive symptoms. Negative symptoms were represented by the sum of global ratings for alogia, affective flattening, anhedonia, and avolition on the Scale for the Assessment of Negative Symptoms (Andreasen et al., 1992). Disorganized symptoms were assessed through the global rating of formal thought disorder, bizarre behaviors, and inappropriate affect on the SAPS.
Voxel Based Morphometry
Analyses were conducted to assess the potential impact and importance of pSES on regional gray matter (GM) volumes. VBM was used to assess GM of the entire cortex, as opposed to a region of interest analysis, which requires a priori selection of a few regions. VBM is a computerized structural magnetic resonance imaging (MRI) analysis technique that enables an unbiased voxel-by-voxel comparison of cortical volumes (Whitwell, 2009).
MRI Acquisition
The scanner manufacturer (General Electric and Siemens), implemented pulse sequences, and field strength (3 sites at 1.5 T and 1 site at 3.0 T) differed across the four sites. For a more details on MR imaging parameters and differences across sites see Segall et al. (Segall et al., 2009).
Voxel Based Morphometry Analyses
All VBM procedures were conducted using Statistical Parametric Mapping 5 (SPM5) a program running through Mathworks (Matlab 7.2). Each T1 image was segmented into gray matter, white matter, and cerebral spinal fluid images using unified segmentation parameters (Ashburner and Friston, 2005). Total cortical gray matter volume measures were obtained as a result of this analysis. Unmodulated normalized GM images were smoothed using a 10-mm Gaussian kernel. (For a more comprehensive description of VBM preprocessing procedures used on this dataset see (Segall et al., 2009). Multiple regressions were conducted to assess the effect of parental SES on GM concentration within the schizophrenia group and within the healthy control group. In each analysis age, sex, ethnicity and image acquisition site (dummy coded) were entered as covariates. An FDR correction for multiple comparisons (p = 0.05) and a cluster size threshold of 10 voxels (K = 10) were employed for all analyses. Regions significantly associated with pSES were next examined to determine whether GM variation in these regions was related to the executive function measures.
Statistical Analysis
All statistical analyses were conducted in SPSS (v.17.0). A principal component analysis with oblimin rotation (which allows for the emergence of correlated factors) was performed on the 10 executive function variables, from participants of both groups, to determine a smaller number of latent factors. Subsequently, multiple regression procedures were used to evaluate the relationship between pSES and cognitive skills, controlling for various extraneous factors (e.g., sex, age, and ethnicity). We also report a secondary analysis with additional covariates (general intellectual ability, education level, and self SES). As each of these additional covariates is related to the diagnosis of schizophrenia, we have substantially less power to detect group effects in this analysis. Thus, our initial analysis provides the most accurate estimate of effect sizes, while the secondary analysis potentially provides insight into the robustness of any possible pSES effects.
Results
Demographic characteristics of both groups are provided in Table 1. The patient group had significantly less education and lower sSES. It was also comprised of relatively more males and more members of minority groups. Age and pSES did not differ across groups. The largest percentage of our sample (47.6%) was at level three pSES. sSES and pSES were correlated at r = .47 (p <0.001) in controls and r = .44 (p <0.001) in patients. Specific diagnoses of individuals within the patient group were: paranoid (N = 65, 64%), undifferentiated (N = 25, 24%), disorganized (N = 6, 5%), schizophreniform (N = 4, 4%), residual (N = 2, 2%), and schizoaffective (N = 1, 1%). For descriptive purposes, the patient group obtained these mean scores on schizophrenia symptom scales: Positive symptoms = 4.97 (SD = 2.78); Negative symptoms = 7.91 (3.92), and Disorganized symptoms = 1.93 (2.00). Test data for the executive ability variables (raw scores), the intellectual ability variable (average of scaled scores), and executive components (see below) are provided in Table 2.
Table 2. Test performance of both groups with significance testing.
| Controls | Patients | ||
|---|---|---|---|
| Test Variables | Mean (SD) | Mean (SD) | Significance |
| Fluency: Animals (number words) | 22.48 (4.51) | 17.76 (4.95) | <0.001 |
| Fluency: fruits (number words) | 15.77 (3.94) | 11.52 (3.46) | <0.001 |
| Fluency: FAS (number words) | 42.16 (10.18) | 34.86 (10.91) | <0.001 |
| Trails B: Time (sec) | 55.50 (19.67) | 94.88 (68.41) | .004 |
| Trails B: Number of Errors | 41 (.83) | .82 (1.28) | <0.001 |
| 3 Ring Tower: Excess Moves | 3.81 (4.53) | 8.84 (9.74) | <0.001 |
| 4 Ring Tower: Excess Moves | 1.72 (2.29) | 3.80 (3.87) | <0.001 |
| 5 Ring Tower: Excess Moves | .99 (2.05) | 4.05 (7.89) | <0.001 |
| CalCap SEQ1: False Positive Errors | .86 (1.29) | 2.02 (2.22) | <0.001 |
| CalCap SEQ2: False Positive Errors | 2.45 (1.69) | 3.44 (2.15) | <0.001 |
| Intelligence (Mean scaled score) | 12.39 (1.87) | 9.54 (2.69) | <0.001 |
| Executive Components | |||
| “Verbal Fluency” | .52 (.85) | - .52 (.954) | <0.001 |
| “Planning” | .39 (.45) | - .44 (1.32) | <0.001 |
| “Inhibition” | .26 (.55) | - .25 (.94) | <0.001 |
Note: Significance levels determined by independent samples t- tests. See Methods section for test details.
A principal components analysis of the 10 executive function measures revealed three components with an eigenvalue greater than one. These were retained as measures of executive function and the loadings of individual tests on these components are shown in Table 3. Component one (35.14% of total variance accounted for), labeled “Fluency,” had the highest loadings from the animals, total FAS, and fruits fluency tasks. Component two (13.06%), labeled “Planning,” included Trails B: time, Trails B: errors, and excess moves on the 3, 4, and 5 ring versions of the Tower of London. Component three (11.16% variance), was termed “Inhibition” and had strong loadings from the CRT SEQ1: False Positive and CRT SEQ2: False Positive variables.
Table 3. Structure Matrix for test loadings on Executive Function Components.
| Component | |||
|---|---|---|---|
| Fluency | Planning | Inhibition | |
| Animals | -.810 | -.326 | -.393 |
| Total FAS | -.789 | -.253 | -.191 |
| Fruits | -.823 | -.271 | -.184 |
| Trails B: Time | .554 | .684 | .392 |
| Trails B: Errors | .311 | .566 | .264 |
| Excess Moves: 3 ring | .084 | .685 | .102 |
| Excess Moves: 4 ring | .227 | .764 | .230 |
| Excess Moves: 5 Ring | .331 | .717 | .139 |
| CalCap SEQ1: False Positive Errors | .323 | .295 | .799 |
| CalCap SEQ2: False Positive Errors | .164 | .152 | .851 |
A general linear model multivariate analysis was conducted with the three components. Dependent variables included the three executive functions; fixed factors included group, ethnicity, pSES, and sex; age was entered as a covariate. The model also included an interaction of group and parental SES. The overall model was significant, and there was a significant effect of group, as the patient group performed worse than the control group on each component. A main effect was noted for pSES across the three executive functioning components (F (12, 212) = 3.79, p<0.001).
The main effect of pSES was significant for all three executive functioning components individually (Fluency: F (4, 214) = 2.47, p<0.05; Planning: F (4, 214) = 2.95, p<0.05; Inhibition: F (4, 214) = 7.95, p <0.001). However, the interaction of group and pSES was also significant overall (F (12,212) = 3.02, p <0.001). The interaction of group and pSES was significant individually for Planning and Inhibition (Planning: F (4, 214) = 4.60, p <0.001; Inhibition: F (4, 214) = 4.63, p <0.001). Within group follow-up analyses of the interaction revealed a significant adverse effect for pSES among individuals with schizophrenia, but not controls, on these two executive components.
An additional, supplementary general linear model multivariate analysis was performed adding three more covariates (WAIS- 3 mean scaled score, sSES, and education level). Despite reduced power to detect main effects and interactions with the group variable due to the additional covariates, significant multivariate main effects were noted for group (F(3, 204) = 3.54, p = .016) and pSES (F(12, 204) = 3.21, p< .001), as well as their interaction (F(12, 204) = 2.11, p = .15). Looking more closely at effects for each executive function variable, the main effect of pSES was significant for Planning (F (4, 206) = 3.74, p = .006) and Inhibition (F (4, 206) = 5.85, p < .01), while the interaction of pSES with group was significant only for the Inhibition variable (F (4, 206) = 4.03 p = .004). These results indicate the robust nature of the pSES by group interaction, as it remains a significant predictor of overall executive function, even when central features of the extended phenotype of schizophrenia are covaried.
Imaging Results
Given the interactions described above, VBM analyses and correlations with overall gray matter volume were conducted independently in each group. pSES was negatively correlated with total cortical GM in the patient group after partialling age, sex, and ethnicity, such that lower pSES categories were associated with reduced gray matter (r = -.25; p = .01); among controls, no relationship was observed (r = -.04, ns). Partial correlations also revealed that total cortical gray matter volume was significantly correlated with Planning (r = .30, p = .002) and Inhibition (r = .26, p = .01) in the patient group; no significant relationships were observed in controls.
In VBM, regional analyses were localized using WFU-Pick Atlas (Maldjian et al., 2003), a toolbox running in SPM5. In the patient group, smaller GM volumes were observed bilaterally in the frontal cortex and limbic lobe, and in select regions of the left temporal, occipital and parietal cortices. More specifically, smaller volumes in the right frontal cortex were observed in the medial frontal gyrus (t = 4.86), inferior frontal gyrus (t = 3.91; t = 3.66), and superior frontal gyrus (t = 3.82; t = 3.71). Smaller volumes in the left frontal cortex were observed in the middle frontal gyrus (t = 4.53; t = 4.42), inferior frontal gyrus (t = 4.45), precentral gyrus (t = 4.01; t = 3.68), and paracentral lobule (t = 3.49). Smaller volumes were observed in the right cingulate gyrus (t = 3.77; t = 3.74) and left cingulate gyrus (t = 3.71). Additionally, smaller volumes were observed in the left inferior occipital gyrus (t = 4.12), left middle temporal gyrus (t = 3.81), and left precuneus (t = 3.68). pSES was not positively correlated with any GM volumes in this sample. (For the corresponding MNI coordinates, t-values, cluster size, and localizations of each cluster please refer to Table 5. Figure 1 shows these results displayed on axial slices.
Table 5.
Voxel-Based Morphometry analysis of the effects of parental SES on gray matter volume in the patient group, controlling for age, sex, and site. All regions indicated were significant at False Discovery Rate (FDR) p <0.05. K indicates cluster size and x, y, and z, indicate the location of the peak significance for each cluster. See Figure 1 for a graphic representation.
| Cluster | R/L | Lobe | TD label | Brodmann | K | t | x | y | z |
| 1 | R | Frontal | Right Medial Frontal gyrus | 8 | 1263 | 4.86 | 6 | 28 | 44 |
| Right Medial Frontal gyrus | 6 | 40 | 44 | ||||||
| Left Medial Frontal gyrus | -4 | 22 | 52 | ||||||
| 2 | L | Frontal | Left Middle Frontal gyrus | 9 | 136 | 4.53 | -32 | 34 | 40 |
| Left Middle Frontal gyrus | -42 | 20 | 48 | ||||||
| Left Middle Frontal gyrus | -46 | 8 | 52 | ||||||
| 3 | L | Frontal | Left Inferior Frontal gyrus | 9 | 200 | 4.45 | -62 | 6 | 26 |
| Left precentral gyrus | -58 | 0 | 34 | ||||||
| Left precentral gyrus | 6 | -60 | 2 | 14 | |||||
| 4 | L | Frontal | Left Middle Frontal gyrus | 46 | 100 | 4.42 | -46 | 30 | 22 |
| 5 | L | Occipital | Left Inferior occipital gyrus | 49 | 4.12 | -38 | -80 | -12 | |
| Occipital | Sub-gyral | -28 | -76 | -6 | |||||
| 6 | L | Frontal | Left Precentral gyrus | 49 | 4.01 | -52 | -12 | 34 | |
| 7 | R | Frontal | Right Inferior Frontal gyrus | 40 | 3.91 | 50 | 26 | 20 | |
| 8 | R | Frontal | Right Superior Frontal gyrus | 20 | 3.82 | 16 | 28 | 54 | |
| 9 | L | Temporal | Left Middle Temporal gyrus | 27 | 3.81 | -56 | 0 | -24 | |
| 10 | R | Limbic | Right Cingulate gyrus | 32 | 13 | 3.77 | 6 | 14 | 34 |
| 11 | R | Limbic | Right Cingulate gyrus | 23 | 3.74 | 6 | -38 | 38 | |
| 12 | L | Limbic | Left Cingulate gyrus | 19 | 3.71 | -10 | -42 | 40 | |
| 13 | R | Frontal | Right Superior Frontal gyrus | 15 | 3.71 | 18 | 16 | 64 | |
| 14 | L | Parietal | Left Precuneus (gyrus) | 7 | 19 | 3.68 | -6 | -64 | 56 |
| 15 | L | Frontal | Left Precentral gyrus | 6 | 40 | 3.68 | -42 | -6 | 48 |
| 16 | R | Frontal | Right Inferior Frontal gyrus | 13 | 3.66 | 46 | 34 | -8 | |
| 17 | L | Frontal | Left Paracentral lobule | 12 | 3.49 | 2 | -34 | 58 |
Figure 1.
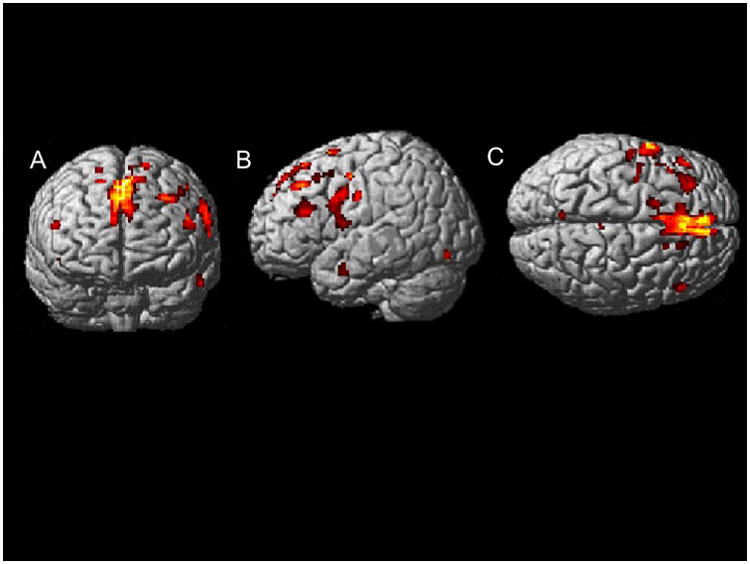
Voxel-Based Morphometry (VBM) analysis of the effects of parental SES on gray matter volume in the patient group, controlling for age, sex, and site. A: Coronal view; B: Sagittal view of left hemisphere; C: axial view. All regions indicated were significant at False Discovery Rate (FDR) p<0.05.
Given these results, we next used VBM to evaluate the relationship between GM variations in these regions with the three executive function variables in the patient group. Rather than examining the total brain, we limited our analyses to the major regions indicated in Table 5. To do so we placed spheres centered on the coordinates for the three largest clusters, covering approximately 80% of the identified voxels significantly linked with pSES, again controlling for age, sex, ethnicity, and site. No regions exceeded the FDR significance threshold for either group.
Discussion
The most central results of the current study were that (1) low SES in childhood was related to lower Planning and Inhibition skills in individuals with schizophrenia but not controls, and (2) low SES in childhood was related to reduced GM in diverse anterior brain regions, especially the superior frontal gyrus, in individuals with schizophrenia but not controls. These cognitive results were specific to Planning and Inhibition, as no trend was noted for Fluency. Adding additional covariates correlated with the diagnosis of schizophrenia (reduced intellectual functioning, education, and sSES) attenuated significance levels, as expected, but left intact the significant interaction of group with pSES. Overall, individuals with schizophrenia showed greater sensitivity to early environmental stress than controls, consistent with our hypothesis (Yeo et al., 1999, Yeo et al., 2007) that reduced canalization, or reduced buffering to adversity, is central to the phenotype of schizophrenia.
Our negative VBM results relating regional gray matter density to executive function should be interpreted in the context of our prior report on group differences in regional gray matter morphology. Widespread gray matter reductions were found in the patient group, most prominently in fronto-temporal cortex (Segall et al., 2009), including the smaller set of regions we now find linked with pSES. The current VBM analyses showed that most of the GM correlates of pSES in the patient group were in the prefrontal cortex. The largest cluster was in bilateral superior-medial frontal regions, followed by smaller clusters localized mostly to the anterior half of the left hemisphere. Follow-up VBM analyses revealed no significant association (positive or negative) of GM concentration with executive skills in the patient group. Perhaps this is not too surprising, however, as the integrity of many other cortical regions may contribute to the observed levels of executive functioning. Consistent with this formulation, total cortical gray matter volume was correlated with Planning and Inhibition in patients, but not controls. Further, other aspects of superior-medial frontal regions besides GM concentration may be quite important. For example, variation in cortical surface area and thickness, the two determinants of volume, reflect different neurodevelopmental processes that could be more related to executive skill levels than volume or concentration measures (Winkler et al., 2010). Our finding of superior-medial prefrontal GM reduction resembles the superior frontal gyrus GM volume reductions reported by van Harmelen et al. (van Harmelen et al., 2010) for a rather different aspect of childhood environment, emotional maltreatment.
A wealth of important functions has been linked with superior-middle prefrontal regions, in addition to traditional cognitive skills. These include reality monitoring (Buda et al., 2011) and dynamic social comparison (Zink et al., 2008). Perhaps most important is the fact that this region appears to serve as a cortical hub, a hyper-connected region central to many functional brain networks (Hagmann et al., 2008) that appears to be abnormal in individuals with schizophrenia (van den Heuvel et al., 2010). Network models suggest that dysfunction of this region leads to a substantial reduction in the brain's global efficiency (van den Heuvel and Sporns, 2011).
The current results add to a growing body of research identifying non-genetic psychosocial risk factors for developing schizophrenia (van Os, 2010). Healthy adult controls do not appear to be adversely affected by low pSES, though other studies have reported important effects in healthy children (Hackman et al., 2010), a pattern consistent with the general reduction in the importance of shared environmental factors with increasing age (Haworth et al., 2010). Psychosocial interventions would thus be most effective if targeted at families specifically at risk for developing schizophrenia.
There are several important limitations to this study, and foremost among these are the nature of the specific cognitive variables utilized. Our measure of intelligence, though based on subtests from the WAIS III, included primarily verbal tests. Fluency was also assessed with only verbal tests. Future investigations might benefit from the addition of more comprehensive estimates of intelligence and nonverbal measures of fluency. Similarly, our results are specific to the executive tasks used. Our executive measures did not emphasize working memory skill, which is a central component of most models of executive functioning. Another important consideration stems from the rather nonspecific marker available to characterize environment – pSES. We do not know which components of pSES are most important. Important correlates of pSES that could plausibly impact cognitive functioning and morphology include prenatal health care, community or neighborhood variables linked with psychosocial stress, and parental emotional environment, among others. It is also important to note that since our groups were matched on pSES, we cannot evaluate the risk of low pSES for developing schizophrenia. On the other hand, matching facilitates analysis of the impact of pSES on specific features of schizophrenia, avoiding the complexities of treating it as a covariate.Table 4. Correlations between major cognitive measures, by group. Patients are represented above the slash and controls below.
Table 4. Correlations between major cognitive measures, by group. Patients are represented above the slash and controls below.
| Fluency | Planning | Inhibition | |
| Planning | .36***/.01 | -- | |
| Inhibition | .38***/.11 | .24*/.12 | |
| Intelligence | .55***/.51*** | .55***/.30** | .41***/.26** |
NOTE:
p<0.05,
p<0.01,
p<0.001
Acknowledgments
This research was supported by grants from the Department of Energy under Award Number DE-FG02-08ER64581, and the National Institute Health (grants 5P20RR021938, 1RC1MH089257 and R01EB005846.
Footnotes
Financial Disclosure: All authors report no biomedical financial interests or potential conflicts of interest.
References
- Andreasen NC. The Scale for the Assessment of Positive Symptoms. Iowa City: University of Iowa; 1983. [Google Scholar]
- Andreasen NC, Flaum M, Arndt S. The Comprehensive Assessment of Symptoms and History (Cash) - an Instrument for Assessing Diagnosis and Psychopathology. Archives of General Psychiatry. 1992;49:615–623. doi: 10.1001/archpsyc.1992.01820080023004. [DOI] [PubMed] [Google Scholar]
- Ashburner J, Friston KJ. Unified segmentation. Neuroimage. 2005;26:839–851. doi: 10.1016/j.neuroimage.2005.02.018. [DOI] [PubMed] [Google Scholar]
- Bradley RH, Corwyn RF. Socioeconomic status and child development. Annual Review of Psychology. 2002;53:371–399. doi: 10.1146/annurev.psych.53.100901.135233. [DOI] [PubMed] [Google Scholar]
- Buda M, Fornito A, Bergstrom ZM, Simons JS. A Specific Brain Structural Basis for Individual Differences in Reality Monitoring. Journal of Neuroscience. 2011;31:14308–14313. doi: 10.1523/JNEUROSCI.3595-11.2011. [DOI] [PMC free article] [PubMed] [Google Scholar]
- Chan SKW, Chan KKS, Lam MML, Chiu CPY, Hui CLM, Wong GHY, Chang WC, Chen EYH. Clinical and cognitive correlates of insight in first-episode schizophrenia. Schizophrenia Research. 2012;135:40–45. doi: 10.1016/j.schres.2011.12.013. [DOI] [PubMed] [Google Scholar]
- Cohen RA, Grieve S, Hoth KF, Paul RH, Sweet L, Tate D, Gunstad J, Stroud L, Mccaffery J, Hitsman B, Niaura R, Clark CR, Macfarlane A, Bryant R, Gordon E, Williams LM. Early life stress and morphometry of the adult anterior cingulate cortex and caudate nuclei. Biological Psychiatry. 2006;59:975–982. doi: 10.1016/j.biopsych.2005.12.016. [DOI] [PubMed] [Google Scholar]
- Delis D, Kaplan E, Kramer J. The Delis-Kaplan Executive Function System. San Antonio, TX: Psychological Corporation; 2001. [Google Scholar]
- Dickinson D, Goldberg TE, Gold JM, Elvevag B, Weinberger DR. Cognitive Factor Structure and Invariance in People With Schizophrenia, Their Unaffected Siblings, and Controls. Schizophrenia Bulletin. 2011;37:1157–1167. doi: 10.1093/schbul/sbq018. [DOI] [PMC free article] [PubMed] [Google Scholar]
- Eisenberg DP, Berman KF. Executive Function, Neural Circuitry, and Genetic Mechanisms in Schizophrenia. Neuropsychopharmacology. 2010;35:258–277. doi: 10.1038/npp.2009.111. [DOI] [PMC free article] [PubMed] [Google Scholar]
- First MB, Spitzer RL, Gibbon M, Williams JBW. Structured Clinical Interview for DSM-IV-TR Axis I Disorders, Research Version, Nonpatient Edition. New York: New York State Psychiatric Institute; 2002. [Google Scholar]
- Friedman NP, Miyake A, Young SE, Defries JC, Corley RP, Hewitt JK. Individual differences in executive functions are almost entirely genetic in origin. Journal of Experimental Psychology-General. 2008;137:201–225. doi: 10.1037/0096-3445.137.2.201. [DOI] [PMC free article] [PubMed] [Google Scholar]
- Goghari VM, Sponheim SR, Macdonald AW. The functional neuroanatomy of symptom dimensions in schizophrenia: A qualitative and quantitative review of a persistent question. Neuroscience and Biobehavioral Reviews. 2010;34:468–486. doi: 10.1016/j.neubiorev.2009.09.004. [DOI] [PMC free article] [PubMed] [Google Scholar]
- Gottesman II, Gould TD. The endophenotype concept in psychiatry: Etymology and strategic intentions. American Journal of Psychiatry. 2003;160:636–645. doi: 10.1176/appi.ajp.160.4.636. [DOI] [PubMed] [Google Scholar]
- Habets P, Marcelis M, Gronenschild E, Drukker M, Van Os J Group. Reduced Cortical Thickness as an Outcome of Differential Sensitivity to Environmental Risks in Schizophrenia. Biological Psychiatry. 2011;69:487–494. doi: 10.1016/j.biopsych.2010.08.010. [DOI] [PubMed] [Google Scholar]
- Hackman DA, Farah MJ, Meaney MJ. Socioeconomic status and the brain: mechanistic insights from human and animal research. Nature Reviews Neuroscience. 2010;11:651–659. doi: 10.1038/nrn2897. [DOI] [PMC free article] [PubMed] [Google Scholar]
- Hagmann P, Cammoun L, Gigandet X, Meuli R, Honey CJ, Wedeen V, Sporns O. Mapping the structural core of human cerebral cortex. Plos Biology. 2008;6:1479–1493. doi: 10.1371/journal.pbio.0060159. [DOI] [PMC free article] [PubMed] [Google Scholar]
- Hanscombe KB, Trzaskowski M, Haworth CMA, Davis OSP, Dale PS, Plomin R. Socioeconomic Status (SES) and Children's Intelligence (IQ): In a UK-Representative Sample SES Moderates the Environmental, Not Genetic, Effect on IQ. Plos One. 2012;7 doi: 10.1371/journal.pone.0030320. [DOI] [PMC free article] [PubMed] [Google Scholar]
- Hanson JL, Chandra A, Wolfe BL, Pollak SD. Association between Income and the Hippocampus. Plos One. 2011;6 doi: 10.1371/journal.pone.0018712. [DOI] [PMC free article] [PubMed] [Google Scholar]
- Haworth CMA, Wright MJ, Luciano M, Martin NG, De Geus EJC, Van Beijsterveldt CEM, Bartels M, Posthuma D, Boomsma DI, Davis OSP, Kovas Y, Corley RP, Defries JC, Hewitt JK, Olson RK, Rhea SA, Wadsworth SJ, Iacono WG, Mcgue M, Thompson LA, Hart SA, Petrill SA, Lubinski D, Plomin R. The heritability of general cognitive ability increases linearly from childhood to young adulthood. Molecular Psychiatry. 2010;15:1112–1120. doi: 10.1038/mp.2009.55. [DOI] [PMC free article] [PubMed] [Google Scholar]
- Hofer A, Bodner T, Kaufmann A, Kemmler G, Mattarei U, Pfaffenberger NM, Rettenbacher MA, Trebo E, Yalcin N, Fleischhacker WW. Symptomatic remission and neurocognitive functioning in patients with schizophrenia. Psychological Medicine. 2011;41:2131–2139. doi: 10.1017/S0033291711000353. [DOI] [PubMed] [Google Scholar]
- Hollingshead AB, Redlich FC. Social class and mental illness: A community study. NY, NY: Wiley and Sons; 1958. [DOI] [PMC free article] [PubMed] [Google Scholar]
- Hutton SB, Puri BK, Duncan LJ, Robbins TW, Barnes TRE, Joyce EM. Executive function in first-episode schizophrenia. Psychological Medicine. 1998;28:463–473. doi: 10.1017/s0033291797006041. [DOI] [PubMed] [Google Scholar]
- Lapointe LL, Heald GR, Stierwalt JAG, Kemker BE, Maurice T. Effects of auditory distraction on cognitive processing of young adults. Journal of Attention Disorders. 2007;10:398–409. doi: 10.1177/1087054706293221. [DOI] [PubMed] [Google Scholar]
- Lezak MD, Howieson DB, Bigler ED, Tranel D. Neuropsychological Assessment. 5th. NY, NY: Oxford University Press; 2012. [Google Scholar]
- Maldjian JA, Laurienti PJ, Kraft RA, Burdette JH. An automated method for neuroanatomic and cytoarchitectonic atlas-based interrogation of fMRI data sets. Neuroimage. 2003;19:1233–1239. doi: 10.1016/s1053-8119(03)00169-1. [DOI] [PubMed] [Google Scholar]
- McNeil TF, Cantor-Graae E, Weinberger DR. Relationship of obstetric complications and differences in size of brain structures in monozygotic twin pairs discordant for schizophrenia. American Journal of Psychiatry. 2000;157:203–212. doi: 10.1176/appi.ajp.157.2.203. [DOI] [PubMed] [Google Scholar]
- Minzenberg MJ, Laird AR, Thelen S, Carter CS, Glahn DC. Meta-analysis of 41 Functional Neuroimaging Studies of Executive Function in Schizophrenia. Archives of General Psychiatry. 2009;66:811–822. doi: 10.1001/archgenpsychiatry.2009.91. [DOI] [PMC free article] [PubMed] [Google Scholar]
- Nisbett RE, Aronson J, Blair C, Dickens W, Flynn J, Halpern DF, Turkheimer E. Intelligence New Findings and Theoretical Developments. American Psychologist. 2012;67:130–159. doi: 10.1037/a0026699. [DOI] [PubMed] [Google Scholar]
- Puig O, Penades R, Baeza I, Sanchez-Gistau V, De La Serna E, Fonrodona L, Andres-Perpina S, Bernardo M, Castro-Fornieles J. Processing speed and executive functions predict real-world everyday living skills in adolescents with early-onset schizophrenia. European Child & Adolescent Psychiatry. 2012;21:315–326. doi: 10.1007/s00787-012-0262-0. [DOI] [PubMed] [Google Scholar]
- Segall JM, Turner JA, Van Erp TGM, White T, Bockholt HJ, Gollub RL, Ho BC, Magnotta V, Jung RE, Mccarley RW, Schulz SC, Lauriello J, Clark VP, Voyvodic JT, Diaz MT, Calhoun VD. Voxel-based Morphometric Multisite Collaborative Study on Schizophrenia. Schizophrenia Bulletin. 2009;35:82–95. doi: 10.1093/schbul/sbn150. [DOI] [PMC free article] [PubMed] [Google Scholar]
- Shallice T. Specific Impairments of Planning. Philosophical Transactions of the Royal Society of London Series B-Biological Sciences. 1982;298:199–209. doi: 10.1098/rstb.1982.0082. [DOI] [PubMed] [Google Scholar]
- Snitz BE, Macdonald AW, Carter CS. Cognitive deficits in unaffected first-degree relatives of schizophrenia patients: A meta-analytic review of putative endophenotypes. Schizophrenia Bulletin. 2006;32:179–194. doi: 10.1093/schbul/sbi048. [DOI] [PMC free article] [PubMed] [Google Scholar]
- Sponheim SR, Jung RE, Seidman LJ, Mesholam-Gately RI, Manoach DS, O'leary DS, Ho BC, Andreasen NC, Lauriello J, Schulz SC. Cognitive deficits in recent-onset and chronic schizophrenia. Journal of Psychiatric Research. 2010;44:421–428. doi: 10.1016/j.jpsychires.2009.09.010. [DOI] [PMC free article] [PubMed] [Google Scholar]
- Van Den Heuvel MP, Mandl RCW, Stam CJ, Kahn RS, Pol HEH. Aberrant Frontal and Temporal Complex Network Structure in Schizophrenia: A Graph Theoretical Analysis. Journal of Neuroscience. 2010;30:15915–15926. doi: 10.1523/JNEUROSCI.2874-10.2010. [DOI] [PMC free article] [PubMed] [Google Scholar]
- Van Den Heuvel MP, Sporns O. Rich-Club Organization of the Human Connectome. Journal of Neuroscience. 2011;31:15775–15786. doi: 10.1523/JNEUROSCI.3539-11.2011. [DOI] [PMC free article] [PubMed] [Google Scholar]
- Van Harmelen AL, Van Tol MJ, Van Der Wee NJA, Veltman DJ, Aleman A, Spinhoven P, Van Buchem MA, Zitman FG, Penninx BWJH, Elzinga BM. Reduced Medial Prefrontal Cortex Volume in Adults Reporting Childhood Emotional Maltreatment. Biological Psychiatry. 2010;68:832–838. doi: 10.1016/j.biopsych.2010.06.011. [DOI] [PubMed] [Google Scholar]
- Van Os J, Kenis G, Rutten B. The environment and schizophrenia. Nature Perspectives. 2010;468:203–212. doi: 10.1038/nature09563. [DOI] [PubMed] [Google Scholar]
- Wechsler D. Wechsler Adult Intelligence Scale. 3rd. San Antonio, TX: Psychological Corporation; 1997. [Google Scholar]
- Welch KA, Mcintosh AM, Job DE, Whalley HC, Moorhead TW, Hall J, Owens DGC, Lawrie SM, Johnstone EC. The Impact of Substance Use on Brain Structure in People at High Risk of Developing Schizophrenia. Schizophrenia Bulletin. 2011;37:1066–1076. doi: 10.1093/schbul/sbq013. [DOI] [PMC free article] [PubMed] [Google Scholar]
- Whitwell JL. Voxel-Based Morphometry: An Automated Technique for Assessing Structural Changes in the Brain. Journal of Neuroscience. 2009;29:9661–9664. doi: 10.1523/JNEUROSCI.2160-09.2009. [DOI] [PMC free article] [PubMed] [Google Scholar]
- Winkler AM, Kochunov P, Blangero J, Almasy L, Zilles K, Fox PT, Duggirala R, Glahn DC. Cortical thickness or grey matter volume? The importance of selecting the phenotype for imaging genetics studies. Neuroimage. 2010;53:1135–1146. doi: 10.1016/j.neuroimage.2009.12.028. [DOI] [PMC free article] [PubMed] [Google Scholar]
- Yeo RA, Gangestad SW, Edgar C, Thoma R. The evolutionary genetic underpinnings of schizophrenia: the developmental instability model. Schizophrenia Research. 1999;39:197–206. doi: 10.1016/s0920-9964(99)00074-2. [DOI] [PubMed] [Google Scholar]
- Yeo RA, Gangestad SW, Thoma RJ. Developmental instability and individual variation in brain development: Implications for the origin of neurodevelopmental disorders. Current Directions in Psychological Science. 2007;16:245–249. [Google Scholar]
- Zink CF, Tong YX, Chen Q, Bassett DS, Stein JL, Meyer-Lindenberg A. Know your place: Neural processing of social hierarchy in humans. Neuron. 2008;58:273–283. doi: 10.1016/j.neuron.2008.01.025. [DOI] [PMC free article] [PubMed] [Google Scholar]