

Abstract
Individuals with schizophrenia show a broad range of language impairments, similar to those observed in reading disability (RD). Genetic linkage and association studies of RD have identified a number of candidate RD-genes that are associated with neuronal migration. Some individuals with schizophrenia also show evidence of impaired cortical neuronal migration. We have previously linked RD-related genes with gray matter distributions in healthy controls and schizophrenia. The aim of the current study was to extend these structural findings and to examine links between putative RD-genes and functional connectivity of language-related regions in healthy controls (n=27) and schizophrenia (n=28). Parallel independent component analysis (parallel-ICA) was used to examine the relationship between language-related regions extracted from resting-state fMRI and 16 single nucleotide polymorphisms (SNPs) spanning 5 RD-related genes. Parallel-ICA identified four significant fMRI-SNP relationships. A Left Broca-Superior/Inferior Parietal network was related to two KIAA0319 SNPs in controls but not in schizophrenia. For both diagnostic groups, a Broca-Medial Parietal network was related to two DCDC2 SNPs, while a Left Wernicke-Fronto-Occipital network was related to two KIAA0319 SNPs. A Bilateral Wernicke-Fronto-Parietal network was related to one KIAA0319 SNP only in controls. Thus, RD-genes influence functional connectivity in language-related regions, but no RD-gene uniquely affected network function in schizophrenia as compared to controls. This is in contrast with our previous study where RD-genes affected gray matter distribution in some structural networks in schizophrenia but not in controls. Thus these RD-genes may exert a more important influence on structure rather than function of language-related networks in schizophrenia.
Keywords: independent component analysis, resting state fMRI, reading, language, dyslexia genes
Introduction
Individuals with schizophrenia show a broad range of language impairments, including abnormalities in verbal pronunciation and comprehension, reduced sentence complexity, and semantic processing deficits (Li et al., 2009). It is believed that language abnormalities underlie two of the most common symptoms of schizophrenia,: auditory verbal hallucinations and formal thought disorder (Allen et al., 2008; Strik et al., 2008). In addition to more general language impairments, individuals with schizophrenia also show a specific impairment in reading ability, including reduced reading rate and comprehension of single words, synonyms, sentences, paragraphs, and stories (Hayes & O'Grady, 2006). Reading impairment exists well before illness onset (Fuller et al., 2002; Done et al., 1998) and relates to structural abnormalities of language-related neuroanatomical regions (Leonard et al., 2002). These language impairments are believed to indicate structural and functional abnormalities of the distributed network that subserves language processing, including the inferior frontal cortex (Broca's area), lateral temporal areas (including Heschl's gyrus and Wernicke's area), and medial temporal areas including the hippocampus and parahippocampal gyrus (Allen et al., 2008; Glahn et al., 2008; Li et al., 2009).
In the general population, reading disability (RD) is defined as a significant impairment in reading accuracy, speed and comprehension despite adequate intelligence and educational opportunity (Gabel et al., 2010). RD has an estimated heritability of 44-77% (DeFries et al., 1987) and has been genetically linked to nine candidate RD risk loci and associated with five candidate RD risk genes within some of these loci: DYX1C1 on DYX1 (Taipale et al., 2003), ROBO1 on DYX5 (Hannula-Jouppi et al., 2005), and DCDC2, KIAA0319 and TTRAP on DYX2 locus (Francks et al., 2004; Meng et al., 2005). All five candidate genes are believed to play a role in neuronal migration during cortex formation (Hannula-Jouppi et al., 2005; Meng et al., 2005; Parrachini et al., 2007). Interestingly, some schizophrenia individuals show impaired cortical lamination due to impaired neuronal migration (Akbarian et al., 1996; Deutsch et al., 2010), although not linked to these RD-genes. In addition to these RD candidate genes/loci, coding mutations in FOXP2 also segregate with specific language impairment (Lai et al., 2001).
In two previous studies, we examined the relationship between candidate dyslexia genes and gray matter volume in healthy controls and in schizophrenia (Jamadar et al., 2011; Meda et al., 2007). Meda et al. (2007) used a univariate approach to examine the link between an RD-associated deletion in intron 2 of DCDC2 and gray matter volume distributions in healthy individuals. Individuals with the DCDC2 deletion had higher gray matter volumes in multiple reading and language-related regions relative to those who had no deletion. Jamadar et al. (2011) used parallel independent component analysis (ICA) to examine the link between multiple single-nucleotide polymorphisms (SNPs) in the RD-associated genes described above and gray matter volume distributions in both healthy controls and individuals with schizophrenia. Three cortical networks that included multiple reading and language-related areas correlated with genotype of a DCDC2 polymorphism (rs807701) in the schizophrenia, but not in the control group. This suggests that reading difficulties in schizophrenia may be related to abnormality of gray matter structures in the distributed cortical language network.
In the current study, we extended these previous findings to examine the relationship between RD-related genes and functional language networks in healthy controls and individuals with schizophrenia using resting state fMRI. Resting state fMRI indexes the spatial synchrony of BOLD signal fluctuations that occur in the absence of overt cognitive information processing, and reflects functional communication between anatomically separated brain regions (Fox & Raichle, 2007; van den Heuvel & Hulshoff Pol, 2010; Uddin & Menon, 2010). Networks extracted from resting state fMRI correspond closely to functional networks obtained in task-related studies, suggesting that spontaneous activity in these networks is functionally meaningful and can be used to examine functional activity in the absence of a specific task (Fox & Raichle, 2007; van den Heuvel & Hulshoff Pol, 2010; Calhoun et al., 2008). This is particularly useful when examining functions where there is dispute regarding the ideal task to index a specific function (Koyama et al., 2010) or when studying psychiatric populations where it can be unclear if patients and controls are equally motivated and engaged in the task (Koyama et al., 2010; Pearlson & Calhoun, 2009). Resting state functional connectivity is disrupted in a wide range of psychiatric disorders, including schizophrenia (Jafri et al., 2008; Pearlson & Calhoun, 2009), Alzheimer's disease/mild cognitive impairment (Petrella et al., 2011) and RD/dyslexia(Koyama et al., 2010).
We used parallel ICA to examine relationships between RD-related genes and resting state functional connectivity in schizophrenia and healthy controls. Parallel ICA is a validated (Liu et al., 2009) data-driven multivariate approach that uses higher order statistics to identify the independent functional networks, SNP associations, and their interrelationships (Jagannathan et al., 2010; Liu et al., 2009). Like ‘classic’ or ‘traditional’ ICA, the algorithm can identify hidden linear factors within the genetic and imaging data, while also removing artifacts from the data. Parallel ICA yields independent components (ICs) from both data sets (imaging, genetics) that are interconnected by maximizing the linkage function in a joint estimation process (Liu et al., 2009; Calhoun et al., 2009). To this end, the parallel ICA approach attempts to solve three problems simultaneously, (a) revealing a set of spatially independent functional networks, (b) identifying independent genetic SNP associations, and (c) defining and enhancing the intrinsic relationship between the SNP components and functional networks. Components extracted from fMRI can be interpreted as networks of brain regions that express functional changes in different subjects to different degrees. Components extracted from SNP data are linear combinations of SNPs that partially determines a specific phenotype (Liu et al., 2009). The algorithm also yields loading parameters for each component that reflects the component's influence/expression in individual subjects (Calhoun et al., 2001). In this way, relationships between fMRI and SNP components can be statistically tested and compared between groups. Results show that parallel ICA provides stable results and can identify linked fMRI (or sMRI)-SNP components with a relatively high accuracy (Liu et al., 2009).
We examined the relationship between resting state activity in language-related regions and 16 SNPs from five RD-related genes: DCDC2, DYX1C1, FOXP2, KIAA0319 and TTRAP (Table 1). These are the same SNPs that we previously examined in Jamadar et al. (2011). Given previous findings that reading and language is impaired in schizophrenia, and that these genes are related to structural abnormalities in language-related areas, we hypothesized that functional language networks would be impaired in schizophrenia, and that this may be attributable to polymorphisms in RD-related genes.
Table 1. List of Genotyped SNPs.
| Gene | SNP ID | Locus | Description | Association | Notes |
|---|---|---|---|---|---|
| DCDC2 | rs1087266 | DYX2, Chr. 6p22 | Intronic | RD1 | Doublecortin domain containing 2. |
| DCDC2 | rs807701 | DYX2, Chr. 6p22 | Intronic | R2 | Involved in neuronal migration1. |
| DCDC2 | rs34705735 | DYX2, Chr. 6p22 | Intronic | Tag | |
| DCDC2 | rs793862 | DYX2, Chr. 6p22 | Intronic | RD2,3 | |
| DCDC2 | rs807724 | DYX2, Chr. 6p22 | Intronic | RD1,3 | |
|
| |||||
| KIAA0319 | rs4504469 | DYX2, Chr. 6p22 | Missense | RD4,5,6 | Transmembrane protein involved in neuronal migration11. |
| KIAA0319 | rs2038136 | DYX2, Chr. 6p22 | 5′ UTR | Tag | |
| KIAA0319 | rs2038137 | DYX2, Chr. 6p22 | 5′UTR | RD4,6 | |
|
| |||||
| TTRAP | rs2143340 | DYX2, Chr. 6p22 | Intronic | RD4,5,6,3 | Adjacent to KIAA0319 on the chromosome; has been associated with RD as part of a 3-SNP risk haplotype that also includes KIAA0319. |
| TTRAP | rs3212236 | DYX2, Chr. 6p22 | Intronic | RD5 | |
|
| |||||
| Intergenic | rs9393573 | DYX2, Chr. 6p22 | Intergenic | Tag | Between KIAA0319 and TTRAP |
|
| |||||
| DYX1C1 | G1249T (rs57809907) | DYX1, Chr. 15q21 | Nonsense coding | RD7 | Encodes a tetratricopeptide repeat protein7. Linked to neuronal migration and morphology12. |
| DYX1C1 | -2G>A (rs142084351) | DYX1, Chr. 15q21 | Promoter | RD7,8 | |
| DYX1C1 | -3G>A (rs3743205) | DYX1, Chr. 15q21 | Promoter | RD7 | |
|
| |||||
| FOXP2 | R328X (rs121908378) | Chr. 7q31.1 | Nonsense coding | SLI9 | Associated with SLI, which involves specific impairment in receptive and expressive language. Molecular etiology may intersect with RD10. |
| FOXP2 | R553H (rs121908377) | Chr. 7q31.1 | Nonsynonymous coding | SLI9 | |
Notes: DCDC2 and KIAA0319 reside within the same locus within 200kb of each other. RD: reading disability; SLI: specific language impairment; Tag: SNP was included in the panel to tag a suspected functional region. SNPs in bold are part of a 3-SNP RD risk haplotype spanning KIAA0319 & TTRAP that has been shown to influence reading ability in the general population6.
Schumacher et al. (2006)
Scerri et al. (2011)
Harold et al. (2006)
Lai et al. (2001)
Bishop et al. (1995)
Rosen et al. (2007)
Method
Participants
We assessed 27 healthy controls of European descent (aged 22-62 years, mean 36 years, 14 female) and 28 individuals with schizophrenia of European descent (aged 22-62 years, mean 40 years, 5 female) research volunteers from the Olin Neuropsychiatry Research Center. Medication information for the schizophrenia group was as follows: atypical antipsychotics (16 individuals), typical antipsychotics (2), antidepressants (13), anticholinergics (3), benzodiazapines (2), divalproex (2), other anticonvulsants (1), lithium carbonate (1), nonbenzodiazapine hyponotic (1), GABA analogue (1) and serotonin receptor antagonist (1). No individual in the control group was taking psychotropic medication. Groups did not differ in age (t(53)=-1.06, p=.293) but did differ in gender (χ2 =7.03, p=.011). All participants were assessed for DSM-IV-TR Axis 1 disorders using the SCID-IV (First, 2002). Participants were excluded for any significant history of medical or central neurological illness, head injury leading to unconsciousness >15 min. past alcohol/substance dependence or current abuse, pregnancy in women or a positive urine toxicology screen for abused substances and control participants were excluded for any past or present Axis 1 psychiatric disorder or family history of psychotic disorder. All participants gave written informed consent using procedures approved by the Yale and Hartford Hospital institutional review boards.
DNA Samples and SNPs
DNA samples were extracted from either whole blood using the Qiagen Paxgene DNA Extraction kit, or from mouthwash samples using the Gentra Puregene Buccal Cell kit. Due to limited quantity, DNA samples were whole-genome amplified before genotyping, using the multiple-displacement amplification procedure of Hosono et al.(2003).
All SNPs (Table 1) were genotyped by pyrosequencing. SNP genotyping was performed by JS Genetics Inc. (New Haven, Connecticut). Prior to parallel-ICA, missing SNP genotypes were replaced with the major genotype; missing values accounted for 4.5% of SNP genotype values.
Linkage disequilibrium (LD) between SNPs was assessed using Haploview software, version 4.2. Genotype data for 116 unrelated individuals who self-identified as ‘White – non-Hispanic’ were used to assess LD, including the 55 subjects in the current study.
Image Acquisition and Preprocessing
Magnetic resonance images were acquired using a Siemens Allegra 3T dedicated head scanner equipped with 40 mT/m gradients and a standard quadrature head coil at the Olin Neuropsychiatry Research Centre. Functional images were acquired using a T2*-weighted gradient-echo echo-planar imaging (EPI) protocol (ascending axial acquisition, 210 volumes, TR = 1.5s, TE = 27ms, FOV = 24cm, acquisition matrix = 64×64, flip angle = 70°, voxel size = 3.75×3.75×4mm, gap = 1mm, 29 slices). The first six images were discarded to account for T1 saturation effects.
Functional images were preprocessed using SPM5 (Wellcome Department of Imaging Neuroscience, London, UK). Differences in EPI slice acquisition timing were corrected using the central slice as reference. Motion was corrected using INRI-align (Friere et al., 2002) and the images were then spatially normalized into Montreal Neurological Institute (MNI) space. Normalized EPIs were then smoothed with a 9mm FWHM Gaussian kernel.
Independent Component Analysis
Parallel-ICA (Liu et al., 2009) was used to identify independent functional networks, weighted combinations of SNP associations, and their inter-relationships. Analysis was conducted in three stages (1) an initial ICA on fMRI data to identify resting state networks, (2) identification of language-related resting state networks and (3) parallel-ICA of resting state ICs and SNP data to identify fMRI-SNP relationships.
Initial ICA
Preprocessed images were entered into a group ICA (Calhoun et al., 2001) using the GIFT toolbox (v1.3c, http://icatb.sourceforge.com). The number of ICs from the fMRI data of all subjects was estimated using minimum description length (MDL; Rissanen, 1983) criteria (23 components). Principal component analysis (PCA) was conducted at the individual subject level to reduce the data from 204 data points to 30 principal components (PCs). The PCs for each subject were then concatenated into a single group of 2250 PCs (75 subjects × 30 PCs) and then reduced to 23 ICs using the infomax approach (Bell & Sejnowski, 1995). Individual subject images and time-courses were back-reconstructed using the GICA-3 algorithm (Erhardt et al., 2010) and scaled to Z-scores. Mean components across all subjects were then displayed at |z| > 1.5.
Identification of language-related networks
To identify language-related networks, masks of bilateral Broca's and Wernicke's areas were entered into GIFT to sort ICs according to the maximum to minimum overlap with the mask. Masks were created using WFU Pickatlas (Maldjian et al., 2003) and verified by expert raters (SJ & SM). Although the common definitions of Broca's and Wernicke's areas are left lateralized, functional studies often show activity in the right homologues of each area during language and reading tasks (Hampson et al., 2002). Furthermore, the degree of lateralization of language processing tends to differ between subjects (Hampson et al., 2002), and a recent study showed that reading networks extracted from resting state data were largely bilateral (Koyama et al., 2010). Thus, as the extent of left-lateralization in reading tasks is a matter of debate, and since the lateralization of language processes in the current sample has not been established, bilateral masks of Broca's and Wernicke's areas were used in the current analysis. GIFT identified two components (using spatial correlation, r>.141) that showed significant loadings in Broca's area and two components that showed significant loadings in Wernicke's area.
Parallel ICA
The four language-related components were entered into separate parallel-ICAs to identify independent functional networks and their relationship with SNP data. Parallel-ICA (Liu et al., 2009) was applied using FIT (Fusion ICA Toolbox, http://icatb.sourceforge.net) in Matlab 7.7. The spatial component maps for each subject were entered into a matrix of subject × image, and the SNP data for all subjects were entered into a matrix of subject × SNP. For fMRI data, the initial number of independent subcomponents1 was estimated as the default number of ICs in the fusion toolbox (8 subcomponents). However preliminary analysis suggested that multiple subcomponents indexed the same functional activity (Calhoun et al., 2004), so the number of independent subcomponents was reduced to 4 subcomponents for SNP data. The number of components was estimated at 4, consistent with our previous study (Jamadar et al., 2011). Parallel-ICA identified a number of significant fMRI-SNP relationships across groups (see results). Correlation values were calculated for each group separately using the loading parameters for each subcomponent for each subject, thresholded at p<.025 corrected for multiple comparisons. Correlation coefficients between groups were statistically compared using the method of Zou (2007). All subcomponent maps were thresholded at p < .05 corrected for false detection rate (FDR). SNP components were thresholded at |z|>2.0.
Parallel-ICA – Matched-Gender Reduced Sample
As the ratio of males to females differed between groups, we conducted an additional analysis to assess the effects of gender on the fMRI-SNP subcomponent correlations. To this end we constructed a matched sample of n=13 males and n=5 females for healthy control and schizophrenia groups using the randomized case selection as implemented in SPSS v17 and examined the fMRI-SNP correlations in this reduced sample. The reduced sample (healthy controls – n=18, aged 22-62years, mean 34years; schizophrenia – n=18, 22-62 years, mean 39years) did not differ in age (t(34)=-1.07, p=.292). Correlation coefficients for each group were calculated using SPSS v17 and statistically compared using the method of Zou(2007).
Parallel-ICA – Males-Only Analysis
One possibility for the matched-gender reduced sample analysis, is that given the randomized case selection, the results obtained match those of the larger sample by chance, and that other such random subsamples may yield different results. A second possibility is that the small number of females in the reduced samples (n=5 in each group), limits the generalizability of the results to the female population. To address these issues, we ran a second reduced-sample analysis in males only. This reduced sample (healthy controls: n=13, aged 22-62years, mean 35years; schizophrenia: n=23, aged 22-62 years, mean 41years) did not differ in age (t(34)=-1.40, p=.170).
Results
Genotyping and Association Analysis
For SNP genotyping, average call rate (passing quality control) among all markers was 96%, with a range of 88.6%-100% for individual SNPs. Four uninformative SNPs (homozygous for the major allele in all samples) were excluded from further analysis. These SNPs are R328X and R553H in FOXP2, -2G>A in DYX1C1, and rs9393573 between KIAA0319 and TTRAP. All SNPs were in Hardy-Weinberg equilibrium. A linkage disequilibrium (LD) plot between all chromosome 6 (DCDC2, KIAA0319, and TTRAP) SNPs is shown in Figure 3. LD values shown are r2, the correlation coefficient between markers.
Fig 3.
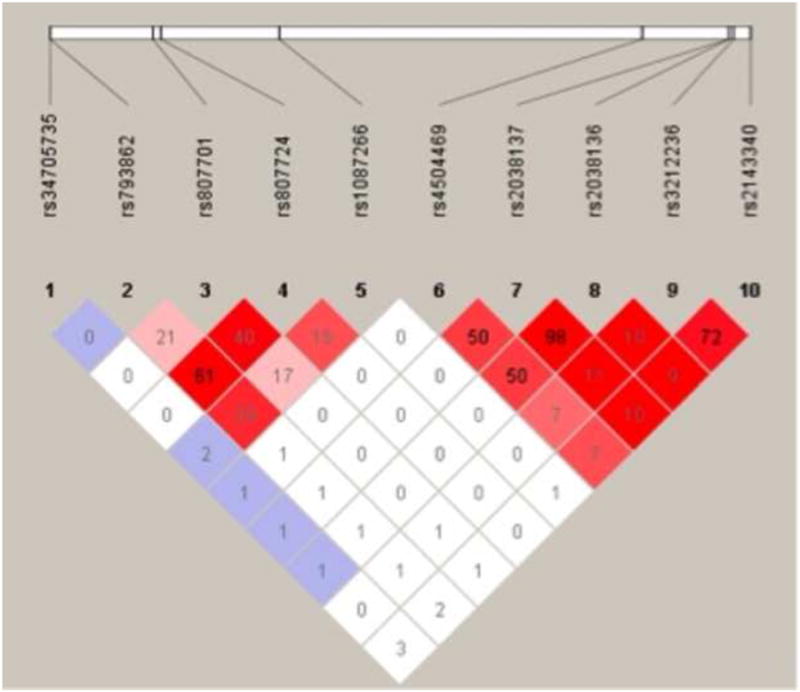
Linkage disequilibrium between chromosome 6 markers. LD values are r2, the correlation coefficient between markers.
Parallel-ICA
The initial ICA identified two networks showing activity in Broca's area and two with activity in Wernicke's area. These four networks were entered into separate parallel-ICAs with SNP data to extract fMRI-SNP relationships.
Broca's Networks
Broca Network 1
Parallel-ICA identified one significant subcomponent, Left Broca-Superior/Inferior-Parietal network (Figure 1A, Table 2) that significantly correlated (r=-.410, p=.001) with a SNP component that showed the strongest loadings for two KIAA0319 SNPs (rs2038136, rs2038137). This fMRI-SNP relationship was stronger in the healthy control (r=-.680, p<.001) than the schizophrenia (r=-.184, p=.174) groups. The strength of the correlation differed significantly between the groups (Z=6.07, p<.001).
Fig 1.
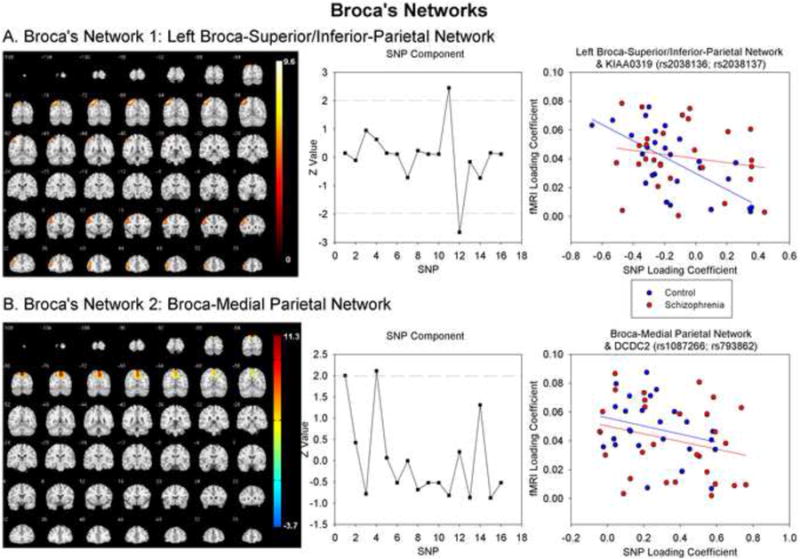
fMRI and SNP components for (A) Left Broca-Parietal and (B) Broca-Medial Parietal networks. Scatterplots show relationship between loading coefficients from fMRI and SNP components
Table 2.
MNI coordinates for regions showing loadings in the Left Broca-Superior/Inferior-Parietal Network and Broca-Medial-Parietal Network.
| Region (BA) | Left Hemisphere | Right Hemisphere |
|---|---|---|
| Left Broca-Superior/Inferior-Parietal Network | ||
| Positive Loadings | ||
| Middle Frontal Gyrus (10) | -48, 48, 9 | |
| Inferior Frontal Gyrus (46) | -51, 42, 15 | |
| Superior Parietal Lobule (7) | -30, -72, 57 | |
| Precuneus (7) | -36, -78, 39 | |
| Inferior Parietal Lobule (40) | -51, 42, 15 | |
| Inferior Temporal Gyrus (21) | -60, -57, -15 | |
|
| ||
| Broca-Medial-Parietal Network | ||
| Positive Loadings | ||
| Cingulate (23) | 0, -24, 30 | |
| Superior Parietal Lobule (7) | -10, -75, 54 | 13, -73, 56 |
| Precuneus (7) | 0, -78, 51 | |
| Cuneus (31) | -3, -75, 33 | 3, -75, 33 |
| Negative Loadings | ||
| Inferior Frontal Gyrus (46) | -48, 48, 0 | |
Broca Network 2
Parallel-ICA identified one significant subcomponent, Broca-Medial-Parietal network (Figure 1B, Table 2) that correlated significantly (r=-.292, p=.015) with a SNP component that showed the strongest loadings for two DCDC2 SNPs (rs1087266, rs793862). This relationship was of a similar magnitude in the control (r=-.284, p=.076) and schizophrenia (r=-.254, p=.096) groups. The magnitude of the correlation did not differ between groups (Z=0.37, p=.711).
Wernicke's Networks
Wernicke's Network 1: Parallel-ICA identified three significant subcomponents
The first subcomponent, Left Wernicke-Fronto-Occipital network (Figure 2A, Table 3) correlated significantly (r=.243, p=.037) with a SNP component that showed the strongest loadings for two KIAA0319 SNPs (rs2038136, rs2038137). This correlation was affected by a single outlier; when this outlier was removed the correlation became stronger (r=.352, p=.004). The magnitude of the relationship was similar in the healthy control (r=.350, p=.040) and schizophrenia (r=.376, p=.024) groups and did not significantly differ between groups (Z=0.32, p=.749).
Fig 2.
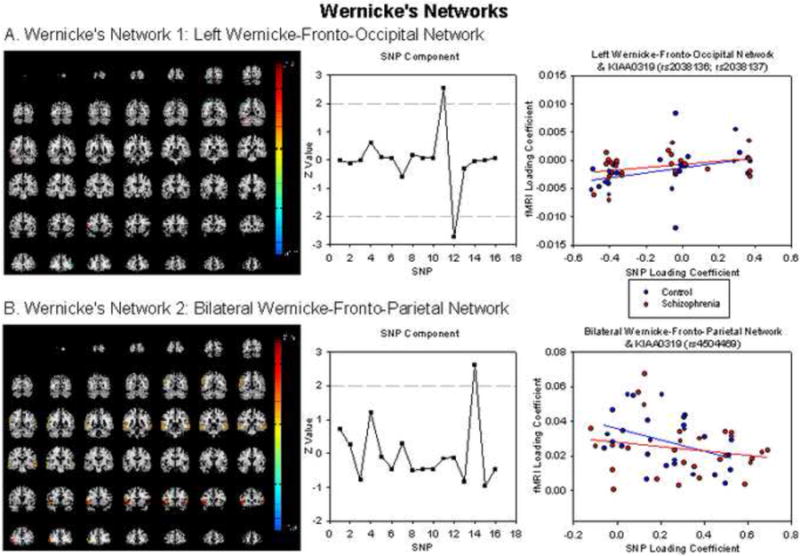
fMRI for (A) Left Wernicke-Fronto-Occipital and (B) Bilateral Wernicke-Fronto-Parietal networks. Scatterplots show relationship between loading coefficients for fMRI and SNP components. For visualization purposes, the outlier present in Left Wernicke-Fronto-Occipital network has been removed
Table 3.
MNI coordinates for regions showing loadings for Left Wernicke-Fronto-Occipital Network and Bilateral Wernicke-Fronto-Parietal Network.
| Region (BA) | Left Hemisphere | Right Hemisphere |
|---|---|---|
| Left Wernicke-Fronto-Occipital Network | ||
| Positive Loadings | ||
| Superior Frontal Gyrus (8/9) | -39, 18, 57 | 27, 45, 48 |
| Inferior Frontal Gyrus (9/44) | -60, 15, 27 | |
| Precentral Gyrus (6) | -60, -3, 39 | |
| Superior Temporal Gyrus (42) | -33, 48, 36 | |
| Fusiform Gyrus (18) | -45, -75, -18 | |
| Lingual Gyrus (18) | -3, -84, -6 | |
| Cerebellar Declive | -48, -54, -27 | |
| Negative Loadings | ||
| Inferior Frontal Gyrus (45/46) | 57, 30, 3 | |
| Inferior Parietal Lobule (40) | -48, -63, 51 | |
| Superior Temporal Gyrus (38) | -30, 12, -30 | |
| Middle Temporal Gyrus (21) | -66, -33, -9 | |
| Inferior Occipital Gyrus (18) | -30, -90, -21 | |
|
| ||
| Bilateral Wernicke-Fronto-Parietal Network | ||
| Positive Loadings | ||
| Inferior Frontal Gyrus (45/47) | -60, 21, 6 | 51, 24, -12 |
| Inferior Parietal Lobule (40) | -60, -57, 36 | |
| Superior Temporal Gyrus (22/38/39) | -54, 18, -9 | 66, -51, 12 |
| Middle Temporal Gyrus (21) | -66, -42, -3 | 69, -36, -6 |
| Negative Loadings | ||
| Pons | -9, -9, -24 | |
The second subcomponent, Bilateral Wernicke-Fronto-Parietal network (Figure 2B, Table 3) significantly correlated (r=-.301, p=.013) with a SNP component that loaded most heavily on KIAA0319 (rs4504469). The magnitude of the relationship was stronger in the healthy control (r=-.407, p=.018) than schizophrenia (r=-.198, p=.156) groups; this difference was significant (Z=2.56, p=.010).
The third fMRI-SNP relationship was not significant after removing outliers (outliers defined as loading coefficient greater than or less than 3SD from mean; p=.070) and within-group correlations were also not significant after outlier removal (both p >.117). This network therefore will not be discussed further.
Wernicke's Network 2
The initial ICA identified a second network that showed activity in Wernicke's area, however once outliers were removed, no sMRI-SNP relationship remained significant in parallel-ICA (all p>.101). This network will not be discussed further.
Parallel-ICA – Reduced Sample
The results in the reduced sample were compatible with those obtained in the larger sample.
The Left Broca-Superior/Inferior-Parietal network was significantly correlated (r=-.401, p=.008) with the SNP component that showed the strongest loadings for two KIAA0319 SNPs (rs2038136, rs2038137). As in the larger sample, this correlation was strongest in the healthy control (r=-.727, p=.000) as compared to schizophrenia (r=-.045, p=.429) groups. The difference in the strength of the correlations was significant (Z=5.12, p<.001).
The Broca-Medial Parietal network was marginally significantly correlated (r=-.258, p=.064) with the SNP component that showed the strongest loadings for two DCDC2 SNPS (rs1087266, rs793862). As in the larger sample, the magnitude of the correlation was similar between the healthy control (r=-.209, p=.202) and schizophrenia groups (r=-.238, p=.171) groups; this difference was not significant (Z=-0.22, p=.826).
The correlation between Left Wernicke-Fronto-Occipital network and the SNP component that showed the strongest loadings for two KIAA0319 SNPs (rs2038136, rs2038137) was not significant in the reduced sample (r=.199, p=.125) however it was in the same direction as obtained in the larger sample. The magnitude of the relationship was stronger in the healthy controls (r=.266, p=.143) than in schizophrenia (r=.083, p=.376). This difference was not significant (Z=-1.37, p=.170).
The Bilateral Wernicke-Fronto-Parietal network was significantly correlated (r=-.310, p=.033) with a SNP component that loaded most heavily on KIAA0319 (rs4504469). As in the larger sample, this relationship was stronger in the healthy control (r=-.580, p=.006) than schizophrenia (r=-.108, p=.335) groups. This difference was significant (Z=3.54, p<.001).
Note that the fMRI-SNP relationship for Wernicke's Network 2 that was not significant after outlier removal, remained non-significant (p=.433).
Parallel-ICA: Males Only
The results in the males-only analyses were compatible with those obtained in the larger sample and in the matched-gender reduced sample analysis.
The left Broca-Superior/Inferior-Parietal network was significantly correlated (r=-.393, p=.009) with the SNP component that showed the strongest loadings for KIAA0319 (rs2038136, rs2038137). This correlation was strongest in the healthy control (r=-.813, p<.001) as compared to schizophrenia (r=-.190, p=.193) groups. The difference in the strength of the correlations was significant (Z=4.15, p<.001).
The relationship between the Broca-Medial Parietal network and the DCDC2 SNP component (rs1087266, rs793862) failed to reach significance in the males-only sample. However, the obtained effects were in the same direction as that obtained in the larger and reduced matched-gender sample: the relationship between the fMRI and SNP components was of similar magnitude in healthy controls (r=-.168, p=.291) and schizophrenia (r=-.203, p=.177) groups. The magnitude of the correlation did not differ between groups (Z=-.233, p=.410).
The Left-Wernicke-Fronto-Occipital network was marginally correlated (r=.242, p=.078) with the KIAA0319 SNP component (rs2038136, rs2038137). As in the larger sample, the magnitude of this correlation was similar in the healthy control (r=.338, p=.130) and schizophrenia (r=.413, p=.025) groups (Z=.500, p=.310).
The Bilateral Wernicke-Fronto-Parietal network was marginally correlated (r=-.242, p=.077) with the SNP component that showed strongest loadings on KIAA0319 (rs4504469). Consistent with the results obtained in the larger and matched-gender samples, this correlation was larger in the healthy control (r=-.509, p=.038) than schizophrenia (r=-.137, p=.266) groups (Z=2.48, p=.006).
As in the larger and matched-gender samples, the fMRI-SNP relationship for Wernicke's Network 2 that was not significant after outlier removal remained non-significant (p=.200).
Discussion
Reading abnormalities are increasingly recognized as an important schizophrenia symptom. These language differences likely exist in the prodromal phase and can predict subsequent illness onset (Done et al., 1998; Fuller et al., 2002). Language impairments are associated with abnormalities of structural and functional connectivity in the distributed network that underlies language (Allen et al., 2008; Glahn et al., 2008; Jamadar et al., 2011; Li et al., 2009). As schizophrenia is heritable, and genes related to reading and language deficits are being identified, we examined the relationship between resting-state activity in language-related regions and multiple RD-related genes in both healthy controls and individuals with schizophrenia. We have previously demonstrated links between the 16 SNPs examined in this study and gray matter integrity in language-related cortical networks (Jamadar et al., 2011; Meda et al., 2007). The aim of the current study was to extend these structural findings and examine the relationship of these genes to functional connectivity of language-related neural regions, albeit during resting state rather than a language-based task, which latter might introduce performance-related confounds.
We identified four significant correlations between functional and genetic networks. These networks correspond to networks known to be involved in reading and are consistent with previous studies examining reading-related functional connectivity in resting-state fMRI (Hampson et al., 2002; Koyama et al., 2002). The two Broca's related networks showed functional connectivity between Broca's area and superior and inferior parietal cortex. Parietal cortex, especially inferior regions (angular and supramarginal gyri) and regions around the temporoparietal junction, are intimately involved in reading, particularly in the integration of information from auditory, motor and memory systems (Li et al., 2009). The Left Broca-Superior/Inferior-Parietal network was significantly correlated with two KIAA0319 SNPs (rs2038136, rs2038137). Meng et al. (2005) showed that KIAA0319 is highly expressed in the parietal and occipital cortices. Importantly, this network was negatively associated with these SNPs, suggesting that individuals that load more heavily on this SNP component show reduced functional connectivity in this network. This is consistent with studies showing that individuals with dyslexia and poor readers from normative samples show reduced functional connectivity in reading networks extracted from resting state fMRI data relative to good readers (Koyama et al., 2010).The relationship between Left Broca-Superior/Inferior-Parietal network and KIAA0319 was obtained in the healthy control group but not the schizophrenia group, suggesting that these SNPs modulate this network in healthy individuals, not in individuals with schizophrenia.
The Broca-Medial-Parietal network was significantly correlated with two DCDC2 SNPs (rs1087266, rs793862), consistent with our previous studies that linked DCDC2 to gray matter volumes in the superior parietal cortex (Jamadar et al., 2011; Meda et al., 2007). Meng et al. (2005) showed that DCDC2 is moderately expressed in the adult parietal cortex. As in the other Broca's-related network, the negative relationship between these components suggests that higher loadings on this SNP component is associated with reduced functional connectivity in this network. The relationship between Broca-Medial-Parietal network and DCDC2 was obtained in both the schizophrenia and healthy control groups, suggesting that these SNPs modulate functional connectivity in this reading-related network in both populations.
The Left Wernicke-Fronto-Occipital network showed functional connectivity between Wernicke's area and bilateral dorsolateral prefrontal cortex (DLPFC, BA 8/9), left IFG (within Broca's area), premotor cortex, fusiform gyrus and lingual gyrus. The fusiform and lingual gyri are known to be important for visual processing during reading (Demonent et al., 2010; Koyama et al., 2010), and the premotor cortex has been shown to be functionally connected to both frontal and temporal reading networks in resting state fMRI (Koyama et al., 2010). This network showed a positive relationship with two KIAA0319 SNPs (rs2038136, rs2038137), suggesting that higher loadings on this SNP component were associated with increased functional connectivity between these regions. This is consistent with results showing that KIAA0319 is highly expressed in the temporal cortex (Meng et al., 2005). This relationship was obtained in both healthy control and schizophrenia groups suggesting that functional connectivity within this reading-related network may be attributable to a common genetic factor in both groups.
The Bilateral Wernicke-Fronto-Parietal network showed functional connectivity between Wernicke's area, inferior parietal cortex and bilateral IFG. Activity in the IFG was slightly inferior and anterior to Broca's area, largely in the pars triangularis and extending into the pars orbitalis. This network is known to be important for the semantic component of reading, and has been labeled the ‘core’ semantic system in the brain (Demonent et al., 2010). This network was negatively correlated with KIAA0319 (rs4504469), suggesting that increased loading on this SNP component is associated with reduced functional connectivity in this network. As with the previously discussed networks, this is consistent with results showing that functional connectivity in reading networks is decreased in dyslexia and poor readers in resting state fMRI (Koyama et al., 2010), and with results showing that KIAA0319 is moderately expressed in the frontal cortex (Meng et al., 2005). This relationship was obtained in the healthy control group only, suggesting that impaired reading and functional connectivity in reading networks in schizophrenia (Lynall et al., 2010; Pearlson & Calhoun, 2009) cannot be attributed to this genetic variant.
Ten of the SNPs examined in this study, including all SNPs that showed loadings on any fMRI subcomponent, reside within the same locus on chromosome 6. This raises the possibility of non-independence due to linkage disequilibrium, so we used the genotypes from all individuals in the study who self-identified as ‘White – non-Hispanic’ (n=116) to assess LD. The results are shown in Figure 3 as r2 values between SNPs. First, rs2038136 and rs2038137 show very strong LD, suggesting that their repeated association with each other as a SNP component is caused by genetic linkage rather than a shared influence on their respective fMRI subcomponents. By contrast, rs1087266 and rs793862, which also formed a SNP component, show weak LD (r2=0.29), indicating that their association with each other may involve a common influence on their corresponding functional network. This possibility is supported by the fact that rs4504469 shows higher LD with both rs2038136 and rs2038137 (r2=0.50) than that between rs1087266 and rs793862 (r2=0.29), yet rs4504469 formed a SNP component that included only itself. The fact that two SNPs in very strong LD (rs2038136 and rs2038137) consistently formed a single SNP component serves as additional validation for use of parallel-ICA with SNP data, as this method would be expected to identify strongly non-independent SNPs regardless of the reason for non-independence.
In this study we showed links between KIAA0319 and DCDC2 and reading-related networks. In our previous studies, we demonstrated links between gray matter volumes in cortical language networks and DCDC2, in both healthy controls (Meda et al., 2007) and schizophrenia (Jamadar et al., 2011). In the current study, two of the fMRI-SNP relationships were obtained in both groups, and two of the relationships were obtained in the healthy control group only. Thus no SNP was uniquely related to an fMRI network in the schizophrenia group only. This is in contrast to our previous study (Jamadar et al., 2011) where the sMRI-SNP relationships were obtained in the schizophrenia group only. We thus demonstrate a dissociation where RD-related genes differentially affect structural, but not functional, reading-related networks in schizophrenia as compared to healthy controls. Our results are consistent with Scerri et al.'s (2011) findings that RD-related genes may contribute to RD-like changes even in the absence of RD. It remains possible that impaired functional connectivity in schizophrenia related to language disorder is attributable to other RD-related genes that we did not include in the analysis, or to non-RD-related genes.
Strengths of Parallel-ICA and Comparison to Other Methods
In this study, we adopted a multivariate approach to examine the relationships between RD-related genes and resting state functional connectivity. The alternative to such a multivariate approach is to use what has been labeled a ‘massively univariate linear modeling’ approach (e.g. Stein et al., 2010), where each genetic marker is independently tested for association with one phenotype (i.e. voxel) at a time, and each phenotype is tested for association with one genetic marker at a time. The strength of the multivariate approach is that it can capture the joint effects of multiple markers that interact to contribute to phenotypic variability (Vounou et al., 2012). This contrasts with mass-univariate approaches that independently tests each genetic marker for a relationship with the imaging phenotype, and thus cannot capture gene-gene interactions and their impact on the phenotype (Stein et al., 2010). A second strength of our approach is that it more closely matches the multivariate nature of the imaging phenotype than the mass-univariate approach, potentially leading to higher statistical efficiency, and hence ability to detect small effects that might otherwise not survive the stringent correction for multiple comparisons required in mass-univariate approaches. A final advantage of a multivariate analysis over mass univariate analysis is its ability to detect multiple genetic factors that may contribute individually a small amount to phenotypic variability, but interact to result in a complex illness outcome; this matches currently accepted models of the genetic underpinnings of complex diseases (e.g. Stranger et al., 2011; for a full comparison and contrast of multivariate and mass-univariate approaches in imaging genetics, the reader is referred to Vounou et al., 2012).
A number of alternative multivariate imaging genetic approaches have been developed, including sparse reduced-rank regression (Vounou et al., 2010) and group-sparse multi-task regression and feature selection (Wang et al., 2011). We chose parallel ICA since (a) it has been used and validated in a number of studies to date, some of which use sample sizes of a similar magnitude to that used here (e.g. Liu et al., 2009), others that have used large sample sizes encompassing hundreds of individuals (e.g. Meda et al., 2012); (b) it has been used in both candidate gene approaches with modest numbers of SNPs (e.g. Jamadar et al., 2011), and in studies with genome-wide SNP arrays (e.g. Meda et al., 2012); and (c) it has been used and validated in studies of both structural and functional MRI, allowing us to examine relationships between RD-related genes and both the structure and function of the brain within the same cohort (Jamadar et al., 2011; current study). While it is true that the shortcomings of the mass-univariate approach are possibly reduced in this study as we have focused on a relatively small number of SNPs and ICs, such an analysis would still require heavy correction for the number of voxels and correlations, and also would not have the benefits of ICA in separating variance or artifact that is unrelated to the question of interest into separate components.
Strengths, Limitations, and Directions for Future Research
This is the first study to examine the link between genetic data and resting-state functional connectivity in schizophrenia and healthy controls using a simultaneous ICA approach. The samples in this study, albeit small, were well-characterized, and the parallel-ICA approach is a novel but powerful method to examine fMRI-SNP relationships. Despite these strengths, there were some limitations: firstly, sample sizes were small, so future studies should endeavor to replicate these findings in larger samples. Secondly, there was a gender imbalance between the groups. Although we replicated fMRI-SNP relationships within two reduced sample analyses, one matched for gender and another in male participants only. However, these reduced samples were very small, and underline the difficulty in generalizing the results to females, so results should be replicated in larger gender- and age-matched samples. Thirdly, we did not have reading measures in these individuals. Fourth, our participants were chronic patients who were undertaking pharmacological treatment; future studies should examine the impact of medication on these relationships. Thus, based on this preliminary sample, these genes cannot be considered as candidate schizophrenia risk genes for schizophrenia;, though it remains possible that the limited sample size of this study restricted power to detect associations that may nonetheless be present.
Of the five RD genes studied in this and the previous study (Jamadar et al., 2011), DCDC2 and KIAA0319 appear to be the most important determinants of cortical connectivity in reading and language networks. In both studies, fMRI and sMRI components have been significantly related to polymorphisms in only these genes; no other genes have shown significant relationships with structural or functional networks. DCDC2 and KIAA0319 are localized to DYX2 on chromosome 6p21.3 (Francks et al., 2004; Meng et al., 2005) and are thought to be important for embryonic neuronal migration in humans. DCDC2 is one of several genes in the doublecortin family. Mutations in doublecortin (aka DCX) cause disorders of neuronal migration in humans, including subcortical laminar heterotopia (‘double cortex syndrome’) and X-linked lissencephaly (‘smooth brain syndrome’). RNAi knockdown of DCDC2 has been shown to impair neuronal migration in embryonic rats (Meng et al., 2005). KIAA0319 encodes a transmembrane protein of unknown function; its structure suggests a role in cell adhesion or signaling. Knockdown of KIAA0319 in embryonic rats impairs dendrite development and morphology and neuronal migration (Peschansky et al., 2010). A three-SNP risk haplotype, spanning about half of KIAA0319 and about half of its neighboring gene TTRAP, has been quantitatively associated with lower reading skills in the general population (Paracchini et al., 2007). Given that in the previous study cortical structural connectivity was related to DCDC2 and in this study 3 out of 4 functional networks were related to KIAA0319, DCDC2 may be a more important determinant of structural connectivity and KIAA0319 may be a more important determinant of functional connectivity in reading networks.
Acknowledgments
None
Funding for this study was provided by NIMH Grants R37 MH43775, R01 MH074797, R01 MH077945, to G. Pearlson; funding for J.R. Gruen was provided by NINDS Grant R01 NS 43530.
Yale University has applied for a patent covering markers from and their application to reading disability, which has been licensed to a start-up company founded by J.R. Gruen.
Footnotes
To avoid confusion, the independent components extracted from the initial ICA using GIFT will be referred to as ‘components’ and the independent components extracted from the parallel-ICA will be referred to as ‘subcomponents’.
All other authors declare that they have no conflicts of interest.
References
- Akbarian S, Kim JJ, Potkin SG, Hetrick WP, Bunney WE, Jr, Jone EG. Maldistribution of interstitial neurons in prefrontal white matter of the brains of schizophrenia patients. Archives of General Psychiatry. 1996;53:425–436. doi: 10.1001/archpsyc.1996.01830050061010. [DOI] [PubMed] [Google Scholar]
- Allen P, Laroi F, McGuire PK, Aleman A. The hallucinating brain: a review of structural and functional neuroimaging studies of hallucinations. Neuroscience & Biobehavioral Reviews. 2008;32:175–191. doi: 10.1016/j.neubiorev.2007.07.012. [DOI] [PubMed] [Google Scholar]
- Bell AJ, Sejnowski TJ. An information maximisation approach to blind separation and blind deconvolution. Neural Computation. 1995;7:1004–1034. doi: 10.1162/neco.1995.7.6.1129. [DOI] [PubMed] [Google Scholar]
- Calhoun VD, Adali T, Pearlson GD, Pekar JJ. A method for making group inferences from functional MRI data using independent component analysis. Human Brain Mapping. 2001;14:140–151. doi: 10.1002/hbm.1048. [DOI] [PMC free article] [PubMed] [Google Scholar]
- Calhoun VD, Adali T, Pekar JJ. A method for comparing group fMRI data using independent component analysis: application to visual, motor and visuomotor tasks. Magnetic Resonance Imaging. 2004;22:1181–1191. doi: 10.1016/j.mri.2004.09.004. [DOI] [PubMed] [Google Scholar]
- Calhoun VC, Pearlson GD, Macieweski P, Kiehl K. Temporal lobe and ‘default’ hemodynamic brain modes discriminate between schizophrenia and bipolar disorder. Human Brain Mapping. 2008;29:1265–1275. doi: 10.1002/hbm.20463. [DOI] [PMC free article] [PubMed] [Google Scholar]
- Demonet JF, Thierry G, Cardebat D. Renewal of the neurophysiology of language: Functional neuroimaging. Physiology Review. 2005;85:49–95. doi: 10.1152/physrev.00049.2003. [DOI] [PubMed] [Google Scholar]
- Deutsch SI, Burket JA, Katz E. Does subtle disturbance of neuronal migration contribute to schizophrenia and other neurodevelopmental disorders? Potential genetic mechanisms with possible treatment implications. European Journal of Neuropsychopharmacoogy. 2010;20:281–287. doi: 10.1016/j.euroneuro.2010.02.005. [DOI] [PubMed] [Google Scholar]
- Done DJ, Leinoneen E, Crow TJ, Sacker A. Linguistic performance in children who develop schizophrenia in adult life. Evidence for normal syntactic ability. British Journal of Psychiatry. 1998;172:130–135. doi: 10.1192/bjp.172.2.130. [DOI] [PubMed] [Google Scholar]
- Erhardt E, Rachakonda S, Bedrick E, Adali T, Calhoun V. Comparison of multi-subject ICA methods for analysis of fMRI data. Human Brain Mapping. 2010 doi: 10.1002/hbm.21170. E Pub Ahead of Print. [DOI] [PMC free article] [PubMed] [Google Scholar]
- First MB. The DSM series and experience with DSM-IV. Psychopathology. 2002;35:67–71. doi: 10.1159/000065121. [DOI] [PubMed] [Google Scholar]
- Fox MD, Raichle ME. Spontaneous fluctuations in brain activity observed with functional magnetic resonance imaging. Nature Reviews Neuroscience. 2007;8:700–711. doi: 10.1038/nrn2201. [DOI] [PubMed] [Google Scholar]
- Francks C, Paracchini S, Smith SD, Richardson AJ, Scerri TS, et al. A 77-kb region of chromosome 6p22.2 is associated with dyslexia in families from the United Kingdom and from the United States. American Journal of Human Genetics. 2004;75:1046–1058. doi: 10.1086/426404. [DOI] [PMC free article] [PubMed] [Google Scholar]
- Freier L, Roche A, Magin JF. What is the best similarity measure for motion correction in fMRI time series? IEEE Transactions in Medical Imaging. 2002;21:470–484. doi: 10.1109/TMI.2002.1009383. [DOI] [PubMed] [Google Scholar]
- Fuller R, Nopoulos P, Arndt S, O'Leary D, Ho BC, Andreasen NC. Longitudinal assessment of premorbid cognitive functioning in patients with schizophrenia through examination of standardized scholastic test performance. American Journal of Psychiatry. 2002;159:1183–1189. doi: 10.1176/appi.ajp.159.7.1183. [DOI] [PubMed] [Google Scholar]
- Gabel LA, Gibson CJ, Gruen JR, LoTurco JJ. Progress towards a cellular neurobiology of reading disability. Neurobiology of Disease. 2010;38:173–180. doi: 10.1016/j.nbd.2009.06.019. [DOI] [PMC free article] [PubMed] [Google Scholar]
- Glahn DC, Laird AR, Ellison-Wright I, Thelen S, Robinson JL, Lancaster JL, Bullmore E, Fox PT. Meta-analysis of gray matter anomalies in schizophrenia: application of anatomic likelihood estimation and network analysis. Biological Psychiatry. 2008;64:774–781. doi: 10.1016/j.biopsych.2008.03.031. [DOI] [PMC free article] [PubMed] [Google Scholar]
- Hampson M, Peterson BS, Skudlarski P, Gatenby JC, Gore JC. Detection of functional connectivity using temporal correlations in MR images. Human Brain Mapping. 2002;15:247–262. doi: 10.1002/hbm.10022. [DOI] [PMC free article] [PubMed] [Google Scholar]
- Hannula-Jouppi K, Kaminen-Ahola N, Taipale M, Eklund R, Nopola-Hemmi J, et al. The axon guidance receptor gene ROBO1 is a candidate gene for developmental dyslexia. PLOS Genetics. 2005;1:e50. doi: 10.1371/journal.pgen.0010050. [DOI] [PMC free article] [PubMed] [Google Scholar]
- Hayes RL, O'Grady BM. Do people with schizophrenia comprehend what they read? Schizophrenia Bulletin. 2003;29:499–507. doi: 10.1093/oxfordjournals.schbul.a007022. [DOI] [PubMed] [Google Scholar]
- Hosono S, Faruqi AF, Dean FB, Du Y, Sun Z, Wu X, Du J, Kingsmore SF, Egholm M, Lasken RS. Unbiased whole-genome amplification directly from clinical samples. Genome Research. 2003;13:954–964. doi: 10.1101/gr.816903. [DOI] [PMC free article] [PubMed] [Google Scholar]
- Jafri MJ, Pearlson GD, Stevens M, Calhoun VD. A method of functional network connectivity among spatially independent resting state components in schizophrenia. Neuroimage. 2008;39:1666–1681. doi: 10.1016/j.neuroimage.2007.11.001. [DOI] [PMC free article] [PubMed] [Google Scholar]
- Jagannathan K, Calhoun VD, Gelernter J, Stevens MC, Liu J, Bolognani F, Windemuth A, Ruano G, Assaf M, Pearlson GD. Genetic associations of brain structural networks in schizophrenia: a preliminary study. Biological Psychiatry. 2010;68:657–666. doi: 10.1016/j.biopsych.2010.06.002. [DOI] [PMC free article] [PubMed] [Google Scholar]
- Jamadar S, Powers N, Meda S, Gelernter J, Gruen J, Pearlson G. Genetic influence of cortical gray matter in language-related regions in healthy controls and schizophrenia. Schizophrenia Research. 2011;129:141–148. doi: 10.1016/j.schres.2011.03.027. [DOI] [PMC free article] [PubMed] [Google Scholar]
- Koyama MS, Kelly C, Shehzad Z, Penesetti D, Castellanos FX, Milham MP. Reading networks at rest. Cerebral Cortex. 2010;20:2549–2559. doi: 10.1093/cercor/bhq005. [DOI] [PMC free article] [PubMed] [Google Scholar]
- Lai CS, Gerrelli D, Monaco AP, Fisher SE, Copp AJ. FOXP2 expression during brain development coincides with adult sites of pathology in a severe speech and language disorder. Brain. 2003;126:2455–2462. doi: 10.1093/brain/awg247. [DOI] [PubMed] [Google Scholar]
- Leonard CM, Eckert MA, Lombardino LJ, Oakland T, Kranzler J, Mohr CM, et al. Anatomical risk factors for phonological dyslexia. Cerebral Cortex. 2002;11:148–157. doi: 10.1093/cercor/11.2.148. [DOI] [PubMed] [Google Scholar]
- Li X, Branch CA, DeLisi LE. Language pathway abnormalities in schizophrenia: a review of fMRI and other imaging studies. Current Opinion Psychiatry. 2009;22:131–139. doi: 10.1097/YCO.0b013e328324bc43. [DOI] [PubMed] [Google Scholar]
- Liu J, Pearlson G, Windemuth A, Ruano G, Perrone-Bizzero NI, Calhoun V. Combining fMRI and SNP data to investigate connections between brain function and genetics using parallel ICA. Human Brain Mapping. 2009;30:241–255. doi: 10.1002/hbm.20508. [DOI] [PMC free article] [PubMed] [Google Scholar]
- Lynall ME, Bassett DS, Kerwin R, McKenna PJ, Kitzbichler M, Muller U, Bullmore E. Functional connectivity and brain networks in schizophrenia. Journal of Neuroscience. 2010;30:9477–9487. doi: 10.1523/JNEUROSCI.0333-10.2010. [DOI] [PMC free article] [PubMed] [Google Scholar]
- Maldjian JA, Laurienti PJ, Burdette JB, Kraft RA. An automated method for neuroanatomic and cytoarchitectonic atlas-based interrogation of fMRI data sets. Neuroimage. 2003;19:1233–1239. doi: 10.1016/s1053-8119(03)00169-1. [DOI] [PubMed] [Google Scholar]
- Meda SA, Gelernter J, Gruen JR, Calhoun VD, Meng H, Cope NA, Pearlson GD. Polymorphism of DCDC2 reveals differences in cortical morphology of healthy individuals – a preliminary voxel based morphometry study. Brain Imaging Behav. 2007;2:21–26. doi: 10.1007/s11682-007-9012-1. [DOI] [PMC free article] [PubMed] [Google Scholar]
- Meda SM, Gill A, Stevens MC, Lorenzoni RP, Glahn DC, Calhoun VD, et al. Differences in resting-state functional magnetic resonance imaging functional network connectivity between schizophrenia and psychotic bipolar probands and their unaffected first-degree relatives. Biological Psychiatry. 2012;71:881–889. doi: 10.1016/j.biopsych.2012.01.025. [DOI] [PMC free article] [PubMed] [Google Scholar]
- Meng H, Smith SD, Hager K, Held M, Liu J, et al. DCDC2 is associated with reading disability and modulates neuronal development in the brain. Proceedings of the National Acadency of Science USA. 2005;102:17053–17058. doi: 10.1073/pnas.0508591102. [DOI] [PMC free article] [PubMed] [Google Scholar]
- Paracchini S, Scerri T, Monaco AP. The genetic lexicon of dyslexia. Annual Review Genomics Human Genetics. 2007;8:57–79. doi: 10.1146/annurev.genom.8.080706.092312. [DOI] [PubMed] [Google Scholar]
- Pearlson GD, Calhoun VD. Convergent approaches for defining functional imaging endophenotypes in schizophrenia. Frontiers in Human Neuroscience. 2009;3:1–11. doi: 10.3389/neuro.09.037.2009. [DOI] [PMC free article] [PubMed] [Google Scholar]
- Peschansky VJ, Burbridge TJ, Volz AJ, Fiondella C, Wissner-Gross Z, Galaburda AM, LoTurco JJ, Rosen GD. The effect of variation in expression of the candidate dyslexia susceptibility gene homolog Kiaa0319 on neuronal migration and dendritic morphology in the rat. Cerebral Cortex. 2010;20(4):994–897. doi: 10.1093/cercor/bhp154. [DOI] [PMC free article] [PubMed] [Google Scholar]
- Petrella JR, Sheldon FC, Prince SE, Calhoun VD, Doraiswamy PM. Default mode connectivity in stable versus progressive mild cognitive impairment. Neurology. 2011;76:511–517. doi: 10.1212/WNL.0b013e31820af94e. [DOI] [PMC free article] [PubMed] [Google Scholar]
- Revheim N, Butler PD, Schechter I, Jalbrzikowski M, Silipo G, Javitt DC. Reading impairment and visual processing deficits in schizophrenia. Schizophrenia Research. 2006;87:238–245. doi: 10.1016/j.schres.2006.06.022. [DOI] [PMC free article] [PubMed] [Google Scholar]
- Rissanen J. A universal prior for integers and estimation by minimum description length. Annals of Statistics. 1983;11:416–431. [Google Scholar]
- Stein JL, Hua X, Lee S, Ho AJ, Leow AD, Toga AW, et al. Voxelwise genome-wide association study (vGWAS) Neuroimage. 2010;53:1160–1174. doi: 10.1016/j.neuroimage.2010.02.032. [DOI] [PMC free article] [PubMed] [Google Scholar]
- Strik W, Dierks T, Hubl D, Horn H. Hallucinations, thought disorders, and the language domain in schizophrenia. Clinical EEG & Neuroscience. 2008;39:91–94. doi: 10.1177/155005940803900214. [DOI] [PubMed] [Google Scholar]
- Taipale M, Kaminen N, Nopola-Hemmi J, Haltia T, Myllyluoma B, et al. A candidate gene for developmental dyslexia encodes a nuclear tetratricopeptide repeat domain protein dynamically regulated in brain. Proceedings of the National Academy Science USA. 2003;100:11553–11558. doi: 10.1073/pnas.1833911100. [DOI] [PMC free article] [PubMed] [Google Scholar]
- Uddin LQ, Menon V. Resting state brain activity: Implications for systems neuroscience. Frontiers in Systems Neuroscience. 2010;4:1–2. doi: 10.3389/fnsys.2010.00037. [DOI] [PMC free article] [PubMed] [Google Scholar]
- Van den Heuvel MP, Hulshoff Pol HE. Exploring the brain network: a review on resting state fMRI functional connectivity. European Journal of Neuropsychopharmacology. 2010;20:519–534. doi: 10.1016/j.euroneuro.2010.03.008. [DOI] [PubMed] [Google Scholar]
- Vounou M, Janousova E, Wolz R, Stein JL, Thompon PM, Rueckert D, et al. Sparse reduced-rank regression detects genetic associations with voxel-wise longitudinal phenotypes in Alzheimer's disease. Neuroimage. 2012;60:700–716. doi: 10.1016/j.neuroimage.2011.12.029. [DOI] [PMC free article] [PubMed] [Google Scholar]
- Wang H, Nie F, Huang H, Kim S, Nho K, Risacher SL, et al. Identifying quantitative trait loci via group-sparse multi-task regression and feature selection: an imaging genetics study of the ADNI cohort. Bioinformatics. 2011:1–8. doi: 10.1093/bioinformatics/btr649. [DOI] [PMC free article] [PubMed] [Google Scholar]
- Zou GY. Towards using confidence intervals to compare correlations. Psychology Methods. 2007;12:399–413. doi: 10.1037/1082-989X.12.4.399. [DOI] [PubMed] [Google Scholar]