Abstract
This study was designed to test the feasibility of en face mapping of the transient intrinsic optical signal (IOS) response at photoreceptor outer segments and to assess the effect of spatial resolution on functional IOS imaging of retinal photoreceptors. A line-scan optical coherence tomography (LS-OCT) was constructed to achieve depth-resolved functional IOS imaging of living frog eyecups. Rapid en face OCT revealed transient IOS almost immediately (<3 ms) after the onset of visible light flashes at photoreceptor outer segments. Quantitative analysis indicated that the IOS kinetics may reflect dynamics of G-protein binding and releasing in early phases of visual transduction, and high resolution is essential to differentiate positive and negative IOS changes in adjacent locations.
It is well known that eye diseases, such as age-related macular degeneration (AMD) [1] and retinitis pigmentosa (RP) [2] can cause pathological changes in retinal photo-receptors. Without prompt and effective intervention, they can ultimately lead to severe vision losses and even legal blindness. High-resolution examination of retinal photoreceptors is essential for disease detection and treatment evaluation. Advanced fundus examinations, including optical coherence tomography (OCT) and adaptive optics (AO) measurements, have provided valuable information for AMD assessment. However, the morphological only fundus examination is not enough [3]. Electroretinogram (ERG) [4], focal ERG, multifocal ERG [5], perimetry [6], etc. have been established for objective evaluation of retinal function. However, spatial resolution and sensitivity of the ERG and perimetry may not be high enough to identify localized retinal dysfunctions precisely. At early stages, AMD associated cellular damages are in the form of degenerative or apoptotic changes of small groups of retinal cells. Although it is possible to combine morphological (such as OCT) and functional (such as ERG) evaluation [7] to improve retinal disease study and diagnosis, conducting these separate measurements is time-consuming and cost-inefficient. Moreover, the loci of functional ERG losses may not correlate with those of the discernible morphological features, such as drusen, hemorrhages, etc. [8,9]. It is therefore desirable to be able to simultaneously evaluate structure and function of individual retinal layers at high spatial and temporal resolution over an extended retinal region.
Intrinsic optical signal (IOS) imaging promises a new method for concurrent morphological and functional evaluation of the retina. Stimulus-evoked IOSs have been detected in the retina, neural tissues [10–13] and other excitable cells [14, 15]. Several imaging techniques, including fundus cameras [16, 17], AO ophthalmoscopes [18–20], OCT imagers [21–23] have been explored for functional IOS imaging of the retina. While all these studies have revealed robust IOSs associated with retinal stimulation, rapid en face mapping of fast IOS selectively from retinal photoreceptors over an extended area, which is essential for easy photoreceptor assessment, is still challenging due to crosstalk noises among multiple retinal layers. Recently, we developed a line-scan confocal imager to detect fast IOS tightly correlated with photoreceptor response [24, 25]. However, axial resolution of the confocal system was limited, and sub-cellular correlate of the IOS in retinal photoreceptor has not been well understood. Dynamic near infrared (NIR) microscopy of retinal slices, which opened a cross section of retinal layers, disclosed a dominant IOS source at photoreceptor outer segments. In this Letter, we report depth-resolved en face OCT imaging of IOS response at photoreceptor outer segments in living frog eyecups at sub-cellular resolution.
Eyecups of leopard frogs (Rana Pipiens) were selected for this study. Protocols for all experiment procedures were approved by the Institutional Animal Care and Use Committee of the University of Alabama at Birmingham. During the experiment, the frog was first dark adapted for ~2 h and then euthanized by rapid decapitation and double pithing. Eyeballs were then dissected and moved to Ringer’s solution (containing in mM/L: 110 NaCl, 2.5 KCl, 1.6 MgCl2, 1.0 CaCl2, 22 NaHCO3, and 10 D-glucose). The eyecup was made by hemisecting the eye globe below the equator with fine scissors and then removing the lens. Surgical operation was conducted in a dark room illuminated with dim red light. The eyecup was immersed in Ringer’s solution during functional IOS imaging of retinal response.
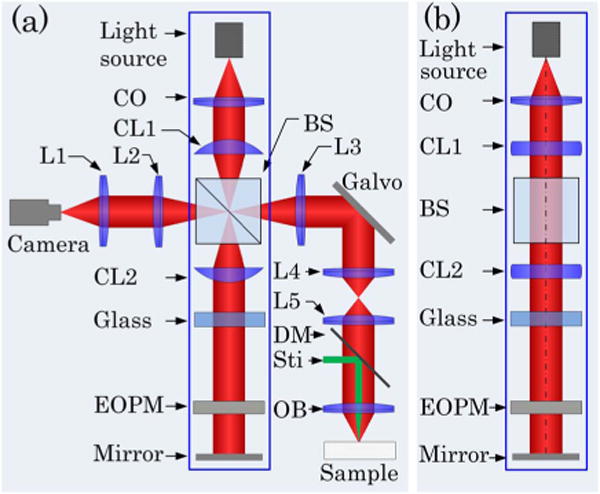
In order to conduct sub-cellular resolution en face IOS imaging of the retina, a rapid time domain line-scan OCT (LS-OCT) system was developed. The LS-OCT combined technical merits of electro-optic phase modulator (EOPM) modulation and line-scan strategy to achieve rapid, vibration-free OCT imaging [26]. Figure 1 shows a block diagram of the time domain LS-OCT system. A NIR superluminescent diode (SLD-351, Superlum), with center wavelength λ = 830 nm and bandwidth Δλ = 60 nm, was used for dynamic OCT imaging. In the illumination path, the cylindrical lens CL1 was used to condense the NIR light in one dimension to produce a focused line illumination at the retina. The focused line illumination was scanned over the retina by a galvo (GVS001, Thorlabs) to achieve rapid en face imaging. In the reference path, the cylindrical lens CL2 was used to convert the focused light back to collimated light. The glass block was used to compensate for optical dispersion. The EOPM (Model 350–50, Conoptics) was used to implement vibration-free phase modulation. Light reflected by the mirror and the retina interfered and was captured by the line-scan camera (Sprint spl2048-140km, Basler) to retrieve OCT images [26]. The line-scan camera had line speed up to 140; 000 lines/s when working at double-line mode and 70; 000 lines/s at single-line mode. Single-line mode was selected for this study to ensure high resolution of IOS recording. In coordination with the NIR line illumination, the 1D CMOS array (1 × 2048 pixels, 10 μm × 10 μm) of the line-scan camera acted as a slit to achieve a confocal configuration for effective rejection of out-of-focus light.
Fig. 1.

Schematic diagram of the time domain LS-OCT. (a) Top view of the system. CO, collimator; L1–L5, lenses, with focal lengths 80, 40, 80, 40, and 75 mm, respectively; OB, objective (10×, NA = 0.3); CL1 and CL2, cylindrical lenses, with focal lengths 75 mm; BS, beam splitter; DM, dichroic mirror; Sti, green light stimulus; EOPM, electro-optic phase modulator. (b) Side view of blue rectangle area in (a).
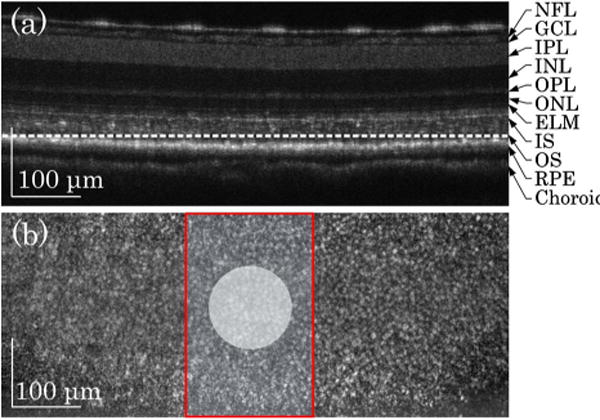
Using a 10× (NA 0.3) water immersion objective, lateral and axial resolutions of the system were ~2 μm (0.61λ/NA) and ~4 μm (0.44λ2/nΔλ, where n was refractive index of retinal tissue, n ≈ 1.4), respectively. Figure 2 shows representative time domain LS-OCT images of living frog eyecups. The B-scan OCT [Fig. 2(a)], which revealed a cross-sectional image of the eyecup, was reconstructed from a stack of en face OCT images acquired at 50 frames per second (fps). Figure 2(a) disclosed clear structures of outer segment (OS), inner segment (IS) ellipsoid, external limiting membrane (ELM), outer plexiform layer (OPL), inner nuclear layer (INL), inner plexiform layer (IPL), ganglion cell layer (GCL), and nerve fiber layer (NFL). In the en face OCT image [Fig. 2(b)], individual photoreceptors could be unambiguously identified.
Fig. 2.

LS-OCT images of frog eyecup. (a) OCT B-scan image. The image revealed multiple hyper-reflective OCT bands, including NFL, GCL, IPL, INL, OPL, ONL, ELM, IS, OS, RPE, and choroid. (b) Representative en face OCT image recorded at photoreceptor OS [indicated by the dashed white line in (a)]. The red rectangle area shows the area where IOS images were acquired. The white spot indicates the green light stimulus.
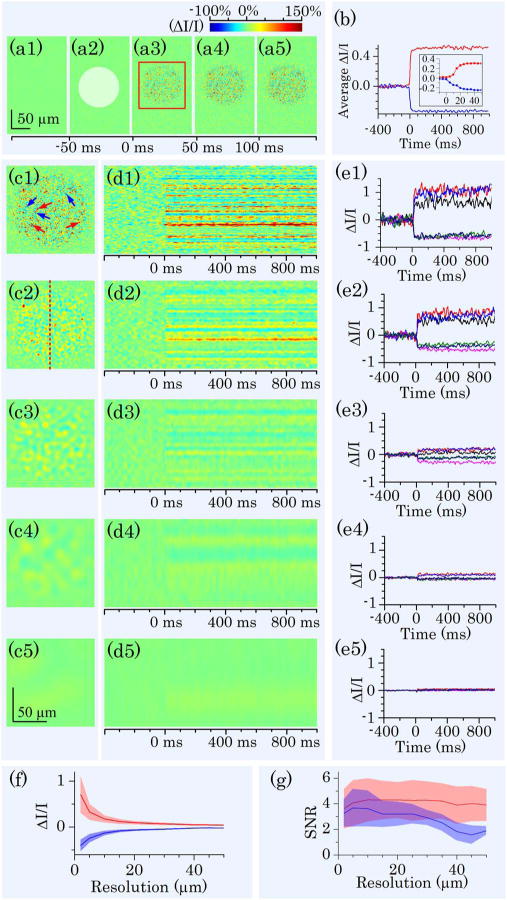
Given excellent axial resolution, we focused the OCT recording at photoreceptor outer segments [dashed white line in Fig. 2(a)]. For better temporal resolution, we reduced the field of view [Fig. 2(b) red rectangle area] and increased frame speed from 50 to 200 fps. The details of IOS processing procedure have been documented in our previous publication [24]. Briefly, IOS images are illustrated with a unit of ΔI/I, where I is the background obtained by averaging prestimulus images, and ΔI is the difference between each image and the background. Figure 3(a) illustrates IOS images of photoreceptor outer segments. A green light flash [white spot in Fig. 3(a2)] was introduced for photoreceptor stimulation at time 0. In Fig. 3(a), it was observed that the IOS pattern showed a tight correlation with the stimulus spot. In other words, the IOS response was predominantly confined in the stimulus spot. Positive and negative IOSs were observed in the stimulus-activated area. Figure 3(b) shows separate averages of positive and negative IOSs in the image area. Positive and negative signals were defined by the 3 – δ rule [24].
Fig. 3.

IOS images and curves acquired at 200 fps. (a) Representative IOS images, with time interval of 50 ms. A 10 ms green light stimulus was introduced at time 0 (a2). Rapid IOS occurred immediately after the stimulation; mixed positive and negative IOSs were observed. (b) Separate averages of positive (red trace) and negative (blue trace) IOSs. The inset is enlarged curve of early IOS response. (c) IOS images with computationally controlled resolutions. Resolutions in (c1) to (c5) were 2, 5, 10, 20, and 50 μm, respectively. (d) Spatiotemporal IOS pattern at position marked by the red dashed line in (c2). (e) Temporal IOS profiles of representative pixels marked by arrows in (c1). Red arrows indicated positive IOS pixels; blue arrows indicated negative IOS pixels. (f) Relationship between resolution and IOS magnitudes of representative pixels within stimulated area. Red curves represent positive IOS; blue curves represent negative IOS. Shadow areas show standard deviation. (g) The effect of resolution on IOS SNR. Red curves represent positive IOS; blue curves represent negative IOS. Shadow areas show standard deviation.
The mixed positive and negative IOSs indicated that high resolution was essential for IOS sensitivity of IOS imaging. Otherwise, IOSs with different signal polarities could integrate together to lower IOS magnitude. Figure 3 (c) illustrates quantitative assessment of the effect of spatial resolution on IOS measurement. Variable resolutions were computationally implemented by applying different sized Butterworth windows in Fourier domain to OCT images. Figure 3(e) shows IOS curves of representative positive [red arrows in Fig. 3(c1)] and negative [blue arrows in Fig. 3(c1)] pixels at different resolutions. It was observed that the IOS magnitude dropped as the resolution decreased. At 50 μm resolution, IOS patterns could be barely observed. Figure 3(f) shows separate average of positive and negative IOSs observed in Fig. 3(a). Both positive and negative IOSs decreased rapidly with lowered resolution. Figure 3(g) illustrates the effect of spatial resolution on IOS signal-to-noise ratio (SNR). In comparison with significant effect of the resolution on IOS magnitude, the effect on IOS SNR was relatively insignificant.
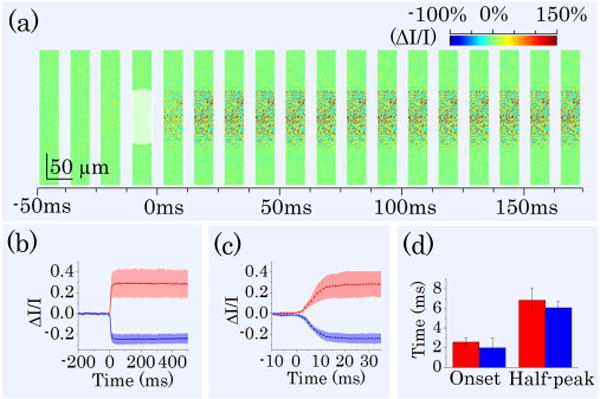
As shown in Fig. 3(b), the IOS response occurred almost immediately and reached half-peak and maximum at ~10 and ~30 ms, respectively. Slight difference of the onset times of positive and negative IOSs were observed in the inset panel of Fig. 3(b). In order to investigate the onset time courses of positive and negative IOSs, we improved imaging speed from 200 to 800 fps. Figure 4(a) shows representative IOS images recorded at 800 fps. Figure 4(b) shows averaged IOS curves of nine recordings. Here we defined onset time as the time that IOS magnitude reached μ = 3σ, where μ and σ were mean and standard deviation of prestimulus IOS of each pixel. From Fig. 4(c) we could estimate that onset time was within 3 ms and half-peak time was within 10 ms. Figure 4(d) shows mean values of onset time and half-peak time of positive and negative IOSs calculated from curves in Fig. 4(b). For positive IOS, the mean onset time was 2.5 ms, and the mean half-peak time was 7 ms; for negative IOS, the mean onset time was 2 ms, and the mean half-peak time was 6 ms. Mean temporal parameter values of negative IOS were smaller than that of positive IOS. We conducted one-tailed unpaired Student’s t-test for those data. At 10% level of significance, we could say that negative IOS onset time was shorter than that of positive IOS and negative IOS half-peak time was shorter than that of positive IOS (p-values were 0.08 and 0.07 for onset time and half-peak time, respectively).
Fig. 4.

IOS images and curves acquired at 800 fps. (a) A sequence of IOS images. Image width is one quarter of image width in Fig. 3(a). Time interval of presented images is 12.5 ms. A 10 ms green light stimulus was introduced at time 0. (b) Separate averages of positive and negative IOSs. Red curves represent positive IOS; blue curves represent negative IOS. Shadow areas show standard deviations. (c) Enlarged image of (b) from −10 to 35 ms. (d) Onset time and half-peak time of average IOSs of nine different recordings. Red bars represent positive IOS; blue bars represent negative IOS.
In summary, a LS-OCT system was developed to conduct sub-cellular resolution IOS imaging of retinal photoreceptors in a living eyecup. High axial resolution enabled us to conduct selective IOS mapping of photoreceptor outer segments. High-resolution images revealed a robust IOS pattern, with mixed positive and negative responses in adjacent locations. Computational simulation indicated that high resolution was essential to ensure high IOS sensitivity. However, the effect of spatial resolution on IOS SNR was relatively insignificant. Interestingly, the best SNR was observed around 10 μm, which was slightly larger than the dimension of individual photoreceptors. We consistently observed that the onset time of positive IOS was slightly slower, compared to negative IOS [Figs. 3(b) and 4(d)]. This suggests that the observed positive and negative IOSs may reflect different aspects of light phototransduction in photoreceptors. Previous studies with isolated photoreceptor outer segments and isolated retinas have reported transient IOSs correlated with early procedures of visual photo-transduction [27–29]. Both binding and releasing of G-proteins to photo-excited rhodopsin may contribute to the IOSs. While the early phase of negative IOS may be partially affected by the binding of photo-excited rhodopsin to G proteins, some part of the positive IOSs may relate to the dissociation of the complex upon GDP/GTP exchange [28]. Further investigation of spatiotemporal characteristics of the IOSs from photoreceptor outer segments is required to optimize instrument design for functional IOS imaging of retinal photoreceptors.
Acknowledgments
This research is supported in part by NSF CBET-1055889, NIH R21 RR025788, NIH R21 EB012264, UA-SOM I3 Pilot Award, and the Open Research Program of the State Key Laboratory of Molecular Developmental Biology, China.
Footnotes
OCIS codes: (170.0110) Imaging systems; (170.2655) Functional monitoring and imaging; (170.5755) Retina scanning.
References
- 1.Curcio CA, Medeiros NE, Millican CL. Investig Ophthalmol Vis Sci. 1996;37:1236. [PubMed] [Google Scholar]
- 2.Nagy D, Schonfisch B, Zrenner E, Jagle H. Investig Ophthalmol Vis Sci. 2008;49:4664. doi: 10.1167/iovs.07-1360. [DOI] [PubMed] [Google Scholar]
- 3.Sunness JS, Massof RW, Johnson MA, Bressler NM, Bressler SB, Fine SL. Ophthalmology. 1989;96:375. doi: 10.1016/s0161-6420(89)32883-1. [DOI] [PubMed] [Google Scholar]
- 4.Scholl HP, Zrenner E. Surv Ophthalmol. 2000;45:29. doi: 10.1016/s0039-6257(00)00125-9. [DOI] [PubMed] [Google Scholar]
- 5.Hood DC. Prog Retinal Eye Res. 2000;19:607. doi: 10.1016/s1350-9462(00)00013-6. [DOI] [PubMed] [Google Scholar]
- 6.Quigley HA, Addicks EM, Green WR. Arch Ophthalmol. 1982;100:135. doi: 10.1001/archopht.1982.01030030137016. [DOI] [PubMed] [Google Scholar]
- 7.Jacobson SG, Cideciyan AV, Iannaccone A, Weleber RG, Fishman GA, Maguire AM, Affatigato LM, Bennett J, Pierce EA, Danciger M, Farber DB, Stone EM. Investig Ophthalmol Vis Sci. 2000;41:1898. [PubMed] [Google Scholar]
- 8.Johnson PT, Lewis GP, Talaga KC, Brown MN, Kappel PJ, Fisher SK, Anderson DH, Johnson LV. Investig Ophthalmol Vis Sci. 2003;44:4481. doi: 10.1167/iovs.03-0436. [DOI] [PubMed] [Google Scholar]
- 9.Hogg RE, Chakravarthy U. Prog Retinal Eye Res. 2006;25:249. doi: 10.1016/j.preteyeres.2005.11.002. [DOI] [PubMed] [Google Scholar]
- 10.Schei JL, McCluskey MD, Foust AJ, Yao XC, Rector DM. Neuroimage. 2008;40:1034. doi: 10.1016/j.neuroimage.2007.12.055. [DOI] [PMC free article] [PubMed] [Google Scholar]
- 11.Yao XC, Foust A, Rector DM, Barrowes B, George JS. Biophys J. 2005;88:4170. doi: 10.1529/biophysj.104.052506. [DOI] [PMC free article] [PubMed] [Google Scholar]
- 12.Yao XC, Rector DM, George JS. Appl Opt. 2003;42:2972. doi: 10.1364/ao.42.002972. [DOI] [PubMed] [Google Scholar]
- 13.Lu RW, Zhang QX, Yao XC. Opt Lett. 2011;36:1866. doi: 10.1364/OL.36.001866. [DOI] [PMC free article] [PubMed] [Google Scholar]
- 14.Yao XC, Cui WX, Li YC, Zhang W, Lu RW, Thompson A, Amthor F, Wang XJ. J Mod Opt. 2012;59:843. doi: 10.1080/09500340.2012.674564. [DOI] [PMC free article] [PubMed] [Google Scholar]
- 15.Li YC, Cui WX, Wang XJ, Amthor F, Lu RW, Thompson A, Yao XC. Opt Express. 2011;19:99. doi: 10.1364/OE.19.000099. [DOI] [PMC free article] [PubMed] [Google Scholar]
- 16.Schallek J, Li H, Kardon R, Kwon Y, Abramoff M, Soliz P, Ts’o D. Investig Ophthalmol Vis Sci. 2009;50:4865. doi: 10.1167/iovs.08-3290. [DOI] [PMC free article] [PubMed] [Google Scholar]
- 17.Hanazono G, Tsunoda K, Shinoda K, Tsubota K, Miyake Y, Tanifuji M. Investig Ophthalmol Vis Sci. 2007;48:2903. doi: 10.1167/iovs.06-1294. [DOI] [PubMed] [Google Scholar]
- 18.Jonnal RS, Rha J, Zhang Y, Cense B, Gao WH, Miller DT. Opt Express. 2007;15:16141. doi: 10.1364/OE.15.016141. [DOI] [PMC free article] [PubMed] [Google Scholar]
- 19.Grieve K, Roorda A. Investig Ophthalmol Vis Sci. 2008;49:713. doi: 10.1167/iovs.07-0837. [DOI] [PubMed] [Google Scholar]
- 20.Rha J, Schroeder B, Godara P, Carroll J. Opt Lett. 2009;34:3782. doi: 10.1364/OL.34.003782. [DOI] [PMC free article] [PubMed] [Google Scholar]
- 21.Yao XC, Yamauchi A, Perry B, George JS. Appl Opt. 2005;44:2019. doi: 10.1364/ao.44.002019. [DOI] [PubMed] [Google Scholar]
- 22.Srinivasan VJ, Wojtkowski M, Fujimoto JG, Duker JS. Opt Lett. 2006;31:2308. doi: 10.1364/ol.31.002308. [DOI] [PubMed] [Google Scholar]
- 23.Bizheva K, Pflug R, Hermann B, Povazay B, Sattmann H, Qiu P, Anger E, Reitsamer H, Popov S, Taylor JR, Unterhuber A, Ahnelt P, Drexler W. Proc Natl Acad Sci USA. 2006;103:5066. doi: 10.1073/pnas.0506997103. [DOI] [PMC free article] [PubMed] [Google Scholar]
- 24.Zhang QX, Lu RW, Curcio CA, Yao XC. Investig Ophthalmol Vis Sci. 2012;53:8139. doi: 10.1167/iovs.12-10732. [DOI] [PMC free article] [PubMed] [Google Scholar]
- 25.Zhang QX, Lu RW, Li YG, Yao XC. Opt Lett. 2011;36:4692. doi: 10.1364/OL.36.004692. [DOI] [PMC free article] [PubMed] [Google Scholar]
- 26.Lu RW, Curcio CA, Zhang Y, Zhang QX, Pittler SJ, Deretic D, Yao XC. J Biomed Opt. 2012;17:060504. doi: 10.1117/1.JBO.17.6.060504. [DOI] [PMC free article] [PubMed] [Google Scholar]
- 27.Hofmann KP, Uhl R, Hoffmann W, Kreutz W. Biophys Struct Mech. 1976;2:61. doi: 10.1007/BF00535653. [DOI] [PubMed] [Google Scholar]
- 28.Kuhn H, Bennett N, Michel-Villaz M, Chabre M. Proc Natl Acad Sci USA. 1981;78:6873. doi: 10.1073/pnas.78.11.6873. [DOI] [PMC free article] [PubMed] [Google Scholar]
- 29.Arshavsky VY, Lamb TD, Pugh EN., Jr Annu Rev Physiol. 2002;64:153. doi: 10.1146/annurev.physiol.64.082701.102229. [DOI] [PubMed] [Google Scholar]


