Abstract
Background
Non-Gaussian diffusion imaging by using diffusional kurtosis imaging (DKI) allows assessment of isotropic tissue as of gray matter (GM), an important limitation of diffusion tensor imaging (DTI).
Objective
In this study, we describe DKI and DTI metrics of GM in MS patients and their association with cognitive deficits.
Methods
Thirty-four patients with relapsing-remitting MS and 17 controls underwent MRI on a 3T scanner including a sequence for DKI with 30 diffusion directions and 3b values for each direction. Mean kurtosis (MK), mean diffusivity and fractional anisotropy (FA) of cortical and subcortical GM were measured using histogram analysis. Spearman rank correlations were used to characterize associations among imaging measures and clinical/neuropsychological scores.
Results
In cortical GM, a significant decrease of MK (0.68 vs. 0.73; p<0.001) and increase of FA (0.16 vs. 0.13; p<0.001) was found in patients compared to controls. Decreased cortical MK was correlated with poor performance on Delis-Kaplan Executive Function System test (r=0.66, p=0.01).
Conclusion
Mean kurtosis is sensitive to abnormality in GM of MS patients and can provide information that is complementary to that of conventional DTI-derived metrics. The association between MK and cognitive deficits suggests that DKI might serve as a clinically relevant biomarker for cortical injury.
Keywords: Multiple Sclerosis, MRI, Diffusion, Kurtosis, gray matter, cognitive impairment
Introduction
Gray matter (GM) pathology is a common feature of MS and has relevant impact on cognitive deficits. 1 Despite the high frequency at postmortem examination, both focal and diffuse GM demyelination are rather inconspicuous on conventional MRI scans.2 While newer MRI sequences can improve the detection of GM lesions,2,3 advanced MRI techniques allow the detection and quantification of diffuse lesional and non-lesional GM injury.4,5 Among quantitative MRI techniques, diffusion tensor imaging (DTI) has long been used to detect microstructural changes.4 A fundamental limitation of DTI is that the data analysis approximates biological water diffusion as being Gaussian, although substantial non-Gaussian diffusion is observed throughout the brain and is believed to arise from diffusion barriers, such as cell membranes and organelles. Non-Gaussian diffusion can be measured using diffusional kurtosis imaging (DKI), a recently developed MRI technique.6 In addition to traditional DTI-derived metrics, it allows the measurement of mean kurtosis (MK), an index of tissue microstructural complexity. MK provides an average measure over all directions of the amount by which the diffusion displacement probability distribution departs from a Gaussian form.6 The MK differs from fractional anisotropy (FA) because it does not require the microstructure of the tissue to be spatially oriented and hence is equally applicable in both white matter (WM) and highly isotropic tissue such as GM. A decrease of MK is associated with degenerative processes leading to neuronal shrinkage and changes in axonal and myelin density.7 In addition, results from animal studies found that MK is sensitive to GM changes associated with reactive astrogliosis.8
DKI has shown to have clinical value in detecting tissue microstructure abnormality in several neurological disorders such as in glioma,9 mild traumatic brain injury,10 neurodegenerative disease11 and in the spinal cord of MS patients.12 A study addressing the reproducibility of DKI imaging using data from three independently acquired data sets from three subjects describe 5% within-subject coefficient with an intraclass coefficient of 0.88 that is adequate for this study.13 The aims of our study were: a) to measure the extent of GM pathology in MS patients using DKI; b) to investigate the relationship between GM injury measured by DKI and measures of WM lesion and brain volume; and c) to explore the relationship between GM DKI-derived metrics and clinical/cognitive impairment.
Material and Methods
Subjects
Thirty-four patients meeting the diagnostic criteria for MS,14 with relapsing remitting course (RR-MS) were recruited prospectively. Patients had to be relapse- and steroid-treatment free for at least three months. Exclusion criteria were the presence of other relevant diseases and contraindications to performing MRI. Neurological disability was assessed using the expanded disability status scale (EDSS).15 Patients had a mean age of 36.9 years (range 21-61), a mean disease duration of 3.48 years (range 1-12) and a median EDSS of 2 (range 0-6). All patients except for four were under disease modifying treatment: natalizumab (n=5), glatiramer acetate (n=12), interferon ß-1α (n=13). For comparison, seventeen age and sex-matched healthy controls (mean age 36.6 years, range 20-60) with no known brain abnormalities and no neurological symptoms were recruited. Approval for this study was obtained from the local ethical committee. Written informed consent was obtained from all subjects.
Neuropsychological Assessment
Neuropsychological testing (NP) was administered by a clinical psychologist blinded to imaging results. All MS patients underwent NP using a battery examining the following cognitive domains: (a) memory (Digital Span Test [DBS] and California Verbal Learning Test [CVLT]); (b) processing speed (Symbol Digit Modalities Test [SDMT], 3-sec trial of the Paced Auditory Serial Addition Test [PASAT-3 secs]); (c) working memory (SDMT, and PASAT-3 secs); (d) executive functioning: (Delis-Kaplan Executive Function System [D-KEFS] Color-Word Interference Test: Inhibition [D-KEFSI] and Inhibition Switching [D-KEFSIS]). All neuropsychological test results were converted to z scores using published norms. Patients that scored at or below the fifth percentile (−1.6 standard deviations below the normative mean) on two or more of the neuropsychological tests administered compared to controls were categorized as cognitively impaired.16
MR Imaging acquisition
MRI was performed using a 3-T scanner (Tim Trio, Siemens Medical Systems, Erlangen, Germany) with an 8-channel phased-array head coil. The following imaging protocol was acquired in all subjects: a) axial T2–weighted turbo spin echo (TSE) sequence (time to repeat [TR] = 5000ms, time to echo [TE] 88ms, FOV = 178×220, matrix 284×448, slice thickness 3mm, 50 3-mm thick contiguous slices); b) sagittal 3D T1-weighted sequence using a magnetization prepared rapid acquisition of gradient echoes (MPRAGE) (TR 2300ms, TI 900ms, TE 2.98ms, FOV = 240×256mm2, matrix 230×256, 160 slices, voxel size 1×1×1mm3); c) axial twice-refocused-spin-echo (TRSE) diffusion sequence with 30 different diffusion encoding directions using an optimized sampling strategy. For each direction, three b-values (0, 1000, 2000 s/mm2) were used. (TR 3700ms, TE 96ms, FOV 222×222mm2, matrix 82×82, slice thickness 2.7mm, number of averages: 2, 28 oblique axial slices, isotropic voxel size 2.7mm. Acquisition time of 7:58 min.), d) 2D T1 Fast Low Angle Shot (FLASH) sequence acquired in patients as the last scan after intravenous injection of gadopentate dimeglumine (Magnevist, Berlex Laboratories, Wayne, NJ) with a standard dose of 0.1mmol/kg bodyweight (TR/TE = 354/2.73ms, FOV = 191*230, matrix 768×640, 50 3-mm tick contiguous slices). All 2D sequences were oriented along the AC-PC line.
Image Analysis
Lesion volume measurements
T2 hyperintense and T1 hypointense lesion volume (T2-LV; T1-LV) measurements were performed by a trained physician using a semiautomatic segmentation technique based on local thresholding (Jim version 3, Xinapse Systems, UK, http://www.xinapse.com).
Brain volume
For all subjects, normalized brain volume (NBV), normalized GM, and WM volumes (GMV and WMV) were measured on MPRAGE images using SIENAX as described previously.17 Each segmented compartment was visually inspected to ensure correct segmentation.
To correct for misclassification of T1-W GM volume in presence of high T1-W hypointense LV, each T1-W hypointense lesion was filled with the mean intensity value of the normal appearing white matter (NAWM) present in the same slice of the lesion.
DKI/DTI
The DKI Data processing was performed using in-house developed software running in Matlab 7 (Mathworks, Sherborn, MA, USA). Three-dimensional motion correction was performed on the diffusion images using SPM (Statistical Parametric Mapping, University College London, UK) followed by spatial smoothing using a Gaussian filter with full-width-half-maximum of 2.5 mm. For each diffusion encoding direction, the signal intensities for the diffusion weighted data were fitted with the DKI and DTI model 6 to determine apparent diffusion coefficient and apparent kurtosis coefficient for that particular direction. From the diffusion tensor (DT) and the kurtosis tensor, several scalar measures can be derived, such as conventional DT parameters (fractional anisotropy [FA], mean diffusivity [MD], radial diffusivity [RD] and axial diffusivity [AD]) and mean kurtosis [MK]. Further data-processing was performed using the FSL Software library (www.fmrib.ox.ac.uk/fsl). In order to obtain separate WM and cGM/sGM maps, the affine transformation needed to correct for position between the b0 (without diffusion weighting) images and T2 weighted images was calculated. Normalized mutual information was the similarity chosen for matching. The obtained transformation matrix and a linear interpolation were applied to the quantitative maps. The whole brain T1 images as well as the cGM/sGM and WM masks were registered to the T2 image as described above. Then each GM mask was manually segmented into a mask of cortical GM (cGM) and subcortical GM (sGM) using Jim (version 3, Xinapse Systems, UK, http://www.xinapse.com)
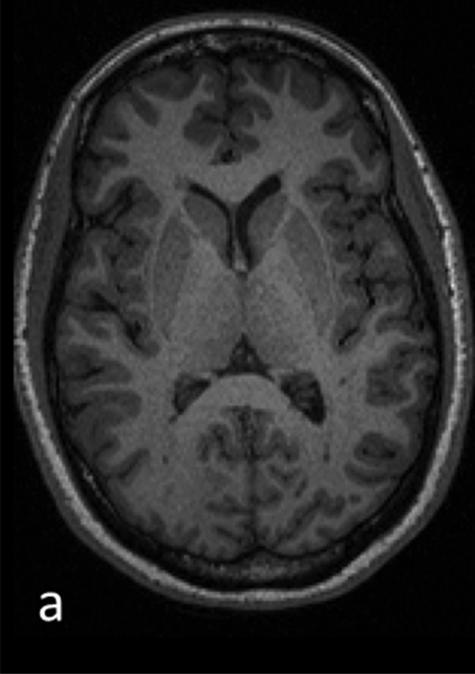
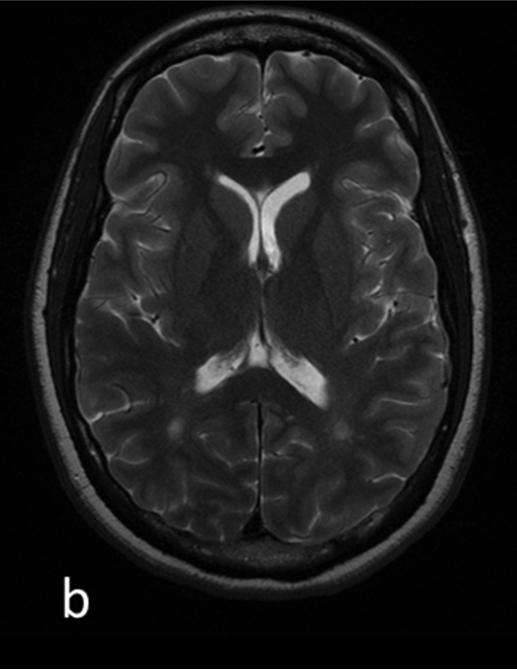
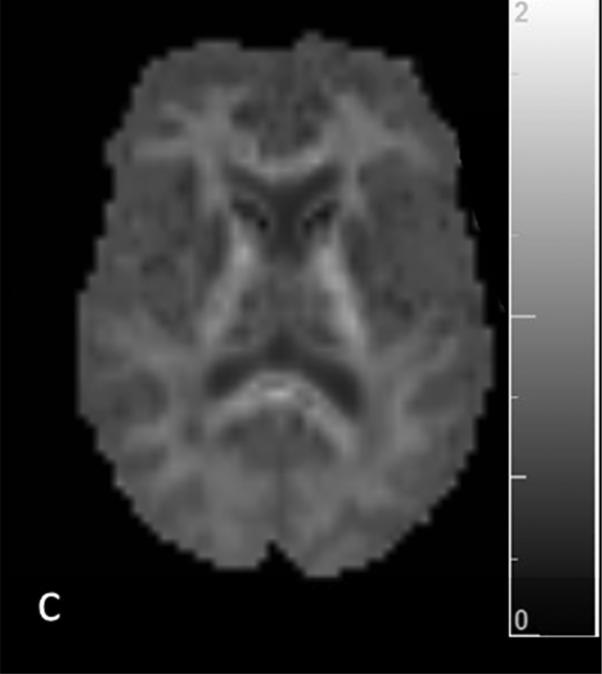
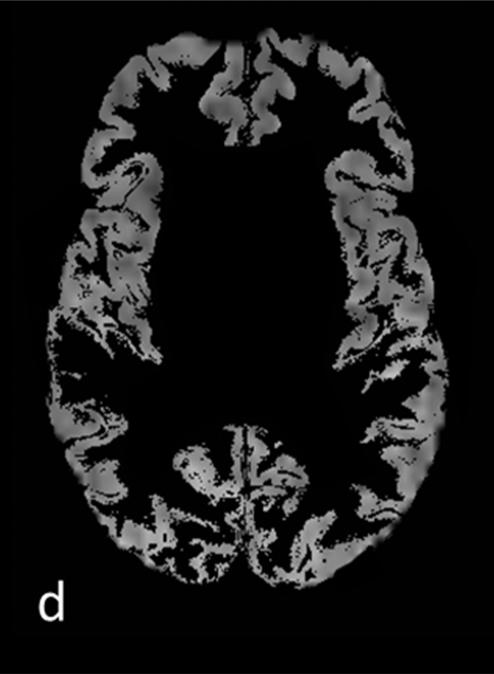
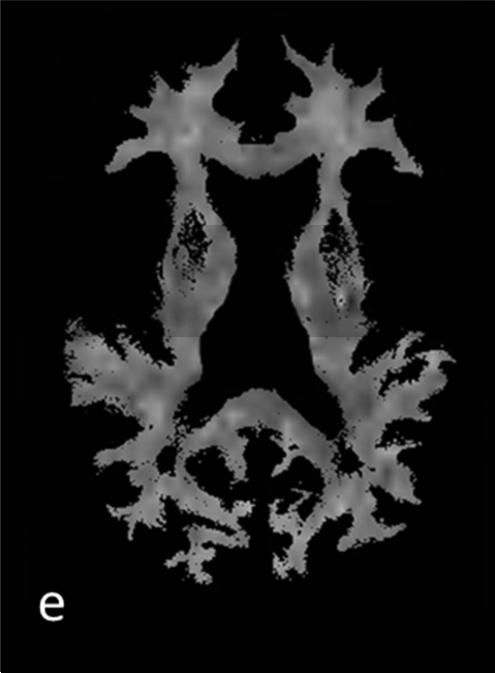
The T2 lesion mask was subtracted from the WM mask to receive a WM mask of normal-appearing WM (NAWM) exclusively. The quantitative maps were masked with the segmentation results. To exclude pixels with low probability for GM and WM assigned by the segmentation and therefore minimize partial volume effects, all quantitative maps were thresholded at a value of >0.70 (Figure 1).18 Nevertheless some WM maps reveal little contamination with sGM, especially some of the putamen and globus pallidus. Every transformation result was examined individually to exclude errors due to incorrect registration. Histograms with 256 bins were created from these images. To compute for variability of brain size, each bin was normalized by the total number of voxels contributing to the histogram. From each histogram the mean value was extracted.
Figure 1.
T1 (a) and T2 (b) weighted images and corresponding segmentation results of one patients’ mean kurtosis map: c) whole-brain MK map c) gray matter MK map with grayscale colormap d) cortical MK map and e) white matter MK map with removed lesions (NAWM)
Statistical Analysis
Exact Mann-Whitney and unequal variance t tests were used to compare subject groups for each imaging measure and each numeric demographic or clinical factor (e.g., age, EDSS). Analysis of covariance (ANCOVA) was used to adjust these same comparisons for age and gender. The ANCOVA was first performed using the observed values of each measure as dependent variable and then repeated using the ranks of the measure as dependent variable. Fisher's exact test was used to assess whether gender was associated with cognitive impairment or clinical status. Spearman rank correlations were used to characterize bivariate associations among imaging measures and neuropsychological scores and for the association of EDSS and T2LV since, while T2LV is not discrete, EDSS is both discrete and ordinal rather than numeric.
Direct and partial correlations were derived, the latter adjusting for age and gender in order to identify associations that are not merely an indirect consequence of a mutual dependence on these cofactors. All statistical tests were conducted at the two-sided 5% significance level using SAS 9.3 (SAS Institute, Cary, NC).
Results
There was no significant difference between patients and controls in terms of gender composition (p=1.0) and age (p>0.7). Table 1 summarizes the demographic, clinical and conventional brain MRI data of patients and controls. There was a significant difference in GMV (p=0.01) and NBV (p=0.02) between groups.
Table 1.
Demographic, clinical and conventional MRI data (mean and standard deviation) obtained from MS patients and healthy controls
| Controls (n=17) | Patients (n=34) | |
|---|---|---|
| Age (years, range) | 36.65 (21-61) | 36.91 (20-60) |
| Gender (F/M) | 12/5 | 25/9 |
| DD (range) | - | 3.48 ± 9.64 |
| EDSS (median and range) | - | 1.92 (0-6) |
| T2-LV (mL mean ± SD) | - | 2.27 ± 3.99 |
| T1-LV (mL mean ± SD) | - | 0.55 ± 0.98 |
| Gd lesion count (mean ± SD) | - | 0.61 ± 0.91 |
| NBV (mL mean ± SD) | 1690.9 ± 70.9 | 1644.7 ± 57.4 * |
| GMV (mL mean ± SD) | 885.0 ± 39.7 | 855.9 ± 31.1 * |
| WMV (mL mean ± SD) | 805.8 ± 67.6 | 789.0 ± 40.0 * |
Abbreviations: SD= Standard deviation, EDSS = Expanded Disability Status Scale, DD = disease duration (years), T1-LV = T1 hypointense lesion load, T2-LV = T2 hyperintense lesion load, GMV = gray matter volume, WMV = white matter volume, NBV = normalized brain volume, Gd lesion count = number of gadolinium enhancing lesions
= p-values (unequal variance t-test) for comparison of patients and controls (GMV: p=0.01; WMV: p=0.3; NBV: p=0.02)
Extent of GM and NAWM pathology measured by DKI/DTI
Reported p-values are derived from ANCOVA, using data ranks as dependent variable, to compare the groups with adjustment for age and gender. Compared with controls, MS patients showed significantly lower MK in cortical and subcortical GM (cGM: p<0.001; sGM: p=0.009) and higher FA, AD and RD in cGM (FA: p<0.001, AD: p<0.001; RD: p<0.001) and sGM (FA: p<0.001, AD: p=0.005; RD: p=0.002). MD values were higher in patients than controls but the difference did not reach statistical significance. There were no statistically significant correlation between MK and FA, MD , AD and RD values in cortical and subcortical GM. Mean/median values of kurtosis and diffusion metrics from GM of MS patients and controls are shown in Table 2. In patients’ NAWM FA was significantly decreased (0.28 vs. 0.30; p=0.04) and AD increased (1.18 vs. 1.22, p=0.04), whereas there was no significant difference in MD (0.94 vs. 0.96, p=0.2). A trend towards statistical significance was detected for the decrease of MK (0.91 vs. 0.86, p=0.07) and increase of RD (0.79 vs 0.81, p=0.06).
Table 2.
Mean value, standard deviation and median value (in brackets) of the diffusion metrics in cortical and subcortical gray matter from MS patients and controls
| Controls | Patients | p value | ||
|---|---|---|---|---|
| cGM | MK | 0.73 ± 0.06 (0.73) | 0.68 ± 0.01 (0.68) | <0.001 |
| FA | 0.13 ± 0.05 (0.13) | 0.16 ± 0.04 (0.16) | <0.001 | |
| MD | 1.13 ± 0.13 (1.12) | 1.19 ± 0.17 (1.2) | 0.15 | |
| AD | 1.22 ± 0.15 (1.23) | 1.36 ± 0.07 (1.36) | <0.001 | |
| RD | 1.01 ± 0.08 (1.06) | 1.12 ± 0.09 (1.1) | <0.001 | |
| sGM | MK | 0.74 ± 0.01 (0.74) | 0.71 ± 0.01 (0.72) | 0.009 |
| FA | 0.12 ± 0.05 (0.12) | 0.17 ± 0.03 (0.18) | <0.001 | |
| MD | 1.11 ±0.08 (1.11) | 1.18 ±0.17 (1.16) | 0.06 | |
| AD | 1.24 ± 0.11 (1.23) | 1.34 ± 0.08 (1.34) | 0.005 | |
| RD | 1.02 ± 0.03 (1.0) | 1.11 ± 0.01 (1.11) | 0.002 |
Note: All parameters other than MD (10−3 mm2/sec) are dimensionless.
Abbreviations: cGM = cortical gray matter, sGM = subcortical gray matter, MK = mean kurtosis; FA = fractional anisotropy, MD = mean diffusivity; AD = axial diffusivity, RD = radial diffusivity
Relationship of GM injury and WM injury, measures of lesion and brain volume
Spearman rank correlations of diffusion parameters in GM and WM measurements are shown in Table 3. Cortical MD was significantly correlated with T1-LV (r=0.31, p=0.05) but not with T2-LV and Gd lesion count. No significant relationship between both cortical and subcortical MK or FA and lesion volumes was demonstrated. We did not find any correlation between DKI measures of GM injury and measures of brain atrophy (NBV, GMV and WMV). GM MK was significantly correlated with MK in NAWM (cGM: r=0.41, p=0.01; sGM: r=0.7, p=0.02) but not with FA, RD, AD and MD in NAWM. Cortical FA was solely correlated with FA in NAWM (r=0.6, p=0.001) but not with MD, AD, RD and MK in NAWM. Subcortical FA was correlated with FA in NAWM (r=0.53, p=0.01), MD (r= −0.34, p=0.02) and AD (r= −0.42, p=0.005). We did not observe any correlation of MD in GM and diffusion parameters of NAWM.
Table 3.
Spearman rank correlations of DKI/DTI GM parameters with WM measurements
| cortical GM | subcortical GM | |||||||||||
|---|---|---|---|---|---|---|---|---|---|---|---|---|
| MK | MD | FA | MK | MD | FA | |||||||
| r | p | r | p | r | p | r | p | r | p | r | p | |
| T2-LV | 0.2 | 0.31 | 0.51 | 0.3 | −0.3 | 0.12 | 0.1 | 0.6 | 0.31 | 0.4 | −0.43 | 0.6 |
| T1-LV | 0.12 | 0.53 | 0.31 | 0.05 | −0.28 | 0.09 | 0.22 | 0.7 | 0.71 | 0.08 | −0.18 | 0.5 |
| Gd lesions | 0.3 | 0.55 | −0.34 | 0.1 | 0.2 | 0.5 | 0.3 | 0.45 | −0.34 | 0.5 | −0.35 | 0.48 |
| NBV | 0.44 | 0.26 | −0.4 | 0.1 | 0.08 | 0.44 | 0.18 | 0.22 | −0.1 | 0.41 | 0.19 | 0.3 |
| WMV | 0.18 | 0.24 | −0.19 | 0.42 | 0.12 | 0.35 | 0.7 | 0.3 | −0.68 | 0.3 | −0.31 | 0.66 |
| GMV | 0.7 | 0.9 | −0.3 | 0.1 | 0.18 | 0.5 | 0.3 | 0.5 | −0.42 | 0.38 | −0.38 | 0.31 |
| FA NAWM | 0.24 | 0.57 | −0.22 | 0.51 | 0.6 | 0.001 | 0.5 | 0.24 | −0.4 | 0.25 | 0.53 | 0.01 |
| MD NAWM | 0.39 | 0.5 | 0.2 | 0.35 | −0.45 | 0.1 | 0.4 | 0.8 | 0.2 | 0.19 | −0.34 | 0.02 |
| MK NAWM | 0.41 | 0.01 | −0.5 | 0.2 | −0.5 | 0.3 | 0.7 | 0.02 | −0.3 | 0.4 | 0.25 | 0.36 |
| AD NAWM | 0.8 | 0.4 | 0.1 | 0.2 | −0.32 | 0.3 | 0.24 | 0.28 | 0.2 | 0.1 | −0.42 | 0.005 |
| RD NAWM | 0.49 | 0.2 | 0.19 | 0.6 | 0.3 | 0.27 | 0.48 | 0.2 | 0.3 | 0.35 | 0.5 | 0.09 |
Abbreviations: GM = gray matter,T1-LV = T1 hypointense lesion load, T2-LV = T2 hyperintense lesion load, GMV = gray matter volume, WMV = white matter volume, NBV = normalized brain volume, Gd lesions = number of gadolinium enhancing lesions, MK = mean; FA = fractional, MD = mean diffusivity; AD = axial diffusivity, RD = radial diffusivity, NAWM = normal appearing white matter
Relationship between GM pathology and clinical and cognitive impairment
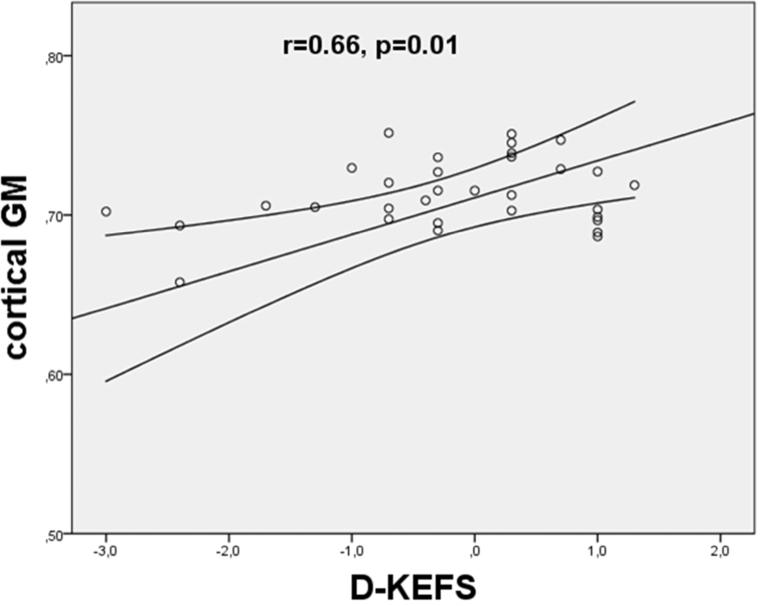
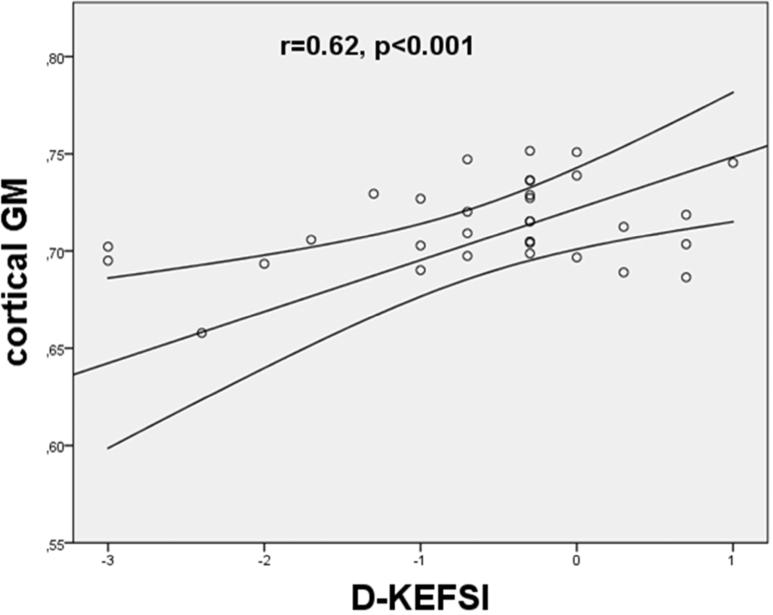
We did not find any statistically significant correlation between GM DKI/DTI metrics and EDSS. Significant correlation between GM variables and single neuropsychological tests were only found for kurtosis values: decreased MK was correlated to poor outcome in D-KEFS (cGM: r=0.66, p=0.01; sGM: r=0.55, p=0.02), and D KEFSI (cGM: r=0.62 p<0.001; sGM: r=0.67, p=0.01) (Figure 2).
Figure 2.
Scatterplot of the mean kurtosis in cortical gray matter versus outcome in neuropsychological tests ([a] D-KEFS = Delis-Kaplan Executive Function System; [b]DKEFSI = Color-Word Interference Test: Inhibition). The MK values were found to significantly correlate with the poor outcome in D-KEFS (p = 0.005) and D-KEFSI (p = 0.003). The lines represent the linear fit with a confidence intervall of 95%.
Discussion
Diffusion-weighted MRI is a powerful tool in detecting tissue microstructure changes in several neurological conditions. However, the commonly employed DTI technique assumes diffusion displacements to have a Gaussian distribution, which can mask information regarding the underlying tissue heterogeneity. DKI has been proposed as an alternative method that explicitly incorporates non-Gaussian diffusion effects.19 Kurtosis imaging allows assessment of isotropic tissue as cortical and subcortical GM, an important limitation of DTI. In the present study, we describe DKI and DTI metrics of GM in MS patients and their association with cognitive deficits. We found that, compared with healthy controls, RR-MS patients showed significantly decreased MK and increased FA in GM in addition to increased, albeit not statistically significant, MD values.
With regard to FA, our findings are in line with some but not all DTI studies investigating GM injury in MS.4,20,21 While some publications 20 report decreased FA in the normal appearing cGM, others report higher FA.4,21 This increase of FA has been attributed to the specific characteristics of cortical lesions within the examined GM. Cortical lesions are characterized by low inflammatory demyelination, microglia proliferation and activation as well as loss of dendritic arborization 22 distinguishing them from WM lesions. It has been speculated that the increase in FA may depend on changes in microglial cell morphology acquiring a more anisotropic, bipolar-oriented structure 23 during activation. While on one side the finding of elevated AD in cGM suggests ongoing process such as neuronal transection leading towards higher anisotropy tissue structure, our results of elevated MD and RD in cGM are in line with recent studies and might be driven by increased general diffusivity due to demyelination.4,20 Since MRI sequences more sensitive to the presence of GM lesions were not available at the time of our study, we cannot co-localize the increase of GM FA with the presence of cortical lesions. With regard to MK, our findings suggest a decrease in tissue complexity that may be explained by loss of dendritic ramifications as observed in active acute and chronic cortical lesions.22 Loss of dendrites and axons resulting in diffusion being less hindered are relevant to our findings, as they are known to contribute to diffusion properties in normal GM.24 The lack of correlation between FA/MD and MK in GM support the hypothesis that the observed MK alteration in GM reflects changes in tissue architecture complementary to those captured by more traditional DTI metrics.19
Although very little is known about the dynamics of GM pathology, it is likely that primary cortical demyelination and secondary neurodegeneration due to WM pathology occur simultaneously since early disease.25 As shown by a recent histological study, a mechanisms of primary cortical pathology could be represented by a soluble factor that is produced by meningeal inflammatory infiltrates.26 After diffusing into the cortex, it destroys myelin directly or indirectly through microglia activation leading to subpial demyelination. We sought to determine the relationship between GM and WM pathology by investigating the association between MK in GM and both WM lesion volume and diffuse WM damage as measured by DTI/DKI metrics. Results from histological studies are controversial about this issue. Kutzelnigg et al. 27 reported a weak correlation between diffuse WM inflammation and cortical demyelination, whereas Bø et al. 28 did not find any significant associations between abnormalities in gray and white matter. In line with previous MRI studies 29,30 we found a significant correlation of GM MK with microstructural diffuse WM damage (decreased MK in NAWM) but not with WM lesion volume. In our group of patients GM injury does not seem to be the mere consequence of retrograde degeneration of neurons whose axons have been transected in WM lesions but it is, at least in part, associated with diffuse WM microscopic injury. Longitudinal MRI studies are needed to better understand the interplay between GM and WM pathology.
We found increased FA and AD in patients’ NAWM and a trend towards a decrease of MK and increase of RD. These results might be explained by the clinical characteristics of our sample of patients who were in a relatively early stage of the disease. Although our results seem to suggest a greater damage in GM than in NAWM, it has to be pointed out that the results from NAWM were obtained after segmenting out WM lesions while the results from GM were obtained from both normal appearing GM and GM lesions.
Although GM volume was significantly lower in our patients compared to healthy controls, we did not find a significant association between decreased GM MK and GM atrophy. We took particular care during the post processing of histogram diffusion measures to reduce partial volume effect from CSF. In addition, a recent publication has shown that kurtosis metrics are less sensitive to CSF partial voluming in cortical GM than conventional diffusion metrics.31 Nevertheless the correlation between MK and FA in GM NAWM may be partly due to mixtures of both tissue types in the voxels as we did see little contamination of our WM maps with sCGM.
If confirmed in independent studies, these findings have important implications. First of all, MK may be a more specific indicator of alterations associated with tissue microstructure as opposed to gross volume changes that can lead to increased CSF. Secondly, MK may provide information about tissue integrity that is complimentary to those provided by measures of atrophy and serve as a marker for the quality of not yet lost tissue. Finally, MK might be an early marker of GM pathology and precede the development of GM volume loss. Longitudinal studies are needed to investigate the predictive value of GM MK on future development of GM atrophy.
Disappointingly, we did not find any correlation between GM MK and EDSS scores. Although previous studies report a linear correlation of GM pathology with EDSS,4 this relationship seems to reinforce with higher clinical disability.32 Hence, the low EDSS score of our cohort (median EDSS of 1.9) and the narrow range of clinical disability amongst our patients might have contributed to the lack of association. However, EDSS measurements are only rough estimates of clinical status. The test has a small dynamic range, is situational dependent and biased towards locomotor disability, which is likely to depend on spinal cord damage.15
In contrast, we observed a significant correlation between GM DKI- but not DTI-derived metrics and impairment of executive functions. Decrease of MK in both cortical and subcortical GM is associated with neropsychological scores. Cognitive dysfunction affects 40-65% of MS patients since the early stage of the disease and it is characterized by deficits in the following domains: memory, complex attention, information-processing speed and executive functions.33 Cognitive impairment impacts several aspects of daily and social life independently of the degree of physical disability and it is the most important factor for unemployment rate in MS.34 Previous MRI studies have shown that the pathological correlates of cognitive deficits may involve changes in different brain areas, including white and gray matter lesions, cortical 35 and subcortical gray matter 36 and normal-appearing WM.35 However, due to the more recent focus on GM pathology in MS, a huge effort has been devoted to identify MRI correlates of GM injury which are likely to be more closely related to cognitive impairment.1 We believe our findings can contribute to this effort by indicating MK as a potential biomarker of clinical relevant GM injury.
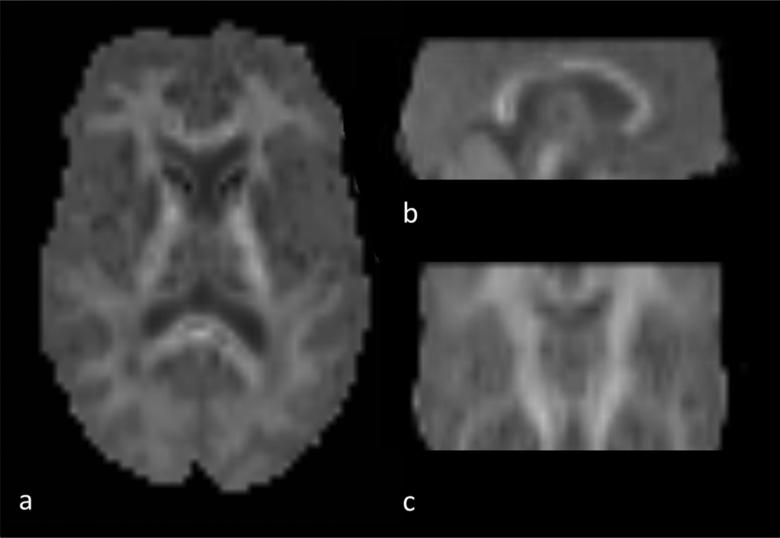
A limitation of this study is that the employed DKI sequence did not allow full brain coverage (Figure 3) and therefore precluded a voxel based morphometric analysis providing information about the regional GM distribution of injury. In addition, as mentioned above, MRI sequences sensitive to cortical lesion detection such as double inversion recovery (DIR) or phase sensitive inversion recovery (PSIR), were not available at the time of our study. Therefore we were not able to assess the contribution of GM lesions to the changes in MK measured in cortical and subcortical GM. Nonetheless, DIR and PSIR still have substantial limitations and only detect a very small fraction of all cortical lesions.2,3
Figure 3.
MK map with axial (a), sagittal (b) and coronar (c) reconstruction demonstrating the brain coverage of the applied DKI sequence.
To the best of our knowledge, this is the first report to demonstrate the application of DKI of GM in Multiple Sclerosis and its association with cognitive impairment. Employing both DTI and DKI indices in the investigation of diffuse parenchymal pathology in MS may provide more sensitive, specific and clinically relevant markers for brain injury and it is complementary to diffusivity parameters for detecting microstructural changes in GM.
Acknowledgements
Study funding: This study was supported in part by grants from the National Institute of Health RO1 NS29029 to R.G. and R56 NS051623 to M.I. and funds from the Noto Foundation to M.I.
Footnotes
Conflict of Interest Statement
The Authors declare that there is no conflict of interest
References
- 1.Riccitelli G, Rocca MA, Pagani E, Rodegher ME, Rossi P, Falini A, et al. Cognitive impairment in multiple sclerosis is associated to different patterns of gray matter atrophy according to clinical phenotype. Human Brain Mapping. 2011 Oct;32(10):1535–1543. doi: 10.1002/hbm.21125. [DOI] [PMC free article] [PubMed] [Google Scholar]
- 2.Geurts JJG, Pouwels PJW, Uitdehaag BMJ, Polman CH, Barkhof F, Castelijns JA. Intracortical lesions in multiple sclerosis: improved detection with 3D double inversion-recovery MR imaging. Radiology. 2005 Jul;236(1):254–260. doi: 10.1148/radiol.2361040450. [DOI] [PubMed] [Google Scholar]
- 3.Poonawalla A, Datta S, Wolinsky J, Narayana P. Is 3D MPRAGE better than the combination DIR/PSIR for cortical lesion detection at 3T MRI? Multiple Sclerosis and related Disorders. 2014 doi: 10.1016/j.msard.2013.10.002. [DOI] [PubMed] [Google Scholar]
- 4.Calabrese M, Rinaldi F, Seppi D, Favaretto A, Squarcina L, Mattisi I, et al. Cortical diffusion-tensor imaging abnormalities in multiple sclerosis: a 3-year longitudinal study. Radiology. 2011 Dec;261(3):891–898. doi: 10.1148/radiol.11110195. [DOI] [PubMed] [Google Scholar]
- 5.Chen JT-H, Easley K, Schneider C, Nakamura K, Kidd GJ, Chang A, et al. Clinically feasible MTR is sensitive to cortical demyelination in MS. Neurology. 2013 Jan 15;80(3):246–252. doi: 10.1212/WNL.0b013e31827deb99. [DOI] [PMC free article] [PubMed] [Google Scholar]
- 6.Jensen JH, Helpern JA, Ramani A, Lu H, Kaczynski K. Diffusional kurtosis imaging: the quantification of non-gaussian water diffusion by means of magnetic resonance imaging. Magnetic Resonance in Medicine. 2005 Jun;53(6):1432–1440. doi: 10.1002/mrm.20508. [DOI] [PubMed] [Google Scholar]
- 7.Steven AJ, Zhuo J, Melhem ER. Diffusion kurtosis imaging: an emerging technique for evaluating the microstructural environment of the brain. AJR American Journal of Roentgenology. 2014 Jan;202(1):W26–33. doi: 10.2214/AJR.13.11365. [DOI] [PubMed] [Google Scholar]
- 8.Zhuo J, Xu S, Proctor JL, Mullins RJ, Simon JZ, Fiskum G, et al. Diffusion kurtosis as an in vivo imaging marker for reactive astrogliosis in traumatic brain injury. Neuroimage. 2012 Jan 1;59(1):11–11. doi: 10.1016/j.neuroimage.2011.07.050. [DOI] [PMC free article] [PubMed] [Google Scholar]
- 9.Van Cauter SS, Veraart JJ, Sijbers JJ, Peeters RRR, Himmelreich UU, De Keyzer FF, et al. Gliomas: diffusion kurtosis MR imaging in grading. Radiology. 2012 Apr 30;263(2):492–501. doi: 10.1148/radiol.12110927. [DOI] [PubMed] [Google Scholar]
- 10.Grossman EJ, Jensen JH, Babb JS, Chen Q, Tabesh A, Fieremans E, et al. Cognitive impairment in mild traumatic brain injury: a longitudinal diffusional kurtosis and perfusion imaging study. AJNR Am J Neuroradiol. 2013 May;34(5):951–7–S1–3. doi: 10.3174/ajnr.A3358. [DOI] [PMC free article] [PubMed] [Google Scholar]
- 11.Gong N-J, Wong C-S, Chan C-C, Leung L-M, Chu Y-C. Correlations between microstructural alterations and severity of cognitive deficiency in Alzheimer's disease and mild cognitive impairment: a diffusional kurtosis imaging study. Magn Reson Imaging. 2013 Jun;31(5):688–694. doi: 10.1016/j.mri.2012.10.027. [DOI] [PubMed] [Google Scholar]
- 12.Raz E, Bester M, Sigmund EE, Tabesh A, Babb JS, Jaggi H, et al. A better characterization of spinal cord damage in multiple sclerosis: a diffusional kurtosis imaging study. AJNR Am J Neuroradiol. 2013 Sep;34(9):1846–1852. doi: 10.3174/ajnr.A3512. [DOI] [PMC free article] [PubMed] [Google Scholar]
- 13.Falangola MF, Jensen JH, Babb JS, Hu C, Castellanos FX, Di Martino A, et al. Age related non-Gaussian diffusion patterns in the prefrontal brain. Journal of Magnetic Resonance Imaging : JMRI. 2008 Dec;28(6):1345–1350. doi: 10.1002/jmri.21604. [DOI] [PMC free article] [PubMed] [Google Scholar]
- 14.Polman CH, Reingold SC, Banwell B, Clanet M, Cohen JA, Filippi M, et al. Diagnostic criteria for multiple sclerosis: 2010 revisions to the McDonald criteria. Ann Neurol. 2011 Feb;69(2):292–302. doi: 10.1002/ana.22366. [DOI] [PMC free article] [PubMed] [Google Scholar]
- 15.Kurtzke JF. Rating neurologic impairment in multiple sclerosis: an expanded disability status scale (EDSS). Neurology. 1983 Nov;33(11):1444–1452. doi: 10.1212/wnl.33.11.1444. [DOI] [PubMed] [Google Scholar]
- 16.Lezak MD. Neuropsychological Assessment. Oxford University Press; 1995. [Google Scholar]
- 17.Smith SM, Zhang Y, Jenkinson M, Chen J, Matthews PM, Federico A, et al. Accurate, robust, and automated longitudinal and cross-sectional brain change analysis. Neuroimage. 2002 Sep 1;17(1):479–489. doi: 10.1006/nimg.2002.1040. [DOI] [PubMed] [Google Scholar]
- 18.Agosta F, Rovaris M, Pagani E, Sormani MP, Comi G, Filippi M. Magnetization transfer MRI metrics predict the accumulation of disability 8 years later in patients with multiple sclerosis. Brain. 2006 Oct;129:2620–2627. doi: 10.1093/brain/awl208. [DOI] [PubMed] [Google Scholar]
- 19.Jensen JH, Helpern JA. MRI quantification of non-Gaussian water diffusion by kurtosis analysis. NMR in biomedicine. 2010 Aug;23(7):698–710. doi: 10.1002/nbm.1518. [DOI] [PMC free article] [PubMed] [Google Scholar]
- 20.Filippi M, Preziosa P, Pagani E, Copetti M, Mesaros S, Colombo B, et al. Microstructural magnetic resonance imaging of cortical lesions in multiple sclerosis. Multiple Sclerosis. 2013 Apr;19(4):418–426. doi: 10.1177/1352458512457842. [DOI] [PubMed] [Google Scholar]
- 21.Poonawalla AH, Hasan KM, Gupta RK, Ahn CW, Nelson F, Wolinsky JS, et al. Diffusion-tensor MR imaging of cortical lesions in multiple sclerosis: initial findings. Radiology. 2008 Mar;246(3):880–886. doi: 10.1148/radiol.2463070486. [DOI] [PubMed] [Google Scholar]
- 22.Peterson JW, Bö L, Mörk S, Chang A, Trapp BD. Transected neurites, apoptotic neurons, and reduced inflammation in cortical multiple sclerosis lesions. Ann Neurol. 2001 Sep 1;50(3):389–400. doi: 10.1002/ana.1123. [DOI] [PubMed] [Google Scholar]
- 23.Färber K, Kettenmann H. Physiology of microglial cells. Brain Res Brain Res Rev. 2005 Apr;48(2):133–143. doi: 10.1016/j.brainresrev.2004.12.003. [DOI] [PubMed] [Google Scholar]
- 24.McKinstry RC, Mathur A, Miller JH, Ozcan A, Snyder AZ, Schefft GL, et al. Radial organization of developing preterm human cerebral cortex revealed by non invasive water diffusion anisotropy MRI. Cereb Cortex. 2002 Dec;12(12):1237–1243. doi: 10.1093/cercor/12.12.1237. [DOI] [PubMed] [Google Scholar]
- 25.Geurts JJG, Barkhof F. Grey matter pathology in multiple sclerosis. Lancet neurology. 2008 Sep;7(9):841–851. doi: 10.1016/S1474-4422(08)70191-1. [DOI] [PubMed] [Google Scholar]
- 26.Magliozzi R, Howell O, Vora A, Serafini B, Nicholas R, Puopolo M, et al. Meningeal B-cell follicles in secondary progressive multiple sclerosis associate with early onset of disease and severe cortical pathology. Brain. 2007 Apr;130(Pt 4):1089–1104. doi: 10.1093/brain/awm038. [DOI] [PubMed] [Google Scholar]
- 27.Kutzelnigg A, Lucchinetti CF, Stadelmann C, Bruck W, Rauschka H, Bergmann M, et al. Cortical demyelination and diffuse white matter injury in multiple sclerosis. Brain. 2005 Nov;128:2705–2712. doi: 10.1093/brain/awh641. [DOI] [PubMed] [Google Scholar]
- 28.Bø L, Geurts JJG, van der Valk P, Polman C, Barkhof F. Lack of correlation between cortical demyelination and white matter pathologic changes in multiple sclerosis. Arch Neurol. 2007 Jan;64(1):76–80. doi: 10.1001/archneur.64.1.76. [DOI] [PubMed] [Google Scholar]
- 29.De Stefano N, Matthews PM, Filippi M, Agosta F, De Luca M, Bartolozzi ML, et al. Evidence of early cortical atrophy in MS: relevance to white matter changes and disability. Neurology. 2003 Apr 8;60(7):1157–1162. doi: 10.1212/01.wnl.0000055926.69643.03. [DOI] [PubMed] [Google Scholar]
- 30.Bodini B, Khaleeli Z, Cercignani M, Miller DH, Thompson AJ, Ciccarelli O. Exploring the relationship between white matter and gray matter damage in early primary progressive multiple sclerosis: an in vivo study with TBSS and VBM. Human Brain Mapping. 2009 Sep 1;30(9):2852–2861. doi: 10.1002/hbm.20713. [DOI] [PMC free article] [PubMed] [Google Scholar]
- 31.Yang AW, Jensen JH, Hu CC, Tabesh A, Falangola MF, Helpern JA. Effect of cerebral spinal fluid suppression for diffusional kurtosis imaging. Journal of Magnetic Resonance Imaging : JMRI. 2013 Feb;37(2):365–371. doi: 10.1002/jmri.23840. [DOI] [PMC free article] [PubMed] [Google Scholar]
- 32.Calabrese M, Filippi M, Rovaris M, Bernardi V, Atzori M, Mattisi I, et al. Evidence for relative cortical sparing in benign multiple sclerosis: a longitudinal magnetic resonance imaging study. Mult Scler. 2009 Jan;15(1):36–41. doi: 10.1177/1352458508096686. [DOI] [PubMed] [Google Scholar]
- 33.Rao SM, Leo GJ, Bernardin L, Unverzagt F. Cognitive dysfunction in multiple sclerosis. I. Frequency, patterns, and prediction. Neurology. 1991 May;41(5):685–691. doi: 10.1212/wnl.41.5.685. [DOI] [PubMed] [Google Scholar]
- 34.Zwibel HL, Smrtka J. Improving quality of life in multiple sclerosis: an unmet need. Am J Manag Care. 2011 May;17(Suppl 5):S139–45. [PubMed] [Google Scholar]
- 35.Filippi M, Rocca MA, Benedict RHB, DeLuca J, Geurts JJG, Rombouts SARB, et al. The contribution of MRI in assessing cognitive impairment in multiple sclerosis. Neurology. 2010 Dec 7;75(23):2121–2128. doi: 10.1212/WNL.0b013e318200d768. [DOI] [PMC free article] [PubMed] [Google Scholar]
- 36.Inglese M, Adhya S, Johnson G, Babb JS, Miles L, Jaggi H, et al. Perfusion magnetic resonance imaging correlates of neuropsychological impairment in multiple sclerosis. J Cereb Blood Flow Metab. 2007 May 2;28(1):164–171. doi: 10.1038/sj.jcbfm.9600504. [DOI] [PMC free article] [PubMed] [Google Scholar]


