Abstract
Visual perception is an important component of environmental navigation. Previous research has revealed large individual differences in navigational strategies (i.e., the body's kinesthetic and embodied approach to movement) and the perception of environmental surfaces (via distance estimations), but little research has investigated the potential relationship between these sources of individual variation. An important navigational strategy is the interaction between reliance on visual cues and vestibular or proprioceptive cues. We investigated the role of this navigational strategy in the perception of environmental surfaces. The results supported three embodied evolutionary predictions: Individuals who were most reliant on visual context (1) overestimated vertical surfaces significantly more, and (2) feared falling significantly more, than did those who were least reliant on visual context; and (3) all individuals had roughly accurate horizontal distance estimates, regardless of their navigational strategy. These are among the first data to suggest that individual differences in perception are closely related to the individual differences in navigation that derive from navigational risks. Variable navigational strategies may reflect variable capacities to perceive and navigate the environment.
Keywords: Distance perception, Navigation, Height perception, Fear of falling, Evolved navigation theory
Visual perception and environmental navigation are essential psychological processes. In light of this broad importance, it is curious that individuals show large differences in perception and movement through the environment. For example, individuals vary greatly in their selective attention to imagery (Nouchi, 2011) and estimates of environmental surfaces (Jackson & Cormack, 2007, 2008; Stefanucci, Proffitt, Banton, & Epstein, 2005). There are also large differences in estimations of navigability (Jiang & Mark, 1994), use of postural stabilization strategies (Isableu, Ohlmann, Crémieux, & Amblard, 1998), and use of bodily mechanics for memory and learning about the environment (Bridgeman & Hoover, 2008; Witkin, Goodenough, & Karp, 1967). Despite the impact of these isolated individual differences in visual and navigational mechanisms, their relationship remains unclear.
A promising mechanism that integrates visual cues with perception and navigation of the environment is visual field dependence. Visual field dependence is the extent to which a person relies on visual context for actions such as navigation and physical interaction with the environment (Coelho & Wallis, 2010; Isableu et al., 1998). For example, an individual who relies most on visual context will perceptually orient with a tilted visual field, whereas an individual who incorporates other contextual and bodily cues orients with gravity (Oltman, 1968). Visual field dependence features large individual differences (Witkin et al., 1967). Recent research has suggested that individual differences within visual field dependence may reflect the prevalence of individual differences observed in navigational choices of the physical environment (Coelho & Wallis, 2010; Redfern, Yardley, & Bronstein, 2001). However, research has mainly focused on this construct in the context of education and learning, rather than for navigation and visual perception of the environment (Witkin, Moore, Goodenough, & Cox, 1977).
Vianin, Baumberger, and Flückiger (2004) found that the individuals who most relied on visual context in virtual reality could adapt to a viewpoint other than a natural point of view that they would likely encounter. In contrast, the individuals who least relied on visual cues were not very successful at adopting this noncentered point of view in virtual reality. This finding suggests that the former individuals did not utilize vestibular cues to the extent that such cues were utilized by the latter individuals. Vianin et al. suggested that the degree of realism and the extent to which participants felt immersed in the virtual environment might have departed significantly from the real environment. The lack of realism may have further influenced the difference seen between groups due to conflicting visual, vestibular, and proprioceptive cues. The horizontal distances featured in this study required less proprioceptive and vestibular information, and were correspondingly far closer to accuracy, than estimates of nonhorizontal surfaces (see Jackson & Cormack, 2007, 2008). Unfortunately, research has not yet demonstrated how visual field dependence interacts with the perception of real-world surfaces.
Some research has suggested that people overestimate distances on the basis of navigational risks, especially those inherent specifically in vertical surfaces (i.e., falling; Jackson, 2005; Jackson & Cormack, 2007). Correspondingly, previous research has shown much larger individual differences in vertical estimates than horizontal estimates (Jackson, 2005, 2009; Jackson & Cormack, 2007, 2008; Stefanucci et al., 2005; Teachman, Stefanucci, Clerkin, Cody, & Proffitt, 2008). People who, due to poor balance, are less capable of successfully navigating surfaces with falling risks should greatly emphasize alternative strategies, such as reliance on visual cues. Indeed, failing to use bodily kinestetics when interacting with vertical and sloped surfaces may lead to an overreliance on visual cues (Coelho & Wallis, 2010). Those who are most capable of successfully navigating vertical surfaces (i.e., good balance) would incur little risk, and thus would not need to respond as strongly to such situations with alternative navigation strategies. Those who most rely on visual cues should have even greater estimates of vertical surfaces than do those who least rely on visual cues when faced with surfaces containing falling risks. However, no research has linked individual differences in visual dependence and environmental vertical perception.
Due to the broad significance of the unknown relationship between individual differences in navigation and vision, we examined this interaction in the present study. We investigated the relationship between the perception of navigationally risky surfaces and individual differences in visual field dependence. We expected that the perception of risky (vertical) surfaces, but not of relatively safe horizontal surfaces, would reflect individual differences in reliance on visual context due to the increased variability of visual cues when interacting with vertical surfaces. To the extent that visual field dependence reflects a navigational adaptation, we also expected that it would reflect individual differences in fear of falling. Our predictions were as follows:
Individuals who are most reliant on visual context will have larger vertical estimates than will those who are least reliant.
Vertical surfaces pose large visually detectable falling risks and require more coordination of bodily kinesthetics than do horizontal surfaces (Coelho & Wallis, 2010; Jackson, 2009; Jackson & Cormack, 2008). Distance estimates of vertical surfaces should reflect these visual falling risks most in those who most rely on visual context.
-
2
All individuals will have roughly accurate horizontal estimates.
Horizontal surfaces do not pose a threat of falling and require less coordination of bodily kinesthetics during navigation than do vertical surfaces (Jackson & Cormack, 2008; Jackson & Willey, 2011). Individuals who are most reliant on visual context should thus estimate distances in a similar fashion to those least reliant on visual context.
-
3
Individuals who are most reliant on visual context will have a greater fear of falling than will those least reliant on visual context.
Individuals who are most reliant on visual context have less independent control of their postural sway when encountering vertical visual cues (Isableu et al., 1998) and may adopt affective strategies that both deter them from risky navigation and affect their visual perception of vertical surfaces (Jackson, 2009).
Method
Participants
A group of 33 participants with normal or corrected-to-normal vision completed a distance estimation task, two measures of reliance on visual context, a measure of the fear of falling, a demographic questionnaire, and other measures unrelated to the present study. All participants received course credit for participating, and our institutional review board approved of all procedures prior to the data collection. All research assistants (RAs) were blind to the hypotheses throughout the experiment.
Materials and procedures
Distance estimation
Participants estimated a vertical and a horizontal 5.64-m distance outdoors (see Fig. 1 for an illustrative schematic). The surfaces appeared on campus structures, and painted orange dots indicated the distance to be estimated. For the vertical estimate, participants looked over the side of a ledge (about four feet tall) and estimated the height of a concrete wall. For the horizontal estimate, participants estimated a distance on concrete ground located above the wall on a main landing of campus. Participants estimated via distance matching, in which they indicated a distance that looked equal to the estimated distance, as follows: Participants stood in the same position for both estimates, during which they instructed an RA to walk out away from them until the distance between the RA and the participant appeared to be equal to the estimated distance. The surfaces that participants estimated appeared at the same visual angle in relation to the surface on which participants gave their estimates. Furthermore, the surfaces estimated were never in the same visual field as the surface used for estimation. Researchers (Chapanis & Mankin, 1967; Higashiyama, 1996; Jackson & Cormack, 2007; Proffitt, 2006) commonly use distance-matching techniques in such instances for their ability to capture visual distance perception with measurable estimates. We alternated the order of the estimates between participants (17 participants estimated the vertical surface before the horizontal surface).
Fig. 1.
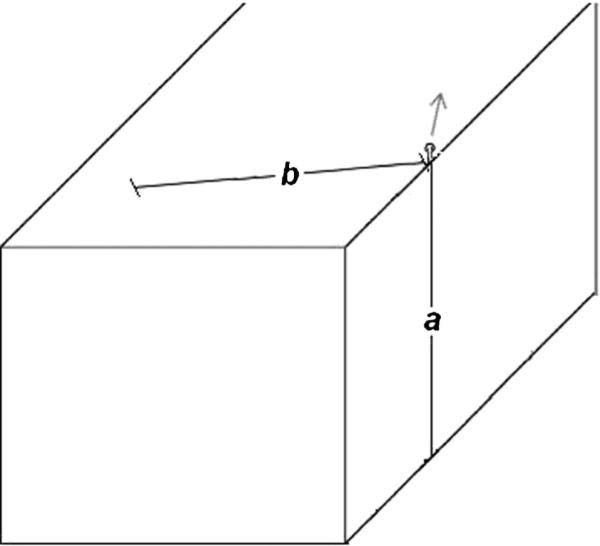
Distance estimation procedure (not to scale). The dotted icon represents the participant, a represents the estimated vertical distance, and b represents the estimated horizontal distance (both equal to 5.64 m). The arrow indicates the direction in which the research assistant walked for all estimates
Reliance on visual context
We administered two measures of dependence on visual context: the rod-and-frame test (RFT) and the Embedded Figures Test (EFT).
RFT
Our RFT apparatus resembled that of Oltman (1968). Each participant placed his or her head at the end of a large tube (see the top panel of Fig. 2) and looked down the length of a square frame toward a black rod (see the bottom panel of Fig. 2). Before each trial, an RA positioned the rod and frame, independently, at either –18 deg or +18 deg away from vertical, resulting in four trials. The participant then verbally instructed the RA to rotate the rod until the participant felt that the rod was vertical (i.e., parallel with gravity), whereas the frame remained tilted in the starting position (±18 degrees). In order to remove bodily cues, participants sat on a backless chair with a curtain over their heads, their hands in their laps, without resting their feet on the floor. The RFT was specifically developed to measure the visual field dependence construct, which the original author defined as a measure of individual differences in the “susceptibility to contextual influences” (Oltman, 1968). The task requires participants to disengage from the global visual influence of a tilted frame in order to align the rod to gravitational vertical. Those with greater error in their estimates of subjective vertical are thought to have greater reliance on visual information.
Fig. 2.
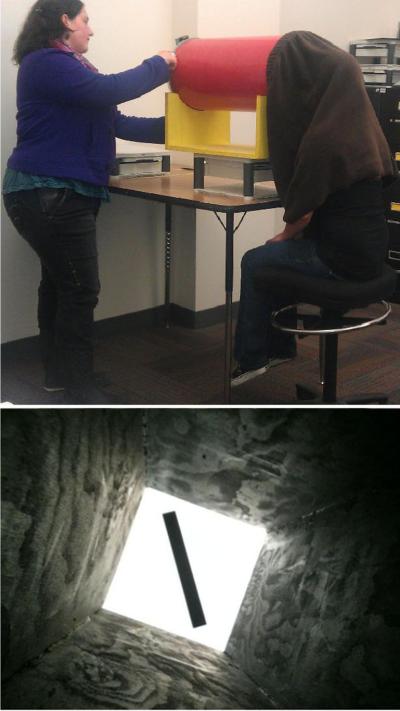
(Top) Third-person view of the rod-and-frame (RFT) apparatus. The research assistant (on the left) rotated the rod per the participant's verbal instructions until the participant estimated the rod to be vertical with respect to gravity. The participant (on the right) sat on a backless chair with a curtain over his or her head and viewed a tilted rod that appeared at the end of a tilted frame. (Bottom) Participant view from inside the RFT apparatus. In this particular trial, the rod is initially placed at –18 deg and the frame set is at +18 deg away from vertical. Participants also completed the following trials: rod +18 deg and frame +18 deg, rod – 18 deg and frame –18 deg, and rod +18 deg and frame –18 deg, for a total of four trials
We averaged the absolute values of participant errors across the four trials. For the RFT, we categorized individuals who averaged greater than 4 deg away from vertical as visually dependent, and those who averaged less than 4 deg from vertical as visually independent, resulting in 15 visually dependent participants (M ± 95 % CI = 8.08 ± 1.96 deg error) and 18 visually independent participants (2.13 ± 0.47 deg error).
EFT
For each EFT problem, participants had to locate and trace a target shape within a larger complex figure (taken from Witkin, Oltman, Raskin, & Karp, 1971; see Fig. 3 for a simplified example). The RA asked the participant to complete three practice problems before completing two 5-min test sections, each containing nine problems that increased in difficulty. For the EFT, we categorized individuals who correctly identified nine or fewer out of 18 correct target items as visually dependent and those with ten or more correct identifications as visually independent, as per the testing manual. This resulted in 18 visually dependent participants (M ± 95 % CI = 4.6 ± 1.3 items correct) and 15 visually independent participants (14.5 ± 1.2 items correct). The EFT was also specifically designed to measure the visual dependence construct and requires the participant to focus on local features of the visual scene and disengage from the global visual cues.
Fig. 3.

Noncopyrighted example of a typical embedded figures item. Participants searched for and traced a specified simple shape (right panel) within a more complex shape (left panel)
Although both tasks examine how global visual cues affect the performance of a local visual task, the RFT allows for the use of bodily orientation as an alternative strategy to vision for successfully portraying an accurate subjective vertical perception. In contrast, the EFT only requires participants to exclude extraneous visual information in order to find the target shape in 2-D space.
Composite
As in previous research, the RFT and EFT had moderately high convergent validity, r(31) = .687, p < .001. In addition to the individual analyses of RFT and EFT results outlined above, we also calculated z scores for each measure and averaged these standardized scores for each participant, so as to create a composite score. Using zero as the median, this calculation categorized 14 participants as visually dependent and 19 as visually independent.
Although we will focus on correlations between the variables in this study, we also split our sample on the basis of visual dependence parameters in order to compare our results to existing literature that has used such dichotomizations, usually around the median for the RFT or the midpoint of possible scores in the EFT (in this study, RFT median = 3.7 deg error, EFT median = 8 items correct). Since the dichotomization of variables is ultimately arbitrary, the results from the correlational analysis may better reflect the range and relationship between variables.
Fear of falling
Participants filled out the anxiety subset of Cohen's (1977) original acrophobia questionnaire in order to assess fear of falling. This was composed of 20 questions asking the participant to rate his or her level of anxiety on a 7-point scale (0 = not at all anxious, would not avoid situation and 6 = extremely anxious, would not do it under any circumstances) in response to varying scenarios in which they could fall. Example items on this questionnaire included assessing how they would feel standing on a ladder leaning against a house, second story and riding a Ferris wheel. We used the participant's total score on this measure, which could range from 0 to 120. The RA asked the participant to fill out the fear-of-falling questionnaire after all other tasks had been completed.
Results
Prediction 1
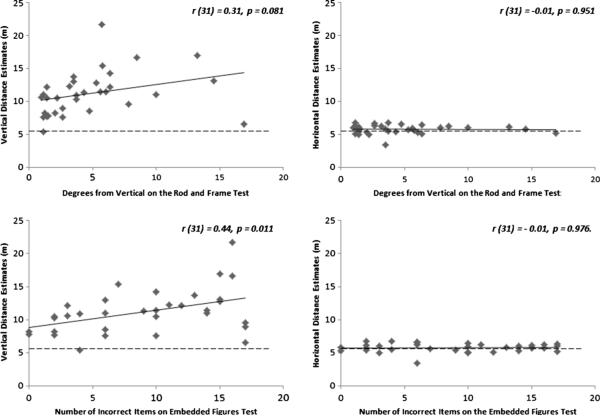
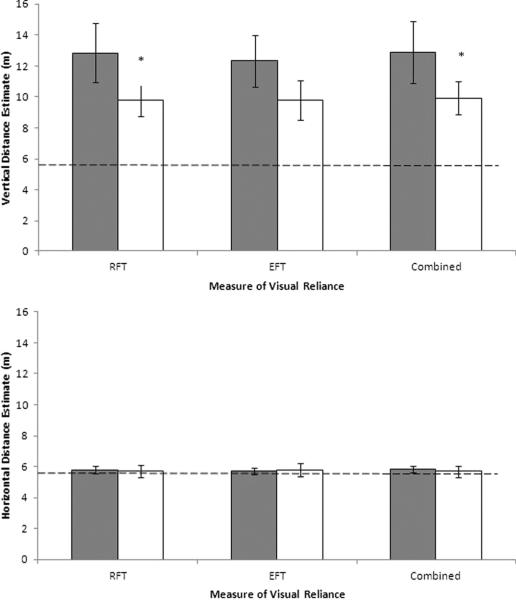
As predicted, participants with greater reliance on visual context had greater estimates of the vertical surface (see the left panels of Fig. 4 and the top panel of Fig. 5).
Fig. 4.
(Top left) Correlation between vertical distance estimates and visual reliance, based on the rod-and-frame test. (Bottom left) Correlation between vertical distance estimates and visual reliance, based on the Embedded Figures Test. The dashed line indicates the actual distance (5.64 m) on both graphs. (Top right) Correlation between horizontal distance estimates and visual reliance, based on the rod-and-frame test. (Bottom right) Correlation between horizontal distance estimates and visual reliance, based on the Embedded Figures Test. The dashed line indicates the actual distance (5.64 m) on both graphs
Fig. 5.
(Top) Relationship between mean estimates of a vertical surface and visual reliance across tasks. (Bottom) Relationship between mean estimates of a horizontal surface and visual reliance across tasks. The dashed lines indicate the actual distance (5.64 m), gray bars indicate visually dependent individuals, and white bars indicate visually independent individuals. Error bars represent 95 % confidence intervals about the means. *p < .05
RFT
The degree of error away from vertical on the RFT correlated positively with the vertical estimates, r(31) = .31, p = .081 (see the top left panel of Fig. 4). Visually dependent individuals according to the RFT made larger vertical estimates (M ± 95 % CI = 12.84 ± 2.08 m, n = 15) than did visually independent individuals (9.79 ± 1.12 m, n = 18), t(31) = –2.89, p = .007, d = 0.99 (see Fig. 5). Both visually dependent [t(14) = 7.42, p < .001] and visually independent [t(17) = 7.84, p < .001] individuals overestimated the vertical distance by 128 % and 74 %, respectively.
EFT
The number of items correct on the EFT correlated significantly with the vertical estimates, r(31) = –.44, p = .011 (see the bottom left panel of Fig. 4).Visually dependent individuals according to the EFT made larger vertical estimates (12.32 ± 1.78 m, n = 18) than did visually independent individuals (9.80 ± 1.41 m, n = 15), t(31) = 2.29, p = .029, d = 0.81 (see Fig. 5). Visually dependent [t(17) = 7.93, p < .001] and visually independent [t(14) = 6.34, p < .001] individuals overestimated the vertical distance by 119 % and 74 %, respectively.
Composite
The composite measure correlated significantly with the vertical estimates, r (31) = .41, p = .019. Visually dependent individuals according to the composite score made larger vertical estimates (12.87 ± 2.19 m, n = 14) than did visually independent individuals (9.93 ± 1.16 m, n = 19), t(31) = –2.73, p = .010, d = 0.93 (see the top panel of Fig. 5). Visually dependent [t(13) = 7.15, p < .001] and visually independent [t(18) = 7.79, p < .001] individuals overestimated the vertical distance by 128 % and 76 %, respectively.
The average estimate of the vertical surface across all participants (11.18 ± 1.19 m) was nearly twice the actual distance (5.64 m), t(32) = 8.94, p < .001. This replicated previous observations (Jackson & Cormack, 2007, 2008).
Prediction 2
As predicted, participants’ horizontal estimates did not differ from accuracy, regardless of reliance on visual context (see the right panels of Fig. 4 and the bottom panel of Fig. 5).
RFT
The RFT did not correlate with the horizontal estimates, r(31) = –.01, p = .951 (see the top right panel of Fig. 4). Visually dependent individuals according to the RFT estimated the horizontal surface (M ± 95 % CI = 5.79 ± 0.24 m, n = 15) similarly to the visually independent individuals (5.72 ± 0.40 m, n = 18), t(31) = –0.31, p = .755 (see the bottom panel of Fig. 5). Estimates from neither the visually dependent [t(14) = 1.34, p = .203] nor the visually independent [t(17) = 0.42, p = .683] individuals differed significantly from accuracy.
EFT
The EFT did not correlate with the horizontal estimates, r(31) = –.01, p = .976 (see the bottom right panel of Fig. 4). Visually dependent individuals according to the EFT estimated the horizontal surface (5.72 ± 0.23 m, n = 18) similarly to visually independent individuals (5.78 ± 0.47 m, n = 15), t(31) = 0.25, p = .806 (see the bottom panel of Fig. 5). The horizontal estimates from neither visually dependent [t(17) = 0.78, p = .449] nor visually independent [t(14) = 0.66, p = .522] individuals differed from accuracy.
Composite
The composite score did not correlate with the horizontal estimates, r(31) = .00, p = .986. Visually dependent individuals according to the composite score estimated the horizontal surface (5.81 ± 0.24 m, n = 14) similarly to visually independent individuals (5.70 ± 0.39 m, n = 19), t(31) = –0.471, p = .641 (see the bottom panel of Fig. 5). The estimates from neither visually dependent [t(13) = 1.58, p = .14] nor visually independent [t(18) = 0.36, p = .73] individuals differed significantly from accuracy.
The horizontal estimates across participants (5.75 ± 0.23 m) were indistinguishable from accuracy (5.64 m), t(32) = 0.97, p = .339. These estimates were significantly shorter than the estimates of the vertical surface, t(32) = 9.49, p < .001.
Prediction 3
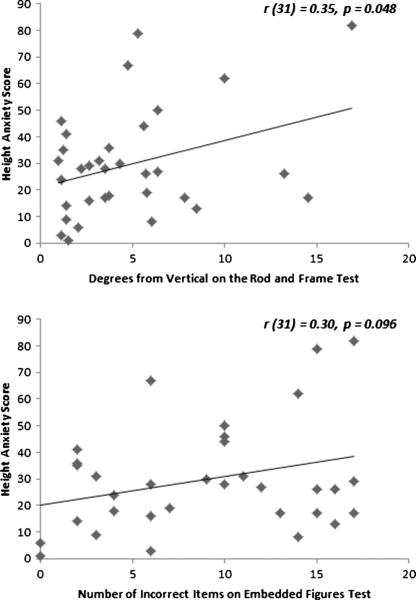
As predicted, participants who most relied on visual context had a greater fear of falling than did those who least relied on visual contexts (see Fig. 6).
Fig. 6.
(Top) Correlation between height anxiety scores and visual reliance, based on the rod-and-frame test. (Bottom) Correlation between height anxiety scores and visual reliance, based on the Embedded Figures Test
RFT
Errors on the RFTcorrelated with falling anxiety, r(31) = .35, p = .048 (see the top panel of Fig. 6).Visually dependent individuals according to the RFT had a greater fear of falling from vertical surfaces (M ± 95 % CI = 37.8 ± 12.44) than did visually independent individuals (22.94 ± 6.08), t(20.519) = –2.22, p = .048, d = 0.75 (corrected for unequal variances; see Fig. 7).
Fig. 7.
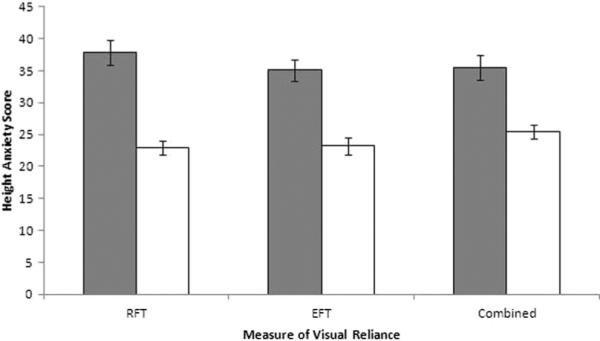
Relationship between average scores on the height anxiety questionnaire and visual reliance across tasks. Gray bars indicate visually dependent individuals, and white bars indicate visually independent individuals. Error bars represent 95 % confidence intervals about the means
EFT
The numbers of items incorrect on the EFT correlated positively, but not significantly, with falling anxiety, r(31) = .30, p = .096 (see the bottom panel of Fig. 6).Visually dependent individuals according to the EFT had higher acrophobia scores (35.11 ± 9.92) than did visually independent individuals (23.20 ± 8.76), but this did not reach the significance threshold, t(31) = –1.72, p = .094, d = 0.61 (see Fig. 7). These correlations were in the predicted direction, which is a meaningful difference, although they were marginally significant.
Composite
The composite scores correlated significantly with height anxiety, r(31) = .35, p = .046, such that composite scores above zero (visually dependent participants) corresponded with greater height anxiety. Visually dependent individuals according to the composite score had higher acrophobia scores (35.50 ± 24.22) than did visually independent individuals (25.42 ± 16.26), but this difference did not reach the significance threshold, t(31) = –1.43, p = .162, d = 0.49 (see Fig. 7).
The average fear-of-falling score across all participants was 29.70 ± 7.20 (95 % CI).
Discussion
As predicted, the data identified that individual differences in visual distance perception (as measured by distance estimates) meaningfully correspond with individual differences in navigational preference. We found that participants who most relied on visual information tended to have greater estimates of vertical surfaces, and greater fear of falling, than did those who least relied on visual information. Additionally, these differences in visual dependence did not reflect the relatively smaller individual differences found in horizontal estimates. These are among few data that have addressed the potentially embodied relationship between real-world navigation and specific visual cues.
These data importantly identify that navigational skills, such as bodily kinesthetics, may predict visual distance estimates. Some research has suggested that temporary navigational goals and hindrances may influence visual perception, implying that vision is only momentarily stable (Balcetis & Dunning, 2010; Proffitt, Stefanucci, Banton, & Epstein, 2003; however, others have failed to replicate similar effects—see Durgin et al., 2009; Hutchison & Loomis, 2006; Woods, Philbeck, & Danoff, 2009). In contrast, we suggest that individual differences in relatively stable navigational abilities that are dependent on environmental dangers likely predict distance perception. We believe that this interpretation coincides more closely with the original ideas of Gibson (1966), who highlighted the importance of navigational capabilities and multisensory integration, rather than higher-order intentional cognitive processes, on visual perception. Navigational sensory preferences may influence fear of falling in a similar and relatively independent manner. Future researchers should investigate how the malleability of such navigational skills (i.e., sudden or gradual developments or deficiencies) may affect an individual's visual perception. Further research will be needed to investigate the interaction between other bodily characteristics and the navigational strategies that may produce differences in distance estimates and navigation. Physical navigation mechanisms should reflect the trends investigated here, and we are actively investigating this area (Willey & Jackson, 2014).
Future directions in this research can use the present data as a foundation in order to more fully address specific areas within this domain. The present research required only a small sample size to address our original research question and to detect the relationship between visual and navigational individual differences. Furthermore, we did not recruit participants over a broad spectrum of acrophobia with controlled oversampling at the extreme ends of the acrophobia spectrum (e.g., Jackson, 2009). These two factors made it difficult to detect smaller effect sizes clearly, such as the significance of fear of heights and vertical estimation (Jackson, 2009; Teachman et al., 2008), although these data did specify this relationship.
In the present study, we defined distance perception as the combination of sensing the environment and processing that sensation to elicit judgments about environmental distances. Because of the inclusiveness of this definition, any observed effects within distance estimates could have been a result of any part of this judgment process, rather than of perception alone. Similarly, whereas we have characterized visual field dependence as a reliance on visual information, the tasks that we used may have reflected the judgment process rather than true perception of subjective vertical. Thus, other mechanisms that are a part of an individual's strategy to complete the RFT and EFT may likely contribute to their respective scores. Further research should be conducted to identify the exogenous mechanisms that contribute to performance on these tests.
Individuals utilize very different navigational strategies, and we found that one of these strategies had an important relationship with individual differences in visual distance estimation. The present study is among the first to examine the interaction within these sources of variation. We are now investigating other navigational mechanisms that may contribute to the perception of vertical distances and to visual field dependence in people with high risks of falling (Willey & Jackson, 2014). This research holds implications in broad areas of ubiquitous behaviors related to vision and navigation. Differences across individuals in these areas may help us understand the role of embodiment and the consequences that arise during environmental navigation.
Acknowledgments
This research was supported by the Research Initiative for Scientific Enhancement (GM-64783) administered at California State University San Marcos. Special thanks to Sarah Neal, Alexa Kliebenstien, Michael McCreary, and Yael Sela for assisting in various aspects of this research.
Contributor Information
Chéla R. Willey, Department of Psychology, University of California Los Angeles, 1285 Franz Hall, Los Angeles, CA 90095, USA
Russell E. Jackson, Department of Psychology and Communication Studies, University of Idaho, Moscow, ID, USA
References
- Balcetis E, Dunning D. Wishful seeing: More desired objects are seen as closer. Psychological Science. 2010;21:147–152. doi: 10.1177/0956797609356283. doi:10.1177/0956797609356283. [DOI] [PubMed] [Google Scholar]
- Bridgeman B, Hoover M. Processing spatial layout by perception and sensorimotor interaction. Quarterly Journal of Experimental Psychology. 2008;61:851–859. doi: 10.1080/17470210701623712. doi:10.1080/17470210701623712. [DOI] [PubMed] [Google Scholar]
- Chapanis A, Mankin DA. The vertical–horizontal illusion in a visually-rich environment. Perception & Psychophysics. 1967;2:249–255. doi:10.3758/BF03212474. [Google Scholar]
- Coelho CM, Wallis G. Deconstructing acrophobia: Physiological and psychological precursors to developing a fear of heights. Depression and Anxiety. 2010;27:864–870. doi: 10.1002/da.20698. doi:10.1002/da.20698. [DOI] [PubMed] [Google Scholar]
- Cohen DC. Comparison of self-report and overt-behavioral procedures for assessing acrophobia. Behavior Therapy. 1977;8:17–23. doi:10.1016/S0005-7894(77)80116-0. [Google Scholar]
- Durgin FH, Baird JA, Greenburg M, Russell R, Shaughnessy K, Waymouth S. Who is being deceived? The experimental demands of wearing a backpack. Psychonomic Bulletin & Review. 2009;16:964–969. doi: 10.3758/PBR.16.5.964. doi:10.3758/PBR.16.5.964. [DOI] [PubMed] [Google Scholar]
- Gibson JJ. The senses considered as perceptual systems. Houghton Mifflin; Boston, MA: 1966. [Google Scholar]
- Higashiyama A. Horizontal and vertical distance perception: The discorded-orientation theory. Perception & Psychophysics. 1996;58:259–270. doi: 10.3758/bf03211879. doi:10.3758/BF03211879. [DOI] [PubMed] [Google Scholar]
- Hutchison JJ, Loomis JM. Does energy expenditure affect the perception of egocentric distance? A failure to replicate Experiment 1 of Proffitt, Stefanucci, Banton, and Epstein (2003). Spanish Journal of Psychology. 2006;9:332–339. doi: 10.1017/s1138741600006235. [DOI] [PubMed] [Google Scholar]
- Isableu B, Ohlmann T, Crémieux J, Amblard B. How dynamic visual field dependence–independence interacts with the visual contribution to postural control. Human Movement Science. 1998;17:367–391. doi:10.1016/S0167-9457(98)00005-0. [Google Scholar]
- Jackson RE. Falling towards a theory of the vertical–horizontal illusion. In: Heft H, Marsh KL, editors. Studies in perception and action. VIII. Erlbaum; Mahwah, NJ: 2005. pp. 241–244. [Google Scholar]
- Jackson RE. Individual differences in distance perception. Proceedings of the Royal Society B. 2009;276:1665–1669. doi: 10.1098/rspb.2009.0004. doi:10.1098/ rspb.2009.0004. [DOI] [PMC free article] [PubMed] [Google Scholar]
- Jackson RE, Cormack LK. Evolved navigation theory and the descent illusion. Perception & Psychophysics. 2007;69:353–362. doi: 10.3758/bf03193756. [DOI] [PubMed] [Google Scholar]
- Jackson RE, Cormack LK. Evolved navigation theory and the environmental vertical illusion. Evolution and Human Behavior. 2008;29:299–304. doi:10.1016/j.evolhumbehav.2008.03.001. [Google Scholar]
- Jackson RE, Willey CR. Evolved navigation theory and horizontal visual illusions. Cognition. 2011;119:288–294. doi: 10.1016/j.cognition.2010.11.003. doi:10.1016/j.cognition.2010.11.003. [DOI] [PubMed] [Google Scholar]
- Jiang Y, Mark L. The effect of gap depth on the perception of whether a gap is crossable. Perception & Psychophysics. 1994;56:691–700. doi: 10.3758/bf03208362. [DOI] [PubMed] [Google Scholar]
- Nouchi R. Individual differences of visual imagery ability in the benefit of a survival judgment task. Japanese Psychological Research. 2011;53:319–326. doi:10.1111/j.1468-5884.2011.00479.x. [Google Scholar]
- Oltman PK. A portable rod-and-frame apparatus. Perceptual & Motor Skills. 1968;26:503–506. doi: 10.2466/pms.1968.26.2.503. [DOI] [PubMed] [Google Scholar]
- Proffitt DR. Embodied perception and the economy of action. Perspectives on Psychological Science. 2006;1:110–122. doi: 10.1111/j.1745-6916.2006.00008.x. doi:10.1111/j. 1745-6916.2006.00008.x. [DOI] [PubMed] [Google Scholar]
- Proffitt DR, Stefanucci J, Banton T, Epstein W. The role of effort in perceiving distance. Psychological Science. 2003;14:106–112. doi: 10.1111/1467-9280.t01-1-01427. [DOI] [PubMed] [Google Scholar]
- Redfern MS, Yardley L, Bronstein AM. Visual influences on balance. Journal of Anxiety Disorders. 2001;15:81–94. doi: 10.1016/s0887-6185(00)00043-8. doi:10.1016/ S0887-6185(00)00043-8. [DOI] [PubMed] [Google Scholar]
- Stefanucci J, Proffitt D, Banton T, Epstein W. Distances appear different on hills. Perception & Psychophysics. 2005;67:1052–1060. doi: 10.3758/bf03193631. [DOI] [PubMed] [Google Scholar]
- Teachman BA, Stefanucci JK, Clerkin EM, Cody MW, Proffitt DR. A new mode of fear expression: Perceptual bias in height fear. Emotion. 2008;8:296–301. doi: 10.1037/1528-3542.8.2.296. doi:10.1037/1528-3542.8. 2.296. [DOI] [PMC free article] [PubMed] [Google Scholar]
- Vianin P, Baumberger B, Flückiger M. Distance estimation in a dynamic simulated environment: A visual field dependence problem? Perception. 2004;33:561–568. doi: 10.1068/p5230. doi:10.1068/p5230. [DOI] [PubMed] [Google Scholar]
- Willey CR, Jackson RE. Ocular–vestibular mechanisms and environmental distance perception. Manuscript in preparation. 2014 [Google Scholar]
- Witkin HA, Goodenough DR, Karp SA. Stability of cognitive style from childhood to young adulthood. Journal of Personality and Social Psychology. 1967;7:291–300. doi: 10.1037/h0025070. [DOI] [PubMed] [Google Scholar]
- Witkin H, Oltman P, Raskin E, Karp S. A manual for the Embedded Figures Test. Consulting Psychologists Press; Palo Alto, CA: 1971. [Google Scholar]
- Witkin HA, Moore CA, Goodenough DR, Cox PW. Field-dependent and field-independent cognitive styles and their educational implications. Review of Educational Research. 1977;47:1–64. doi:10.3102/00346543047001001. [PubMed] [Google Scholar]
- Woods AJ, Philbeck JW, Danoff JV. The various perceptions of distance: An alternative view of how effort affects distance judgments. Journal of Experimental Psychology: Human Perception and Performance. 2009;35:1104–1117. doi: 10.1037/a0013622. doi:10.1037/a0013622. [DOI] [PMC free article] [PubMed] [Google Scholar]


