

Abstract
Of the eight metabotropic glutamate (mGlu) receptor subtypes, only mGlu7 is expressed presynaptically at the Schaffer collateral (SC)-CA1 synapse in the hippocampus in adult animals. Coupled with the inhibitory effects of Group III mGlu receptor agonists on transmission at this synapse, mGlu7 is thought to be the predominant autoreceptor responsible for regulating glutamate release at SC terminals. However, the lack of mGlu7-selective pharmacological tools has hampered direct testing of this hypothesis. We used a novel, selective mGlu7-negative allosteric modulator (NAM), ADX71743, and a newly described Group III mGlu receptor agonist, LSP4-2022, to elucidate the role of mGlu7 in modulating transmission in hippocampal area CA1 in adult C57BL/6J male mice. Interestingly, although mGlu7 agonists inhibit SC-CA1 EPSPs, we found no evidence for activation of mGlu7 by stimulation of SC-CA1 afferents. However, LSP4-2022 also reduced evoked monosynaptic IPSCs in CA1 pyramidal cells and, in contrast to its effect on SC-CA1 EPSPs, ADX71743 reversed the ability of high-frequency stimulation of SC afferents to reduce IPSC amplitudes. Furthermore, blockade of mGlu7 prevented induction of LTP at the SC-CA1 synapse and activation of mGlu7 potentiated submaximal LTP. Together, these data suggest that mGlu7 serves as a heteroreceptor at inhibitory synapses in area CA1 and that the predominant effect of activation of mGlu7 by stimulation of glutamatergic afferents is disinhibition, rather than reduced excitatory transmission. Furthermore, this mGlu7-mediated disinhibition is required for induction of LTP at the SC-CA1 synapse, suggesting that mGlu7 could serve as a novel therapeutic target for treatment of cognitive disorders.
Keywords: glutamate, hippocampus, LTP, mGlu, mGlu7, mGlur7
Introduction
Glutamate and GABA are the main excitatory and inhibitory neurotransmitters in the CNS. They act on two classes of receptors: fast-conduction ion channels and neuromodulatory 7 transmembrane receptors (7TMRs). For glutamate, these 7TMRs are termed metabotropic glutamate (mGlu) receptors and consist of eight members divided into three groups. Group I (mGlu1 and mGlu5), primarily mediate postsynaptic excitation. Group II (mGlu2 and mGlu3) are expressed presynaptically, postsynaptically, and on glial cells. Group III mGlu receptors include mGlu4, mGlu6, mGlu7, and mGlu8, which, with the exception of retinal mGlu6, are primarily expressed presynaptically and regulate neurotransmitter release (for review, see Niswender and Conn, 2010). Among the Group III mGlu receptors, mGlu7 has the lowest affinity for glutamate and is expressed on glutamatergic and GABAergic terminals (Bradley et al., 1996; Dalezios et al., 2002; Summa et al., 2013). mGlu7 is also widely expressed throughout the brain and is the most highly conserved of all the mGlu receptors, suggesting that its function is evolutionarily important (Bradley et al., 1996; Flor et al., 1997; Kinoshita et al., 1998).
mGlu7 appears to be the only Group III mGlu present at the SC-CA1 synapse in the hippocampus in adult animals (Baskys and Malenka, 1991; Kosinski et al., 1999; Ayala et al., 2008) where it is localized presynaptically in the cleft of glutamatergic SC terminals (Shigemoto et al., 1996) and perfectly poised to serve as an autoreceptor activated by synaptically released glutamate to inhibit neurotransmission. Consistent with this observation, agonists that activate mGlu7 inhibit transmission at the SC-CA1 synapse (Baskys and Malenka, 1991; Gereau and Conn, 1995; Ayala et al., 2008; Jalan-Sakrikar et al., 2014). Although activation of mGlu7 can reduce SC-CA1 transmission, previous studies have failed to provide clear evidence that mGlu7 serves as an autoreceptor that can be activated by glutamate released from SC terminals (Losonczy et al., 2003). This has largely been due to a lack of selective mGlu7 antagonists and reliance on the nonselective Group III orthosteric agonist, l-AP4 (Rosemond et al., 2004). Recently, two novel compounds have been developed that now allow for more focused studies regarding mGlu7. Although also a highly potent mGlu4 agonist, the compound LSP4-2022 is an agonist that is the most potent orthosteric activator of mGlu7 reported to date (Goudet et al., 2012). Additionally, the novel negative allosteric modulator (NAM), ADX71743, is a highly selective mGlu7 antagonist with both in vitro and in vivo efficacy (Kalinichev et al., 2013). Using these new tools, we provide evidence that stimulation of glutamatergic SC afferents does not activate mGlu7 on presynaptic glutamatergic terminals but predominantly activates mGlu7 heteroceptors to reduce GABA release from inhibitory synapses. Furthermore, mGlu7-dependent disinhibition is required for induction of LTP by high-frequency stimulation at this synapse. These findings challenge the prevailing view that mGlu7 is an autoreceptor at SC terminals and suggest that activation of mGlu7 by glutamatergic afferents may increase overall excitatory drive by reducing synaptic inhibition and enhancing LTP. These data add to an emerging interest in mGlu7 as a novel therapeutic target for enhancing cognition.
Materials and Methods
Drugs
(−)Bicuculline methobromide, d-AP5, and LY341495 were purchased from Abcam Biochemicals. CNQX was purchased from R&D Systems. LSP4-2022 was synthesized in-house according to previously published methodology (Selvam et al., 2010). (+)-6-(2,4-Dimethylphenyl)-2-ethyl-6,7-dihydrobenzo[d]oxazol-4(5H)-one (ADX71743) was synthesized in-house according to the methods below. All drugs used for electrophysiology experiments were diluted in aCSF.
Chemical synthesis
All NMR spectra were recorded on a 400 MHz FT-NMR DRX-400 FT-NMR spectrometer or 500 MHz Bruker DRX-500 FT-NMR spectrometer. 1H chemical shifts are reported in δ values in ppm downfield with the deuterated solvent as the internal standard. Data are reported as follows: chemical shift, multiplicity (s = singlet, d = doublet, t = triplet, q = quartet, br = broad, m = multiplet), integration, coupling constant (Hz). Low-resolution mass spectra were obtained on an Agilent 1200 series 6130 mass spectrometer with electrospray ionization. High-resolution mass spectra were recorded on a Waters Q-TOF API-US plus Acquity system with electrospray ionization. Analytical thin-layer chromatography was performed on EM Reagent 0.25 mm silica gel 60-F plates. Analytical HPLC was performed on an Agilent 1200 series with UV detection at 215 and 254 nm along with ELSD detection. LC/MS: (Phenomenex C18, 2.1 × 30 mm, 1.5 min gradient, 7% [0.1% TFA/CH3CN]: 93% [0.1% TFA/H2O] to 95% [0.1% TFA/CH3CN]). Preparative purification was performed on a custom HP1100 purification system (reference 16) with collection triggered by mass detection. Solvents for extraction, washing, and chromatography were HPLC grade. All reagents were purchased from Aldrich Chemical and were used without purification.

5-(2,4-Dimethylphenyl)cyclohexane-1,3-dione (2) (reference: WO 2011/062964 A1).
To a suspension of 2,4-dimethylbenzaldehyde, 90% technical grade (1) (5.96 g, 40.0 mmol, 1.0 Eq) in acetone (6.0 ml) and H2O (8 ml) was added a 1% aqueous solution of NaOH (5 ml) dropwise. The reaction was heated to 70°C. After 4 h at 70°C, the reaction was cooled to room temperature and poured into H2O (100 ml). The mixture was extracted with CHCl3 (3 × 50 ml), and the collected organic layers were concentrated.
To a solution of NaOMe (0.5 M in MeOH, 84 ml, 1.05 Eq) in MeOH (75 ml) was added diethyl malonate (6.2 ml, 40.0 mmol, 1.0 Eq), dropwise to maintain temperature between 15°C and 20°C. The previously isolated residue in MeOH (5 ml) was then added to the reaction at 60°C. The reaction was refluxed for 12 h. To the reaction was added a solution of NaOH (17.6 g) in H2O (70 ml). The reaction was heated to reflux for an additional hour. To the reaction was added concentrated HCl (15 ml) dropwise. After removing the reaction from the heat, EtOAc (200 ml) was added, and the organic layer was separated, washed with H2O (2 × 80 ml), Brine (50 ml), and dried (MgSO4). The mixture was filtered and the solvent removed under reduced pressure. The material was taken forward without further purification.
LCMS: RT = 0.873 min, >92% @ 215 nm, m/z = 217.0 [M + H]+.

5-(2,4-Dimethylphenyl)-2-propionylcyclohexane-1,3-dione (3) (reference: WO 2011/062964 A1).
To a solution of 5-(2,4-dimethylphenyl)cyclohexane-1,3-dione (2) (40.0 mmol, 1.0 Eq) in DCM (100 ml) at 0°C was added propionyl chloride (3.85 ml, 44.0 mmol, 1.1 Eq), followed by Et3N (6.7 ml, 48.0 mmol, 1.2 Eq). After 15 min, the cold bath was removed. Following 3 h at room temperature, the reaction was evaporated to dryness. The brown residue was redissolved in acetonitrile (50 ml), and acetone cyanohydrin (1 ml) and Et3N (1 ml) were added. After 18 h at room temperature, the reaction was concentrated and the residue was purified by reverse-phase HPLC (30%–90% acetonitrile: H2O w/ 0.1% TFA) to afford 3 (15%–20% over 3 steps).
LCMS: RT = 1.211 min, >98% @ 215 and 254 nm, m/z = 272.8 [M + H]+;

5-(2,4-Dimethylphenyl)-2-(1-(ethoxyamino)propylidene)cyclohexane-1,3-dione (4).
To a solution of 5-(2,4-dimethylphenyl)-2-propionylcyclohexane-1,3-dione (3) (210 mg, 0.77 mmol, 1.0 Eq) in EtOH (8 ml) at room temperature was added O-ethylhydroxylamine · HCl (79 mg, 0.81 mmol, 1.05 Eq), followed by NaOAc (70 mg, 0.85 mmol, 1.1 Eq). The heterogeneous yellow reaction was stirred for 16 h at room temperature. After the solvent was removed under vacuo, the residue was redissolved in DCM:H2O (100 ml, 1:1) and the organic layer was separated using a hydrophobic phase separator. After the solvent was removed, the material was taken on without further purification.
LCMS: RT = 1.269 min, >98% @ 215 and 254 nm, m/z = 315.8 [M + H]+.

6-(2,4-Dimethylphenyl)-2-ethyl-6,7-dihydrobenzo[d]oxazol-4(5H)-one (5).
A solution of 5-(2,4-dimethylphenyl)-2-(1-(ethoxyamino)propylidene)cyclohexane-1,3-dione (4) (0.77 mmol, 1.0 Eq) in EtOH (50 ml) was heated to reflux. After 24 h at reflux, the reaction was concentrated and the residue was purified by reverse-phase HPLC (20%–75% acetonitrile: H2O w/ 0.1% TFA) to afford 5 (96.4 mg, 47% over 2 steps).
LCMS: RT = 1.065 min, >98% @ 215 and 254 nm, m/z = 269.8 [M + H]+;
HRMS, calculated for C17H20NO2, 270.1494 [M + H]+, found 270.1496.
1H NMR (400 MHz, CDCl3): δ 7.20 (d, J = 7.9 Hz, 1H), 7.06 (d, J = 7.3 Hz, 1H), 7.06 (s, 1H), 3.83 (m, 1H), 3.15–3.05 (m, 2H), 2.88–2.80 (m, 3H), 2.72 (dd, J = 16.48, 3.8 Hz, 1H), 2.35 (s, 3H), 2.33 (s, 3H), 1.40 (t, J = 7.6 Hz, 3H).
13C NMR (125 MHz, CDCl3): δ 190.4, 166.4, 163.3, 137.0, 136.8, 135.2, 134.1, 131.8, 127.2, 125.4, 44.7, 36.7, 29.3, 21.7, 20.9, 19.3, 10.9.
Animals
All of the animals used in the present studies were group housed with food and water available ad libitum. Animals were kept under a 12 h light/dark cycle with lights on from 6:00 A.M.to 6:00 P.M. and were tested during the light phase. All of the experimental procedures were approved by the Vanderbilt University Animal Care and Use committee and followed the guidelines set forth by the Guide for the Care and Use of Laboratory Animals.
Extracellular field potential recordings
The 6-week-old male C57BL/6J mice (The Jackson Laboratory) were anesthetized with isofluorane, and the brains were removed and submerged in ice-cold cutting solution containing the following (in mm): 230 sucrose, 2.5 KCl, 8 MgSO4, 0.5 CaCl2, 1.25 NaH2PO4, 10 d-glucose, 26 NaHCO3. Coronal slices containing the hippocampus were cut at 400 μm using a Compresstome (Precisionary Instruments). Slices were transferred to a holding chamber containing NMDG-HEPES recovery solution (in mm) as follows: 93 NMDG, 2.5 KCl, 1.2 NaH2PO4, 30 NaHCO3, 20 HEPES, 25 d-glucose, 5 sodium ascorbate, 2 thiourea, 3 sodium pyruvate, 10 MgSO4, 0.5 CaCl2, pH 7.3, 305 mOsm, for 15 min at 32°C. Slices were then transferred to a room temperature holding chamber for at least 1 h containing aCSF (in mm) as follows: 126 NaCl, 1.25 NaH2PO4, 2.5 KCl, 10 d-glucose, 26 NaHCO3, 2 CaCl2, 1 MgSO4, supplemented with 600 μm sodium ascorbate for slice viability. All buffers were continuously bubbled with 95% O2/5% CO2. Subsequently, slices were transferred to a 32°C submersion recording chamber where they were perfused with aCSF at a rate of 2 ml/min. Borosilicate glass electrodes were pulled using a Flaming/Brown micropipette puller (Sutter Instruments) and had a resistance of 3–5 MΩ when filled with aCSF. Paired-pulse field EPSPs (fEPSPs) were recorded by from the stratum radiatum of CA1 and evoked by electrical stimulation (100 μs duration, every 20 s) delivered through a concentric bipolar stimulating electrode placed near the CA3-CA1 border. Input–output curves were generated for each slice, and the stimulation intensity was adjusted to 50%–60% of the maximum response. The effect of mGlu7 compounds on basal synaptic transmission was monitored by applying paired-pulse stimulation with an interpulse interval of 20 ms at 0.05 Hz. After a 10 min baseline recording, 30 μm LSP4-2022 was bath-applied for 10 min and then washed out for 15 min. Alternatively, after a 5 min baseline, slices were pretreated with 3 μm ADX71743 for 5 min before coapplication of 3 μm ADX71743 and 30 μm LSP4-2022 for 10 min, followed by a 15 min washout period. For frequency-dependent fEPSP experiments, two different stimulation paradigms were used. For both paradigms, slices were perfused with bicuculline for the entire experiment and a cut was made at the CA3-CA1 border to prevent recurrent burst firing. A train of 5 fEPSPs was evoked by stimulating 5 times at a frequency of 10 Hz with a 30 s intertrain interval (ITI). Baseline values were recorded for 10 min before the addition of ADX71743 for 10 min. Additionally, a second stimulation paradigm was also used in which a single pulse was delivered 550 ms before 10 pulses delivered at 100 Hz followed by a second test pulse 550 ms later. Baseline values were recorded for 10 min before addition of ADX71743 for 10 min. The slopes from two sequential sweeps were averaged. All slopes calculated were normalized to the average slope calculated during the predrug period (percentage of baseline).
Saturated LTP was induced by applying either two or three trains of 100 Hz stimulation (1 s duration, 20 s ITI) directly following a 10 min baseline. Threshold LTP was induced by applying one train of 100 Hz stimulation (1 s). LTP in the presence of bicuculline was performed in a modified aCSF (in mm) as follows: 126 NaCl, 1.25 NaH2PO4, 2.5 KCl, 10 d-glucose, 26 NaHCO3, 4 CaCl2, 4 MgSO4, and 20 μm bicuculline. A surgical cut was made between CA3 and CA1 regions to prevent epileptiform activity. Slices were perfused with 20 μm bicuculline, the fEPSP slope was allowed to stabilize before an input–output curve was generated, and the stimulation intensity was adjusted to 50% of the maximum fEPSP slope generated in bicuculline. For a subset of LTP experiments performed in the presence of bicuculline, an input–output curve was first generated in normal aCSF. Slices were then perfused with 20 μm bicuculline, and the stimulation intensity was adjusted so that the fEPSP slope used at baseline in bicuculline was the same as the 50% slope value calculated from the input–output curve in normal aCSF. Sampled data were analyzed offline using Clampfit 10.2 (Molecular Devices). The slopes from three sequential sweeps were averaged. All slopes calculated were normalized to the average slope calculated during the predrug period (percentage of baseline). Data were digitized using a Multiclamp 700B, Digidata 1322A, and pClamp 10 software (Molecular Devices). All drugs were diluted in aCSF and bath applied.
Whole-cell patch-clamp recordings
Whole-cell patch-clamp recordings were performed using coronal slices prepared from either 6-week-old male C57BL/6J mice (The Jackson Laboratory) or 6-week-old male mice expressing channelrhodopin 2 (B6;129S-Gt(ROSA)26Sortm32(CAG-COP4*H134R/EYFP)Hze/J; ChR2) in parvalbumin (PV)-expressing interneurons (B6;129P2-Pvalbtm1(cre)Arbr/J:PV). The PV-ChR2 mice were generated by crossing mice expressing cre recombinase under the control of a PV promoter with mice expressing conditional ChR2. All animals were anesthetized using a 0.2 ml intraperitoneal injection of ketamine/xylazine (20 mg/2 mg/ml) and then transcardially perfused with ice-cold cutting solution. Mice were then decapitated, and the brains were removed and submerged in ice-cold cutting solution as described above. Coronal slices containing the hippocampus were cut at 300 μm using a Compresstome (Precisionary Instruments). Slices were then transferred to a holding chamber containing a modified NMDG-HEPES recovery solution (in mm) as follows: 93 NMDG, 2.5 KCl, 1.2 NaH2PO4, 30 NaHCO3, 20 HEPES, 25 d-glucose, 5 sodium ascorbate, 2 thiourea, 3 sodium pyruvate, 10 MgSO4, 0.5 CaCl2, 12 N-acetyl-l-cysteine, pH 7.3, 305 mOsm, and recovered as described above. After the initial recovery period, slices were transferred to a holding chamber containing modified aCSF for at least 30 min (in mm) as follows: 126 NaCl, 1.25 NaH2PO4, 2.5 KCl, 10 d-glucose, 26 NaHCO3, 2 CaCl2, 1 MgSO4, supplemented with 600 μm sodium ascorbate for slice viability. Slices were perfused with 2 ml/min aCSF at 32°C in a submersion recording chamber. A cut was made at CA3 in all slices to prevent recurrent burst firing. Neurons were visualized with a 40× water-immersion lens with Hoffman modulation contrast optics coupled with an Olympus BX50WI upright microscope (Olympus). Borosilicate glass pipette electrodes were pulled as described above and had a resistance of 5–7 MΩ when filled with an intracellular solution containing (in mm) as follows: 120 CsMeSO3, 1 CaCl2, 1 MgSO4, 11 CsCl, 10 HEPES, 11 EGTA, 3 magnesium-ATP, 0.3 sodium-GTP, pH adjusted to 7.3 with CsOH; 290 mOsm.
Whole-cell recordings were made from visualized CA1 pyramidal neurons. IPSCs were evoked by placing a concentric bipolar stimulating electrode near the CA3-CA1 border. After formation of a whole-cell configuration, the membrane potential was voltage-clamped at 0 mV by injection of current. Evoked IPSCs (eIPSCs) were recorded by applying paired-pulse stimulations 200 ms apart with a 20 s intersweep interval for monosynaptic and polysynaptic experiments. Input–output curves were generated for each cell, and the stimulation intensity was adjusted to 50%–70% of the maximum response. For monosynaptic eIPSC experiments and frequency-dependent IPSC experiments, slices were continuously perfused with 20 μm CNQX and 50 μm d-AP5 to block glutamatergic transmission. For frequency-dependent IPSC experiments, two different stimulation paradigms were used that were similar to those used in the frequency-dependent fEPSP experiments. A train of 5 IPSCs was evoked by stimulating 5 times at a frequency of 5 Hz with a 30 s ITI. Baseline values were recorded for 5 min before the addition of either LY341495 or ADX71743 for 10 min. Additionally, a second stimulation paradigm was also used in which a single pulse was delivered 550 ms before 10 pulses delivered at 100 Hz followed by a second test pulse 550 ms later. Baseline values were recorded for 5 min before addition of either LY341495 or ADX71743 for 10 min. The amplitudes from two sequential sweeps were averaged. All amplitudes calculated were normalized to the average amplitude calculated during the predrug period (percentage of baseline).
Optogenetically induced IPSCs (oIPSCs) were generated using a CoolLED pE-100 illumination system (CoolLED) connected to an Olympus microscope (Olympus). A 473 nm blue light beam was applied to the slice through the 40× water-immersion objective as described previously (Pancani et al., 2014). Paired oIPSCs were generated by applying paired light pulse stimulation (1 ms in duration each spaced 700 ms apart). This stimulation paradigm was repeated every 20 s for the duration of the experiment. Input–output curves were generated for each cell, and the light intensity was adjusted to 50%–70% of the maximum response. The amplitudes from three sequential sweeps were averaged into minute bins. All data were digitized using a Multiclamp 700B, Digidata 1322A, and pClamp 10 software (Molecular Devices). All drugs were diluted in aCSF and bath applied.
Statistical analysis
All data shown represent mean ± SEM for at least three replicates. Statistical significance between groups was determined using unpaired or paired Student's t tests, one-way ANOVA (with Bonferroni's post-test), or two-way ANOVA (with Bonferroni's post-test) as specified in each figure legend.
Results
Stimulation of SC afferents does not induce feedback inhibition of transmission by activation of mGlu7
If mGlu7 functions as a classical autoreceptor to provide feedback inhibition of transmission at the SC-CA1 synapse, stimulation of SC afferents should induce an activity-dependent decrease in EPSP amplitude that can be reversed by mGlu7 antagonists. This phenomenon has been observed for Group II mGlu receptors in the dentate gyrus, where an mGlu2/3 antagonist inhibits an activity-dependent reduction in EPSC amplitude that is seen with stimulation of glutamatergic afferents (Doherty et al., 2004). We found that the new highly selective mGlu7 NAM, ADX71743 (3 μm) (Kalinichev et al., 2013), inhibits the ability of the recently described mGlu7 agonist, LSP4-2022 (30 μm) (Goudet et al., 2012), to reduce transmission at the SC-CA1 synapse, confirming a role for mGlu7 in reducing transmission with exogenous agonists (LSP4-2022 alone: 82.3 ± 1.7% of baseline, ADX71743 + LSP4-2022: 102.6 ± 2.2% of baseline, n = 4 slices) (Fig. 1A,B). Although LSP4-2022 activates mGlu4, mGlu7, and mGlu8, this compound is the most potent mGlu7 agonist to date and is the first mGlu7 agonist that provides selectivity for mGlu7 relative to mGlu8 (Goudet et al., 2012). Because mGlu4 is not present or active at SC-CA1 synapses (Ayala et al., 2008), LSP4-2022 provides an excellent tool to probe mGlu7 function at SC-CA1 synapses in adult animals. The concentrations of ADX71743 and LSP4-2022 used in these studies were based on extensive studies evaluating the potencies of these compounds mGlu7-expressing cell lines. These studies were consistent with published results and an established IC50 of 300 nm for ADX71743 (the IC50 determined using in-house cell lines is 300 ± 57 nm; data not shown) and an EC50 of 10 μm for LSP4-2022 at mGlu7, respectively (data not shown).
Figure 1.

mGlu7 does not act as an autoreceptor at SC-CA1 synapses. fEPSPs were recorded at SC-CA1 synapses after stimulation of axon fibers originating in CA3 with a bipolar electrode. ADX71743 or LSP4-2022 was bath applied. A, Application of 30 μm LSP4-2022 results in a depression of the fEPSP slope. Pretreatment with 3 μm ADX71743 for 5 min before coapplication of 3 μm ADX71743 and 30 μm LSP4-2022 prevented the effects of LSP4-2022 alone. Data are normalized to the averaged baseline fEPSP slope. Black lines indicate drug addition. B, Quantification of normalized fEPSP slopes during LSP4-2022 alone and coapplication of both LSP4-2022 and ADX71743. Values represent mean ± SEM. ***p = 0.004 (two-tailed Student's t test). n = 4 slices; df = 6. C, fEPSPs were recorded at SC-CA1 synapses in the presence of 20 μm bicuculline after stimulation of axon fibers from CA3 with a bipolar electrode. ADX71743 or DMSO vehicle was bath applied. Sample traces from an individual, representative experiment. Five fEPSPs were generated by applying 5 stimulations at 10 Hz. Black traces represent the fEPSPs stimulated during DMSO vehicle conditions. Red traces represent the fEPSPs stimulated during addition of 3 μm ADX71743. Calibration: 1 mV, 4 ms. D, Application of 3 μm ADX71743 did not significantly alter the slope of any of the fEPSPs in the train. Values represent mean ± SEM. p = 0.318 (two-way ANOVA). n = 5 slices; df = 1, 30. E, Sample traces from an individual, representative experiment. A stimulation paradigm was used in which an initial stimulation was applied. At 550 ms later, a burst of 10 stimulations delivered at 100 Hz was given, followed 550 ms later by a second single stimulation. Black traces represent the fEPSPs resulting during DMSO vehicle conditions. Red traces represent the fEPSPs during addition of 3 μm ADX71743. Calibration: 1 mV, 4 ms. F, Application of 3 μm ADX71743 did not significantly alter the calculated ratio between the two fEPSPs. Values represent mean ± SEM. p = 0.093 (two-tailed Student's t test). n = 5 slices; df = 4.
To test the hypothesis that mGlu7 serves as an autoreceptor at the SC-CA1 synapse, we measured fEPSPs in 6-week-old C57BL/6J male mice in response to repeated, low-frequency stimulation in the presence of bicuculline to isolate a pure glutamatergic component. We chose to study this phenomenon in adult animals because of the presence of a developmental switch that occurs between the expression of mGlu8 and mGlu7 at SC-CA1 synapses, where mGlu8 is the only Group III mGlu receptor expressed in neonatal animals and mGlu7 is the only one present in adult animals (Ayala et al., 2008). Initially, we applied 10 Hz stimulation for 0.5 s to induce a series of 5 fEPSPs. In contrast to previous studies of Group II mGlu receptors at the mossy fiber-hilar interneuron synapse (Doherty et al., 2004), there was a slight increase, rather than decrease, in fEPSP slope relative to the initial fEPSP with each subsequent stimulation in the train (Fig. 1C,D). To determine whether fEPSP slope was influenced by activation of mGlu7 during this train, 3 μm ADX71743 was bath applied after a 10 min baseline recording. We have determined that this concentration of ADX71743 completely blocks effects of LSP4-2022 on fEPSP slope at this synapse (Fig. 1A,B). Interestingly, ADX71743 had no significant effect on fEPSP slope for any of the five fEPSPs in the train (Fig. 1C,D, black traces vs red traces). These results indicate that mGlu7 does not function as a traditional autoreceptor to reduce presynaptic glutamate release using this low-frequency repeated stimulation paradigm.
The lack of effect of ADX71743 on fEPSP slope with low-frequency stimulation, coupled with mGlu7 's extremely low affinity for glutamate, raises the possibility that mGlu7 is only activated with stronger, higher frequency activity that may be necessary to release sufficient glutamate into the SC-CA1 synapse to activate mGlu7. If so, rather than being activated under conditions of normal low-frequency activity, mGlu7 could act as a brake to reduce glutamate release only under conditions of extremely high-frequency firing. To investigate this possibility, we used a stimulation paradigm that mimicked a classical high-frequency stimulation (HFS) paradigm used to induce LTP at the SC-CA1 synapse. For this high-frequency protocol, an initial fEPSP was generated 550 ms before a train of 10 pulses delivered at 100 Hz. At 550 ms after the last pulse of the train, a second fEPSP was generated as a test response. This paradigm was repeated every 30 s. We then measured the ratio between the slope of the initial fEPSP (stimulation 1) and the slope of the test response fEPSP (stimulation 2) (ratio calculated as fEPSP slope 2/fEPSP slope 1). We found no significant change in the ratio between the two fEPSP slopes in response to ADX71743 treatment (Fig. 1E,F, black traces vs red traces). These results suggest that mGlu7 does not act as an autoreceptor at SC-CA1 synapses to decrease glutamate release, even with this high-frequency stimulation protocol.
mGlu7 decreases monosynaptic GABAergic IPSCs
In addition to its localization on presynaptic terminals of excitatory synapses onto CA1 pyramidal cells, mGlu7 is also localized on presynaptic terminals of excitatory synapses onto inhibitory interneurons and on inhibitory GABAergic synapses onto pyramidal cells. If stimulation of SC afferents activates mGlu7 at either of these locations, this could reduce inhibitory transmission in CA1 pyramidal cells. Because of the lack of a clear role for mGlu7 as a classical autoreceptor at SC-CA1 pyramidal cell synapses, we evaluated the potential role of mGlu7 in regulating inhibitory transmission in area CA1. Whole-cell patch-clamp techniques were used to record eIPSCs in visually identified CA1 pyramidal cells from acute brain slices from 6-week-old C57BL/6J male mice. Studies of the effect of LSP4-2022 on paired-pulse IPSCs revealed that application of 30 μm LSP4-2022 caused a significant decrease in IPSC amplitude (80.2 ± 2.4% of baseline, n = 7 cells) (Fig. 2A,B,D) with a concomitant increase in the paired pulse ratio (PPR, 0.69 ± 0.04 in baseline vs 0.87 ± 0.06 in LSP4-2022) (Fig. 2F). The effect of LSP4-2022 on eIPSC amplitude washed out from most cells (5 of 7 cells) after 15 min of perfusion with normal aCSF (Fig. 2E). Additionally, LSP4-2022 had no effect on IPSC kinetic parameters, including the rise time or decay time of IPSCs (rise time: 9.23 ± 0.7 ms at baseline vs 9.32 ± 0.7 ms during LSP4-2022 addition; decay time: 129.4 ± 6.6 at baseline vs 116.9 ± 7.9 ms during LSP4-2022 addition) (Fig. 2C,G,H). Consistent with the hypothesis that the effects of LSP4-2022 are mediated by mGlu7, these effects were completely blocked by the mGlu7 NAM, ADX71743 (data not shown).
Figure 2.

Application of the mGlu7 agonist, LSP4-2022, decreases polysynaptic eIPSC amplitudes. eIPSCs were recorded in hippocampal CA1 pyramidal neurons after stimulation of axon fibers from CA3 with a bipolar electrode. A, Application of 30 μm LSP4-2022 caused a reduction in polysynaptic eIPSC amplitude over time. Data are normalized to the average baseline eIPSC amplitude. Solid black line indicates drug application. B, Sample traces from an individual, representative experiment. Paired pulses were applied 200 ms apart. 1 (black trace), Baseline polysynaptic eIPSC amplitudes were reduced by application of (2, red trace) 30 μm LSP4-2022. Calibration: 50 pA, 10 ms. C, Scaling of LSP4-2022 traces (red trace from B) to baseline traces indicates no changes in eIPSC kinetics. Calibration: 10 ms. D, Quantification of normalized polysynaptic eIPSC amplitudes during baseline and LSP4-2022 addition. Values represent mean ± SEM. ***p < 0.0001 (two-tailed Student's t test). n = 7 cells; df = 12. E, The effects of LSP4-2022 addition washed out in most cells (5 of 7 cells) after 15 min of perfusion with normal aCSF. Points connected by a line indicate values of eIPSC amplitudes for individual experiments during baseline, LSP4-2022 addition, and washout. F, Application of 30 μm LSP4-2022 resulted in a significant increase in the PPR. PPR was calculated as the amplitude of the second IPSC divided by the amplitude of the first IPSC. Points connected by a line indicate values for individual experiments. **p = 0.0074 (two-tailed paired t test). n = 7 cells; df = 6. G, H, Application of 30 μm LSP4-2022 had no effect on the rise time (G) or decay time (H) of polysynaptic eIPSCs (rise time: p = 0.98, two-tailed Student's t test, n = 7 cells, df = 12; decay time: p = 0.251, two-tailed Student's t test, n = 7, df = 12).
These results suggest that activation of mGlu7 decreases GABAergic synaptic transmission in CA1 pyramidal cells and that this is likely mediated by a presynaptic mechanism. However, these studies do not provide insights as to whether mGlu7 reduces inhibitory transmission by actions at excitatory synapses onto inhibitory interneurons or direct inhibition of GABA release at inhibitory synapses onto pyramidal cells. To determine whether mGlu7 functions presynaptically on GABAergic terminals, we isolated monosynaptic IPSCs by incubating slices with a combination of CNQX and d-AP5, antagonists of AMPA receptor and NMDA receptors, respectively, to block glutamatergic transmission. This experimental paradigm allowed us to remove the contribution of any mGlu7 expressed presynaptically on glutamatergic terminals synapsing onto interneurons and allowed us to isolate monosynaptic IPSCs to evaluate effects of mGlu7 expressed on GABAergic interneurons. Slices were pretreated with a combination of 20 μm CNQX and 50 μm d-AP5 for several minutes until stable monosynaptic IPSCs were obtained. These IPSCs could be completely blocked by the application of 20 μm bicuculline (data not shown). The 30 μm LSP4-2022 was then perfused for 10 min onto the slice, which resulted in a significant decrease in IPSC amplitude (78.4 ± 1.8% of baseline, n = 7 cells) (Fig. 3A,B,D) and also resulted in a significant increase in PPR (0.6 ± 0.02 during baseline vs 0.7 ± 0.02 in LSP4-2022) (Fig. 3F). The effect of LSP4-2022 on eIPSC amplitude washed out from most cells (5 of 7 cells) after 15 min of perfusion with normal aCSF (Fig. 3E). The kinetic parameters of the IPSCs did not significantly change with application of LSP4-2022 (rise time: 7.9 ± 1.2 ms at baseline vs 7.8 ± 1.0 ms during LSP4-2022 addition; decay time: 111.6 ± 10.2 ms at baseline vs 107.9 ± 13.1 ms during LSP4-2022 addition) (Fig. 3C,G,H). These results support previous anatomical studies suggesting that mGlu7 is expressed presynaptically on GABAergic terminals (Kinoshita et al., 1998), and demonstrate that LSP4-2022 can activate mGlu7 and decrease GABA release from these cells.
Figure 3.

Application of 30 μm LSP4-2022 decreases monosynaptic eIPSCs. A, The 20 μm CNQX and 50 μm d-AP5 were bath applied (large dashed line) before application of 30 μm LSP4-2022 (black solid line) to isolate monosynaptic eIPSCs. B, Sample traces from individual, representative experiment. Paired pulses were applied 200 ms apart. 1 (black trace), Baseline monosynaptic eIPSC amplitudes were reduced by application of (2, red trace) 30 μm LSP4-2022. Calibration: 50 pA, 10 ms. C, Scaling of LSP4-2022 trace (red trace from B) to baseline traces indicates no change in eIPSC kinetics. Calibration: 10 ms. D, Quantification of normalized monosynaptic eIPSC amplitudes during baseline and LSP4-2022 addition. Values represent mean ± SEM. ***p = 0.001 (two-tailed Student's t test). n = 7 cells; df = 12. E, The effects of LSP4-2022 addition washed out in most cells (5 of 7 cells) after 15 min of perfusion with normal aCSF. Points connected by a line indicate values of eIPSC amplitudes for individual experiments during baseline, LSP4-2022 addition, and washout. F, Application of 30 μm LSP4-2022 resulted in a significant increase in the PPR. Points connected by a line indicate values for individual experiments. ***p = 0.0004 (two-tailed paired t test). n = 7 cells; df = 6. G, H, Application of 30 μm LSP4-2022 had no effect on rise time (G) or decay time (H) of monosynaptic eIPSCs (rise time: p = 0.94, two-tailed Student's t test, n = 7, df = 12; decay time: p = 0.82, two-tailed Student's t test, n = 7, df = 12).
The ability of LSP4-2022 to reduce eIPSC amplitude even when glutamatergic transmission is blocked strongly suggests that the primary location of mGlu7 is directly on GABAergic terminals. However, although the previous experimental setup eliminates the contribution of mGlu7 expressed in glutamatergic terminals, it does not prevent the effects of neuromodulators that may be released in response to electrical stimulation. To remove the contribution of neuromodulators, such as norepinephrine, acetylcholine, serotonin, BDNF and others, and to further isolate only mGlu7 expressed on interneurons, we used mice that expressed channel rhodopsin 2 (ChR2) in parvalbumin (PV)-expressing interneurons, as PV interneurons represent the largest populations of interneurons in this area (Kawaguchi et al., 1987; Klausberger et al., 2005). This allowed us to directly activate only interneurons without the coincident release of other neuromodulatory factors. Paired optically activated IPSCs (oIPSCs) were recorded from CA1 pyramidal cells and evoked using 473 nm light. After a 10 min baseline period, 30 μm LSP4-2022 was perfused for an additional 10 min, which resulted in a significant decrease in oIPSC amplitude (76 ± 65.1% of baseline, n = 6 cells) (Fig. 4A,B,D) and also resulted in a significant increase in PPR (0.6 ± 0.02 during baseline vs 0.73 ± 0.03 in LSP4-2022) (Fig. 4F). The effect of LSP4-2022 on oIPSC amplitude washed out from most cells (4 of 6 cells) after 15 min of perfusion with normal aCSF (Fig. 4E). The kinetic parameters of the IPSCs did not significantly change with application of LSP4-2022 (rise time: 3.2 ± 0.5 ms during baseline vs 3.0 ± 0.6 ms in LSP4-2022; decay time: 205.4 ± 26.6 ms during baseline vs 182.7 ± 18.2 ms in LSP4-2022) (Fig. 4C,G,H). These results further support the hypothesis that mGlu7 can decrease GABA release in a monosynaptic fashion, particularly without the contribution of other neuromodulators.
Figure 4.

Application of 30 μm LSP4-2022 decreases GABAergic interneuron-specific optically induced IPSCs. Paired oIPSCs were delivered by stimulating using 473 nm blue light. A, Application of 30 μm LSP4-2022 (black line) resulted in a decrease of oIPSC amplitude over time. B, Sample traces from an individual, representative experiment. Paired stimulations were applied 700 ms apart. 1 (black trace), Baseline oIPSC amplitudes were reduced by (2, red trace) 30 μm LSP4-2022. Calibration: 400 pA, 60 ms. C, Scaling of LSP4-2022 trace (red trace from B) to baseline traces indicated no change in oIPSC kinetics. Calibration: 60 ms. D, Quantification of normalized oIPSC amplitudes during baseline and LSP4-2022 addition. Values represent mean ± SEM. ***p = 0.0006 (two-tailed Student's t test). n = 6 cells; df = 10. E, The effects of LSP4-2022 addition washed out in most cells (4 of 6 cells) after 15 min of perfusion with normal aCSF. Points connected by a line indicate values of oIPSC amplitudes for individual experiments during baseline, LSP4-2022 addition, and washout. F, Application of 30 μm LSP4-2022 resulted in a significant increase in the PPR. Points connected by a line indicate values for individual experiments. **p = 0.005 (two-tailed paired t test). n = 6 cells; df = 5. G, H, Application of 30 μm LSP4-2022 had no effect on rise time (G) or decay time (H) of oIPSCs (rise time: p = 0.75, two-tailed Student's t test, n = 6 cells, df = 10; decay time: p = 0.49, two-tailed Student's t test, n = 6 cells, df = 10).
High-frequency stimulation of SC afferents induces an mGlu7-dependent decrease in monosynaptic GABAergic IPSCs
Our results and previous studies (Losonczy et al., 2003) suggest that mGlu7 may not act as a traditional autoreceptor to decrease glutamate release in response to synaptic activation at glutamatergic synapses in area CA1. It is possible that a more prominent role of mGlu7 in responding to activation of SC afferents is as a heteroceptor, where it could decrease GABA release in response to activation of SC afferents. If so, this could lead to a net increase, rather than decrease, in excitatory drive through area CA1. To assess the role of mGlu7 heteroceptors in modulating responses to activation of SC afferents, we measured the effects of low-frequency and high-frequency stimulation on monosynaptic IPSCs in CA1 pyramidal cells. Initially, we measured IPSCs evoked by low-frequency stimulation (5 Hz stimulation for 1 s). Using this stimulation paradigm, we observed a decrease in IPSC amplitude with each subsequent stimulus (Fig. 5A,B, black line). To determine whether activation of mGlu7 contributes to this activity-dependent depression of IPSCs, we established a baseline response for 5 min and then applied ADX71743 (3 μm) for 10 min and measured the change in amplitude for each IPSC as a percentage of the first IPSC amplitude during the baseline period. ADX71743 did not induce a significant change in any of the IPSCs in the train (Fig. 5A,B, black line vs red line), suggesting that mGlu7 activation does not contribute to activity-dependent depression of IPSCs with low-frequency stimulation. We then used a high-frequency stimulation paradigm, similar to the one used to investigate the effect of mGlu7 antagonists on fEPSPs. As in studies of excitatory transmission, an initial IPSC was generated 550 ms before a train of 10 pulses delivered at 100 Hz, repeated every 30 s. At 550 ms later, a second IPSC was generated as a test response (Fig. 5C). Under baseline conditions, the test response elicited 550 ms after the 100 Hz train was smaller in amplitude than the first IPSC induced before 100 Hz stimulation. Interestingly, application of ADX71743 (3 μm) reversed the ability of the stimulus train to reduce IPSC amplitude and increased the ratio between the amplitude of the second IPSC and the first IPSC (ratio calculated as IPSC amplitude 2/IPSC amplitude 1) (ratio = 0.58 ± 0.03 at baseline vs 0.65 ± 0.02 during ADX71743 addition) (Fig. 5D,E). To confirm the effects of ADX71743, we repeated these experiments using the nonselective but well-characterized orthosteric mGlu receptor antagonist, LY341495, which has an IC50 at mGlu7 of ∼1 μm (Kingston et al., 1998). Consistent with the effects of ADX71743, 100 μm LY341495 had no effect on IPSCs using the low-frequency (0.5 Hz) protocol (Fig. 5F,G). However, 100 μm LY341495 had an effect that was similar to that of ADX71743 on responses to 100 Hz (Fig. 5H,I; ratio = 0.59 ± 0.03 at baseline vs 0.68 ± 0.03 during LY341495 addition). To confirm that the effect on the ratio was drug-induced and not due to current run-down, we performed several experiments in which the stimulation protocol was run for 15 min with no drug addition, and observed no significant change in the ratio (data not shown). Collectively, these results suggest that mGlu7 decreases GABA release in a frequency-dependent manner and that, under HFS conditions, mGlu7 activation reduces GABA release.
Figure 5.

mGlu7 reduces GABA release in a frequency-dependent manner. A, Sample traces from an individual, representative experiment. Application of 3 μm ADX71743 (red line) has no effect on any of the IPSC amplitudes in the train. Calibration: 200 pA, 200 ms. B, Normalized amplitude of each IPSC represented as percentage of the baseline first IPSC amplitude with or without 3 μm ADX71743 (p = 0.299, two-way ANOVA). n = 5; df = 1, 32. C, Schematic of stimulation paradigm. An initial stimulation was applied 550 ms before 10 stimulations at 100 Hz. At 550 ms later, a second test stimulation was applied. D, Sample traces from an individual, representative experiment with ADX71743. First IPSC represents stimulation 1 from schematic, and second IPSC represents stimulation 2. During vehicle conditions, there is a reduction in the second IPSC amplitude. Application of 3 μm ADX71743 results in an increase in the second IPSC amplitude after the 100 Hz stimulation. Calibration: 100 pA, 20 ms. E, Application of 3 μm ADX71743 results in a significant increase in the ratio of the two IPSCs. **p = 0.0021 (two-tailed paired t test). n = 7; df = 6. F, A train of 5 IPSCs was evoked by stimulating CA3 axon fibers with a bipolar electrode at a frequency of 5 Hz. Sample traces from an individual, representative experiment. Application of 100 μm LY341495 (red line) had no effect on any of the IPSC amplitudes in the train. Calibration: 200 pA, 200 ms. G, Normalized amplitude of each IPSC represented as percentage of the baseline first IPSC amplitude with or without 100 μm LY341495 (p = 0.504, two-way ANOVA). n = 3 cells; df = 1, 20. H, Sample traces from an individual, representative experiment with LY341495. Application of 100 μm LY341495 resulted in an increase in the second IPSC after the 100 Hz stimulation. Calibration: 100 pA, 10 ms. I, Application of 100 μm LY341495 resulted in a significant increase in the ratio of the two IPSCs. The ratio was calculated as the amplitude of stimulation 2 IPSC divided by the amplitude of stimulation 1 IPSC. ***p = 0.0001 (two-tailed paired t test). n = 6; df = 5.
mGlu7 activation is necessary for induction of LTP at SC-CA1 synapses in the hippocampus
HFS at the SC-CA1 synapse results in an LTP that has previously been shown to be mediated by NMDA receptors (Morris et al., 1986). Induction of NMDA receptor (NMDAR)-dependent LTP at the SC-CA1 pyramidal cell synapses requires coincident release of glutamate from presynaptic SC terminals and depolarization of CA1 pyramidal cells to allow release of voltage-dependent block of NMDARs by magnesium (Granger and Nicoll, 2014). Activation of inhibitory interneurons in area CA1 by SC activation can oppose pyramidal cell depolarization required for induction of LTP, and GABAA receptor antagonists facilitate LTP induction (Debray et al., 1997). Because mGlu7 decreases GABA release under HFS conditions, we sought to determine whether this mechanism played a role in the induction of LTP. To probe this possibility, HFS was applied and fEPSPs were recorded in area CA1 of the hippocampus. A saturating form of LTP was induced by applying 2 trains of HFS (100 Hz, 1 s in duration, 20 s ITI). Consistent with previous studies (Harris and Teyler, 1984; Collingridge et al., 1988), this resulted in a robust LTP assessed 1 h after HFS (141.9 ± 7.1% of baseline). Pretreatment of slices with the mGlu7 NAM, ADX71743 (3 μm), for 20 min before HFS resulted in an almost complete blockade of LTP induction (100.6 ± 1.4% of baseline) (Fig. 6A,B). As ADX71743 is a newly described mGlu7 NAM, we performed the same experiment in the presence of 300 nm ADX71743, which is a concentration that should no longer fully block mGlu7 in slices. Pretreatment with 300 nm ADX71743 for 20 min before HFS was no longer sufficient to block LTP (control: 143.2 ± 6.4% of baseline, 300 nm ADX71743: 147.1 ± 6.4% of baseline) (Fig. 6A,B). Furthermore, pretreatment with either 10 or 100 μm LY341495, two concentrations well above the IC50 at mGlu7, for 20 min before HFS stimulation resulted in a similar blockade of LTP (100.2 ± 2.7% of baseline for 10 μm LY341495, 106.9 ± 5.8% of baseline for 100 μm LY341495) (Fig. 6C,D). Pretreatment with 100 nm LY341495, a concentration well below the IC50 at mGlu7 but one that blocks the Group II mGlu receptors, did not result in a significant blockade of LTP (134.6 ± 19.6% of baseline) (Fig. 6C,D). To determine whether there was an effect of either ADX71743 or LY341495 on any of the responses generated during the HFS, we measured the slopes of the fEPSPs generated during the first train of 100 Hz stimulation. We observed no significant change in the slope of the fEPSP generated after the first stimulation in the train with addition of either 3 μm ADX71743 or 10 μm LY341495, indicating that mGlu7 is not active before the HFS (control: 100.0 ± 14.8%, ADX71743: 114.7 ± 29.6%, LY341495: 104.4 ± 20.5% of control first fEPSP slope) (Fig. 6E–G). We chose to investigate the 10 μm LY341495 concentration because this was the lowest concentration sufficient to block LTP. Examining the fEPSP slopes at stimulus 20, 40, 60, 80, or 100 within the train, we observed a significant reduction in the fEPSP slopes at stimulus 20 and 40 compared with the slope of the first fEPSP with ADX71743 or LY341495 treatment, indicating that the responses decayed faster when mGlu7 was blocked (stimulus 20: control: 18.7 ± 2.3%, ADX71743: 9.7 ± 2.5%, LY341495: 7.0 ± 2.1% of first fEPSP slope, stimulus 40: control: 12.6 ± 1.9%, ADX71743: 4.6 ± 2.1%, LY341495: 1.8 ± 1.6% of first fEPSP slope) (Fig. 6H). These results are consistent with our finding described above (Fig. 5) and indicate that mGlu7 activation during the HFS, which leads to an increase in excitation of CA1 cells resulting from mGlu7-mediated disinhibition, is required for induction of LTP at SC-CA1 synapses.
Figure 6.

Antagonism of mGlu7 impairs LTP at SC-CA1 synapses. fEPSPs were recorded at SC-CA1 synapses after stimulation of the axon fibers coming from CA3 with a bipolar electrode. All compounds were bath applied. A, Application of the mGlu7 NAM, ADX71743 (3 μm), for 20 min before 100 Hz HFS (indicated by arrow) impairs LTP. Application of a lower concentration of ADX71743 (300 nm) is no longer sufficient to block LTP. B, Quantification of LTP was determined by averaging the values during the last 5 min of recording (shaded gray area in A). Values represent mean ± SEM (overall: p = 0.0004, one-way ANOVA with Bonferonni's post-test, control vs 3 μm ADX71743). **p < 0.01. n = 3 or 4; df = 2, 10. C, Application of high concentrations of LY341495 (10 and 100 μm) is sufficient to impair LTP, whereas a low concentration (100 nm) does not. D, Quantification of LTP was determined by averaging the values during the last 5 min of recording (shaded gray area in C). Values represent mean ± SEM (overall: p = 0.003, one-way ANOVA with Bonferonni's post-test, control vs 10 μm LY341495). **p < 0.01 (control vs 100 μm LY341495). *p < 0.05. n = 3 or 4; df = 3, 9. E, Representative trace of the first train of 100 Hz stimulation in control conditions. Dashed box represents the area that is magnified in F. F, Sample traces of the first 20 stimulations of the HFS. Application of either 3 μm ADX71743 or 10 μm LY341495 results in a faster decay in the fEPSP response throughout the train. Calibration: 10 ms. G, Quantification of the fEPSP generated after the first stimulation within the train. There was no significant effect of either ADX71743 or LY341495 on the slope of the first response. Values represent mean ± SEM (p = 0.8930, one-way ANOVA with Bonferonni's post-test). n = 3 or 4; df = 2, 9. H, Application of either ADX71743 or LY341495 resulted in a significant reduction in the fEPSP slope at both 20 and 40 stimulations within the HFS train. Values represent mean ± SEM (overall: p = 0.0147, two-way ANOVA with Bonferonni's post-test, control vs ADX71743 at 20 and 40 stimulations) *p < 0.05; (control vs LY341495 at 20 and 40 stimulations) **p < 0.01. n = 3 or 4; df = 2, 48.
To confirm that the mechanism by which mGlu7 facilitates LTP is via disinhibition, we pretreated slices with 20 μm bicuculline, a GABAA antagonist, to remove any contribution of GABAergic transmission to the fEPSPs. Application of 20 μm bicuculline resulted in a significant increase in the fEPSP slope (217.8 ± 10.9% vs baseline fEPSP slope; data not shown), which stabilized after 10 min of continuous bicuculline perfusion. After a stable fEPSP slope was obtained in the presence of 20 μm bicuculline, LTP was induced either in the presence or absence of 20 min pretreatment with 3 μm ADX71743. LTP was induced with the saturating LTP paradigm of two trains of HFS. Bicuculline alone produced a significantly greater level of LTP compared with normal ACSF conditions (159.2 ± 2.4% for bicuculline vs 135.2 ± 0.3% for normal ACSF) (Fig. 7A,B). The addition of a 20 min pretreatment with 3 μm ADX71743 was no longer sufficient to block induction of LTP in the presence of bicuculline (153.1 ± 3.4% of baseline) (Fig. 7A,B). To ensure that the increased level of LTP in the presence of bicuculline did not result in changes in local circuitry that could confound the lack of ADX71743 blockade, we modified the stimulation paradigm to achieve a similar magnitude of LTP induction in normal aCSF and in the presence of bicuculline. An input–output curve was first generated in normal aCSF to determine the 50% slope value. Slices were then perfused with 20 μm bicuculline, and the stimulation intensity was reduced to generate fEPSPs with the same slope value calculated in normal aCSF. LTP was then generated using two trains of HFS. Under these conditions, we observed no significant difference in the level of LTP between normal aCSF and bicuculline (140.3 ± 2.3% in bicuculline) (Fig. 7C,D; small dashed line indicates level of LTP observed in normal aCSF). Additionally, pretreatment with ADX71743 was still not sufficient to block LTP (139.1 ± 2.5%). As a modified version of aCSF was used in these experiments, we next confirmed that the form of LTP induced in the presence of bicuculline was still NMDA receptor-dependent; 20 μm bicuculline was again bath applied until a stable fEPSP slope was obtained. Slices were then pretreated for 10 min with 50 μm d-AP5, an NMDA receptor antagonist, before HFS. This resulted in a complete blockade of LTP induction (98.2 ± 2.3% vs LTP induced in the presence of bicuculline alone; data not shown). Together, these data indicate that the mechanism by which mGlu7 activation contributes to LTP induction is through a frequency-dependent reduction of GABAergic tone at SC-CA1 synapses. Additionally, the finding that the ability of ADX71743 to block LTP is completely abolished in the presence of bicuculline further suggests that disinhibition is the primary, if not only, mechanism by which mGlu7 regulates LTP induction.
Figure 7.

Pretreatment with bicuculline prevents blockade of LTP by ADX71743. A, The 20 μm bicuculline was bath applied to slices either alone or before addition of 3 μm ADX71743 (black line). LTP was induced with 2 trains of 100 Hz stimulation (upward facing arrow). ADX71743 does not block LTP in the presence of bicuculline. B, Quantification of LTP as determined by averaging the values during the last 5 min of recording (shaded gray area in A). Addition of bicuculline resulted in a significantly higher level of LTP compared with regular aCSF, which was not blocked by ADX71743. Values represent mean ± SEM (overall: p = 0.0008, one-way ANOVA with Bonferonni's post-test; normal aCSF vs bicuculline: **p < 0.01; normal aCSF vs bicuculline and ADX71743: **p < 0.01). n = 3 or 4; df = 2, 8. C, The stimulation intensity was reduced such that the slope value during baseline in the presence of bicuculline was equal to the 50% maximal slope achieved in normal aCSF. The 20 μm bicuculline was bath applied to slices alone or before addition of 3 μm ADX71743 (black line). LTP was induced with 2 trains of 100 Hz stimulation (upward facing arrow). Small dashed line indicates the level of LTP induced in normal aCSF. ADX71743 does not block LTP in the presence of bicuculline at lower stimulation intensities. D, Quantification of LTP as determined by averaging the values during the last 5 min of recording (shaded area in C). Dashed line indicates the level of LTP induced in normal aCSF. There was no significant difference in the level of LTP between normal aCSF, 20 μm bicuculline, and 3 μm ADX71743. Values represent mean ± SEM (overall: p = 0.3147, one-way ANOVA with Bonferonni's post-test). n = 3 or 4; df = 2, 8.
Agonism of mGlu7 can potentiate LTP
To further investigate the role of mGlu7 in induction of LTP at SC-CA1 synapses, we performed experiments using a submaximal HFS stimulation paradigm to induce a threshold level of LTP to determine whether agonism of mGlu7 could potentiate this threshold level of LTP. Three different HFS paradigms were first used to identify saturating and threshold levels of LTP in our system. One train of HFS (100 Hz, 1 s) produced a moderate level of LTP (113.8 ± 4.9% of baseline), whereas 2 trains of HFS (20 s ITI) produced a significantly greater level of LTP (142.4 ± 14.1% of baseline). Additionally, three trains of HFS (20 s ITI) gave a level of LTP that was not significantly greater than two trains of HFS (151.4 ± 5.0% of baseline) (Fig. 8A,B). We next determined whether activation of mGlu7 using LSP4-2022 could potentiate induction of LTP in response to a threshold stimulus. Pretreatment of slices with 30 μm LSP4-2022 for 10 min before the threshold HFS (1 train of 100 Hz) resulted in a significant potentiation of the level of LTP measured after HFS (131.6 ± 4.2% of baseline) (Fig. 8C,D). As additional validation of an mGlu7-mediated effect, we performed the same experiment with a lower concentration of LSP4-2022 (3 μm), which should no longer activate mGlu7 (Goudet et al., 2012). Pretreatment of slices with 3 μm LSP4-2022 was no longer sufficient to potentiate LTP induced by one train of HFS (111.5 ± 1.3% of baseline) (Fig. 8E,F). Finally, to confirm that the mechanism by which LSP4-2022 potentiates LTP is via disinhibition, we again pretreated slices with 20 μm bicuculline to remove any GABAergic contribution to the fEPSPs. We used the same experimental paradigm as used in Figure 7C, D to achieve a similar magnitude of LTP in the presence of bicuculline to that of control conditions. One train of HFS applied in the presence of bicuculline induced a similar magnitude of LTP to that induced in control conditions (114.6 ± 1.5% of baseline) (Fig. 8G,H; small dashed line indicates level of LTP observed in normal aCSF). Additionally, in the presence of bicuculline, 30 μm LSP4-2022 was no longer sufficient to potentiate the level of LTP (114.7 ± 1.8% of baseline) (Fig. 8G,H). These results are consistent with the hypothesis that activation of mGlu7 can potentiate LTP at SC-CA1 synapses via a disinhibition of CA1 pyramidal cells (Fig. 9). Moreover, when considered with the results from the mGlu7 NAM experiments, our results suggest that activation of mGlu7 is necessary for induction of LTP at this synapse.
Figure 8.

Agonism of mGlu7 potentiates submaximal LTP. A, Three different high-frequency stimulation paradigms were used to induce varying levels of LTP. One train of 100 Hz stimulation induced a submaximal level of LTP, whereas 2 or 3 trains of 100 Hz stimulation both induced saturated LTP. Upward facing arrows indicate all HFS stimulations. B, Quantification of LTP as determined by averaging the values during the last 5 min of recording (shaded gray area in A). Values represent mean ± SEM (overall: p = 0.0005, one-way ANOVA with Bonferonni's post-test, 1 train vs 2 trains, **p < 0.01, 1 train vs 3 trains, ***p < 0.001, n = 3 or 4, df = 2, 8). C, Pretreatment with 30 μm LSP4-2022 significantly potentiated LTP induced by application of 1 train of 100 Hz stimulation. D, Quantification of LTP as determined by averaging the values during the last 5 min of recording (shaded gray area in C). Values represent mean ± SEM. *p = 0.012 (two-tailed Student's t test). n = 3 or 4; df = 5. E, Pretreatment with 3 μm LSP4-2022 did not significantly alter the level of LTP induced by application of 1 train of 100 Hz stimulation. F, Quantification of LTP as determined by averaging the values during the last 5 min of recording (shaded area in E). Values represent mean ± SEM. p > 0.05 (two-tailed Student's t test). n = 3 or 4; df = 5. G, The 20 μm bicuculline was bath applied to slices, and the stimulation intensity was reduced such that the slope of the baseline fEPSPs was similar in magnitude to the 50% maximum fEPSP slope in normal aCSF determined via an intensity input–output curve. Pretreatment with bicuculline alone or with a 10 min treatment with 30 μm LSP4-2022 (black line) did not significantly enhance the level of LTP induced with 1 train of 100 Hz stimulation (upward facing arrow). Small dashed line indicates the level of LTP induced in normal aCSF. H, Quantification of LTP as determined by averaging the values during the last 5 min of recording (shaded area in G). Dashed line indicates the level of LTP induced in normal aCSF. Values represent mean ± SEM (overall: p = 0.3258, one-way ANOVA with Bonferonni's post-test). n = 3 or 4; df = 2, 8.
Figure 9.
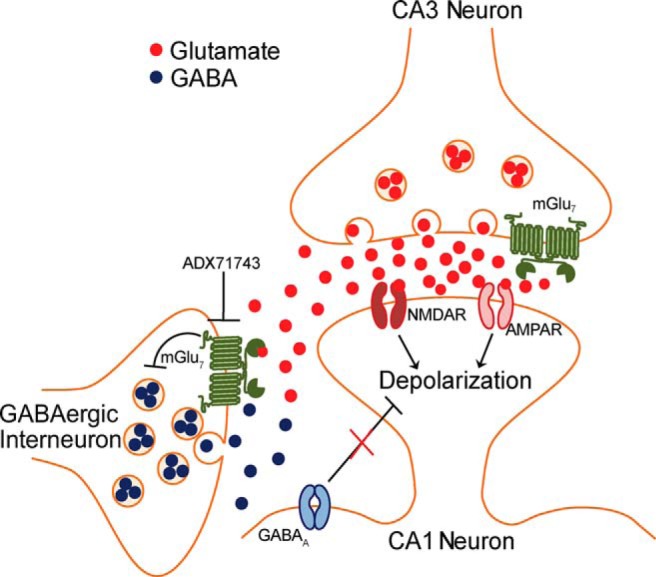
Working model of the mechanism by which mGlu7 mediates induction of LTP at SC-CA1 synapses. mGlu7 is a low-affinity mGlu receptor that is expressed presynaptically on both glutamatergic projections from CA3 and on interneurons in area CA1. Despite its localization directly within the synaptic cleft, it is only activated on GABAergic interneurons under strong synaptic activity when concentrations of glutamate are high. HFS induces robust glutamate release, which is sufficient to activate mGlu7 located presynaptically on GABAergic interneurons. This activation induces an inhibition of GABA release and a disinhibition of the circuit, thus facilitating LTP induction. Further investigation will be necessary to determine how and when mGlu7 becomes active on glutamatergic terminals and what the consequences of this activation are on transmission.
Discussion
mGlu7 is unique from other Group III mGlu receptors in that it has an extremely low affinity for glutamate, is present on both glutamatergic and GABAergic terminals, and is the only functional Group III receptor present at SC-CA1 synapses in the hippocampus (Bradley et al., 1996; Kosinski et al., 1999; Dalezios et al., 2002; Ayala et al., 2008; Summa et al., 2013). Its role in regulating transmission in hippocampal area CA1 has been thought to be primarily through reduction of glutamatergic transmission, as mGlu7 agonists reduce fEPSP slopes (Baskys and Malenka, 1991; Gereau and Conn, 1995; Ayala et al., 2008; Jalan-Sakrikar et al., 2014). We and others, however, have not found a clear role for mGlu7 in regulating endogenous glutamate release. In contrast to what has been seen for mGlu2/3 in the dentate gyrus, we saw no activation of mGlu7 in response to repeated SC afferent stimulations either at 5 Hz or at 100 Hz. These results suggest that mGlu7 may not act as a traditional autoreceptor and does not decrease glutamatergic transmission in response to repeated bursts of endogenous glutamate release at this synapse. This novel finding is intriguing, given the substantial evidence for the presynaptic localization of mGlu7 on SC terminals directly within the synaptic cleft (Shigemoto et al., 1996). Despite this localization, the functional significance of this population of mGlu7 in the regulation of glutamatergic transmission is unclear, and additional studies will be necessary to determine whether there are specific conditions or firing patterns necessary for synaptic activation of mGlu7.
Both electron microscopy and functional studies indicate that, in addition to its localization at glutamatergic terminals, mGlu7 is located presynaptically on a variety of GABAergic interneuron terminals within the SC-CA1 region of the hippocampus where it can decrease GABAergic transmission onto CA1 pyramidal cells in response to agonist (Summa et al., 2013). We again sought to determine whether we could observe mGlu7 activation in response to endogenous glutamate release using the same stimulation paradigms used to study glutamatergic transmission. We observed no activation of mGlu7 under low-frequency stimulation; however, a consistent and significant activation of mGlu7 was observed only using a 100 Hz stimulation paradigm. Thus, under periods of repeated, high-frequency firing of glutamatergic afferents, sufficient concentrations of glutamate are achieved at GABAergic synapses to activate mGlu7 and decrease GABAergic transmission onto CA1 cells. The direct actions of mGlu7 at GABAergic synapses are confirmed by our finding that mGlu7 ligands have effects on IPSCs induced by monosynaptic and optogenetic activation of GABAergic terminals, both of which eliminate potential effects of mGlu7 on excitatory synapses onto inhibitory interneurons. The optogenetic activation of GABAergic interneurons also eliminates the contribution that other neuromodulators may have on GABA release, as electrical stimulation could cause the release of other neurotransmitters or factors that would not be eliminated in our monosynaptic experimental paradigm.
LTP is one of the two forms of synaptic plasticity present in vertebrate animals. LTP and its counterpart LTD have been postulated to be a molecular basis for learning and memory (for review, see Barnes, 1995). Both of these forms of long-term synaptic plasticity have been most heavily characterized at the SC-CA1 synapse, and proper function of these processes has been linked to several learning and memory animal behavioral tasks (Whitlock et al., 2006). Many of the molecular requirements for LTP at SC-CA1 synapses have been elucidated, including the requirement for NMDAR activation and postsynaptic depolarization (Malinow and Miller, 1986; Morris et al., 1986). Because of the lack of subtype-selective compounds that do not exhibit complex pharmacology, the role that mGlu7 plays in LTP has not been characterized, despite evidence indicating the loss of the receptor is detrimental to behavioral tasks reliant on proper hippocampal LTP (Bushell et al., 2002; Hölscher et al., 2005; Goddyn et al., 2008). The current findings suggest that selective depression of GABAergic, but not glutamatergic, transmission induced by synaptic activation of mGlu7 with high-frequency afferent firing could be critical for induction of LTP. A central role for mGlu7-mediated disinhibition in induction of LTP is likely to be especially important under conditions in which pyramidal cells are not depolarized by other factors, such as other neuromodulatory influences or coincident activity at excitatory inputs from the perforant path or other glutamatergic projections.
The results of our whole-cell HFS experiments show that activation of mGlu7 reduces inhibitory synaptic transmission in CA1 pyramidal cells. Antagonism of mGlu7 reversed this disinhibition; however, we did not observe a full reversal of the disinhibition. This indicates that there may be a threshold level of disinhibition necessary for LTP induction to occur, which can be achieved by synaptic activation of mGlu7. The remainder of the inhibition observed after HFS may be the result of other mechanisms, such as the production of endocannabinoids or release of other neuromodulators. There is evidence that Group I mGlu receptor-mediated release of endocannabinoids and activation of CB1 receptors can reduce GABA release in area CA1 (termed depolarization-induced suppression of inhibition [DSI]) (Varma et al., 2001; Ohno-Shosaku et al., 2002; Chevaleyre and Castillo, 2003, 2004). Despite strong literature evidence that Group I mGlu receptor activation reduces IPSC amplitudes, we did not observe this using our whole-cell HFS protocol (data not shown). However, the difference in stimulation paradigm used in our study versus in previous studies (10 pulses at 100 Hz vs TBS induction) could account for the differences observed between endocannabinoid-mediated disinhibition and our study. As such, it will be important to determine whether mGlu7-mediated disinhibition also occurs using TBS protocols to better understand how the two mechanisms functionally relate. The reduction in GABA release observed with the activation of CB1 receptors causes GABAergic interneurons to undergo LTD (termed I-LTD), which has been shown to act as a priming mechanism that can facilitate LTP induction at glutamatergic terminals (Chevaleyre and Castillo, 2003, 2004). The relative contributions of endocannabinoid-mediated and mGlu7-mediated disinhibition have yet to be determined; however, the fact that blockade of mGlu7 is sufficient to prevent the induction of LTP alone coupled with the observation that LTP can still be induced in CB1 KO mice perhaps indicates that the roles that mGlu7 and endocannabinoids play in disinhibition may be mechanistically distinct (Chevaleyre and Castillo, 2004). Indeed, endocannabinoid-mediated I-LTD serves to modulate the precise level of LTP (Chevaleyre and Castillo, 2004), whereas mGlu7 activation during HFS appears to be necessary for LTP induction. Together, these findings could indicate that both mechanisms serve to fine-tune both the timing and strength of LTP at specific glutamatergic synapses. Additionally, DSI, and, consequently, I-LTD only occur in 20% of inhibitory connections found in CA1 cell dendrites (Chevaleyre and Castillo, 2004). This could indicate that perhaps there is a spatial difference in the expression of CB1- versus mGlu7-mediated disinhibition, with mGlu7-mediated disinhibition perhaps occurring at synapses that are I-LTD insensitive. These findings are particularly intriguing given that we observe mGlu7 activation on PV-expressing interneurons, which are known to be CB1 receptor negative in the hippocampus, whereas the majority of CB1 receptors are found on cholecystokinin-expressing interneurons (Katona et al., 1999; Tsou et al., 1999). There have also been reports that mGlu7 plays a role in mediating bidirectional plasticity of feedforward inhibition at mossy fiber inputs onto CA3 stratum lucidum interneurons, where activation of mGlu7 initially induces a robust LTD at this synapse, followed by LTP after agonist-induced mGlu7 internalization (Pelkey et al., 2005, 2007, 2008). Although this phenomenon has only been studied at this synapse, it supports the idea that mGlu7 is well positioned to be a controller of synaptic plasticity.
To date, there have been few studies directly investigating the role of mGlu7 in regulation of plasticity at the SC-CA1 synapse. There has been one report in mGlu7 knock-out mice in which the authors found a deficit in post-tetanic potentiation; however, no change in the level of LTP was observed (Bushell et al., 2002). However, interpreting results from genetically modified animals can be complicated by developmental and compensatory changes. We have reported that mGlu8 is the predominant Group III mGlu receptor present in neonatal animals and that mGlu7 becomes the predominant Group III mGlu receptor present in adult animals (Baskys and Malenka, 1991; Ayala et al., 2008). It is feasible that, in an mGlu7 knock-out mouse, this switch between mGlu7 and mGlu8 cannot occur, leading to prolonged mGlu8 expression. Because of the high conservation of the LTP phenomenon among vertebrate species and its speculated crucial role in learning and memory, it is possible that expression of mGlu8 remains to compensate for the loss of mGlu7, which could explain the lack of LTP deficits in mGlu7 KO animals.
Polymorphisms in the mGlu7 gene have been associated with the pathophysiology of affective disorders, such as major depression and anxiety, autism spectrum disorders, and schizophrenia (Ganda et al., 2009; Pergadia et al., 2011; Yang and Pan, 2013). Additionally, genetic deletion of mGlu7 results in a variety of behavioral deficits that mimic human phenotypes seen in several of the aforementioned disease states and point to its role in learning and memory. Loss of mGlu7 has been attributed to deficits in working memory (Hölscher et al., 2004, 2005) and fear learning (Callaerts-Vegh et al., 2006; Goddyn et al., 2008). Specifically, there are impairments in contextual fear conditioning in these animals, and systemic administration of a different, structurally distinct mGlu7 NAM, MMPIP, to wild-type mice results in deficits in object recognition and object localization tasks, which are models of nonspatial and spatial memory, respectively (Hikichi et al., 2010). All of these data point toward a role for mGlu7 in modulating learning in memory associated with the hippocampus.
Together, our results indicate that mGlu7 does not act as a traditional autoreceptor in hippocampal area CA1 but instead functions under intense synaptic firing as a heteroceptor to decrease GABAergic transmission. We also provide the first evidence for a direct role of mGlu7 in mediating induction of LTP at SC-CA1 synapses using a common induction paradigm. Additionally, we have shown that mGlu7's role as a frequency-dependent presynaptic heteroeceptor located on GABAergic interneurons is critical for this mechanism. It will be important in future studies to determine the precise role of mGlu7 in hippocampal-based learning and memory tasks as well as to investigate whether mGlu7 also plays a role in induction of LTP using θ burst stimulation paradigms. It will also be important to determine whether mGlu7's role in synaptic plasticity is restricted to SC-CA1 synapses or whether it functions more broadly as a global regulator of plasticity in other circuits throughout the brain. One recent study found deficits in lateral amygdala LTP when mGlu7 was blocked using a newly described orthosteric antagonist, XAP044 (Gee et al., 2014), suggesting that this role for mGlu7 could be observed in other brain regions. Finally, these data also indicate that compounds that agonize or potentiate mGlu7 function could be efficacious in disease states where hippocampal LTP is deficient.
Footnotes
This work was supported by National Institutes of Health Grant R21 NS078262 to C.M.N. and Grant R01 NS031373 to P.J.C., www.Rettsyndrome.org Basic Research Grant to C.M.N., and Autism Speaks Treatment Grant to C.M.N., R.K. was supported by Autism Speaks Weatherstone Predoctoral Fellowship and the Howard Hughes Medical Institute Certificate Program in Molecular Medicine through Vanderbilt University. A.G.W. was supported by a postdoctoral fellowship through the PhRMA Foundation.
The authors declare no competing financial interests.
References
- Ayala JE, Niswender CM, Luo Q, Banko JL, Conn PJ. Group III mGluR regulation of synaptic transmission at the SC-CA1 synapse is developmentally regulated. Neuropharmacology. 2008;54:804–814. doi: 10.1016/j.neuropharm.2007.12.009. [DOI] [PMC free article] [PubMed] [Google Scholar]
- Barnes CA. Involvement of LTP in memory: are we “searching under the street light?”. Neuron. 1995;15:751–754. doi: 10.1016/0896-6273(95)90166-3. [DOI] [PubMed] [Google Scholar]
- Baskys A, Malenka RC. Agonists at metabotropic glutamate receptors presynaptically inhibit EPSCs in neonatal rat hippocampus. J Physiol. 1991;444:687–701. doi: 10.1113/jphysiol.1991.sp018901. [DOI] [PMC free article] [PubMed] [Google Scholar]
- Bradley SR, Levey AI, Hersch SM, Conn PJ. Immunocytochemical localization of Group III metabotropic glutamate receptors in the hippocampus with subtype-specific antibodies. J Neurosci. 1996;16:2044–2056. doi: 10.1523/JNEUROSCI.16-06-02044.1996. [DOI] [PMC free article] [PubMed] [Google Scholar]
- Bushell TJ, Sansig G, Collett VJ, van der Putten H, Collingridge GL. Altered short-term synaptic plasticity in mice lacking the metabotropic glutamate receptor mGlu7. Sci World J. 2002;2:730–737. doi: 10.1100/tsw.2002.146. [DOI] [PMC free article] [PubMed] [Google Scholar]
- Callaerts-Vegh Z, Beckers T, Ball SM, Baeyens F, Callaerts PF, Cryan JF, Molnar E, D'Hooge R. Concomitant deficits in working memory and fear extinction are functionally dissociated from reduced anxiety in metabotropic glutamate receptor 7-deficient mice. J Neurosci. 2006;26:6573–6582. doi: 10.1523/JNEUROSCI.1497-06.2006. [DOI] [PMC free article] [PubMed] [Google Scholar]
- Chevaleyre V, Castillo PE. Heterosynaptic LTD of hippocampal GABAergic synapses: a novel role of endocannabinoids in regulating excitability. Neuron. 2003;38:461–472. doi: 10.1016/S0896-6273(03)00235-6. [DOI] [PubMed] [Google Scholar]
- Chevaleyre V, Castillo PE. Endocannabinoid-mediated metaplasticity in the hippocampus. Neuron. 2004;43:871–881. doi: 10.1016/j.neuron.2004.08.036. [DOI] [PubMed] [Google Scholar]
- Collingridge GL, Herron CE, Lester RA. Frequency-dependent N-methyl-d-aspartate receptor-mediated synaptic transmission in rat hippocampus. J Physiol. 1988;399:301–312. doi: 10.1113/jphysiol.1988.sp017081. [DOI] [PMC free article] [PubMed] [Google Scholar]
- Dalezios Y, Luján R, Shigemoto R, Roberts JD, Somogyi P. Enrichment of mGluR7a in the presynaptic active zones of GABAergic and non-GABAergic terminals on interneurons in the rat somatosensory cortex. Cereb Cortex. 2002;12:961–974. doi: 10.1093/cercor/12.9.961. [DOI] [PubMed] [Google Scholar]
- Debray C, Diabira D, Gaiarsa JL, Ben-Ari Y, Gozlan H. Contributions of AMPA and GABA(A) receptors to the induction of NMDAR-dependent LTP in CA1. Neurosci Lett. 1997;238:119–122. doi: 10.1016/S0304-3940(97)00865-3. [DOI] [PubMed] [Google Scholar]
- Doherty JJ, Alagarsamy S, Bough KJ, Conn PJ, Dingledine R, Mott DD. Metabotropic glutamate receptors modulate feedback inhibition in a developmentally regulated manner in rat dentate gyrus. J Physiol. 2004;561:395–401. doi: 10.1113/jphysiol.2004.074930. [DOI] [PMC free article] [PubMed] [Google Scholar]
- Flor PJ, Van Der Putten H, Rüegg D, Lukic S, Leonhardt T, Bence M, Sansig G, Knöpfel T, Kuhn R. A novel splice variant of a metabotropic glutamate receptor, human mGluR7b. Neuropharmacology. 1997;36:153–159. doi: 10.1016/S0028-3908(96)00176-1. [DOI] [PubMed] [Google Scholar]
- Ganda C, Schwab SG, Amir N, Heriani H, Irmansyah I, Kusumawardhani A, Nasrun M, Widyawati I, Maier W, Wildenauer DB. A family-based association study of DNA sequence variants in GRM7 with schizophrenia in an Indonesian population. Int J Neuropsychopharmacol. 2009;12:1283–1289. doi: 10.1017/S1461145709990356. [DOI] [PubMed] [Google Scholar]
- Gee CE, Peterlik D, Neuhäuser C, Bouhelal R, Kaupmann K, Laue G, Uschold-Schmidt N, Feuerbach D, Zimmermann K, Ofner S, Cryan JF, van der Putten H, Fendt M, Vranesic I, Glatthar R, Flor PJ. Blocking metabotropic glutamate receptor subtype 7 (mGlu7) via the Venus flytrap domain (VFTD) inhibits amygdala plasticity, stress, and anxiety-related behavior. J Biol Chem. 2014;289:10975–10987. doi: 10.1074/jbc.M113.542654. [DOI] [PMC free article] [PubMed] [Google Scholar]
- Gereau RW, 4th, Conn PJ. Multiple presynaptic metabotropic glutamate receptors modulate excitatory and inhibitory synaptic transmission in hippocampal area CA1. J Neurosci. 1995;15:6879–6889. doi: 10.1523/JNEUROSCI.15-10-06879.1995. [DOI] [PMC free article] [PubMed] [Google Scholar]
- Goddyn H, Callaerts-Vegh Z, Stroobants S, Dirikx T, Vansteenwegen D, Hermans D, van der Putten H, D'Hooge R. Deficits in acquisition and extinction of conditioned responses in mGluR7 knockout mice. Neurobiol Learn Mem. 2008;90:103–111. doi: 10.1016/j.nlm.2008.01.001. [DOI] [PubMed] [Google Scholar]
- Goudet C, Vilar B, Courtiol T, Deltheil T, Bessiron T, Brabet I, Oueslati N, Rigault D, Bertrand HO, McLean H, Daniel H, Amalric M, Acher F, Pin JP. A novel selective metabotropic glutamate receptor 4 agonist reveals new possibilities for developing subtype selective ligands with therapeutic potential. FASEB J. 2012;26:1682–1693. doi: 10.1096/fj.11-195941. [DOI] [PubMed] [Google Scholar]
- Granger AJ, Nicoll RA. Expression mechanisms underlying long-term potentiation: a postsynaptic view, 10 years on. Philos Trans R Soc Lond B Biol Sci. 2014;369:20130136. doi: 10.1098/rstb.2013.0136. [DOI] [PMC free article] [PubMed] [Google Scholar]
- Harris KM, Teyler TJ. Developmental onset of long-term potentiation in area CA1 of the rat hippocampus. J Physiol. 1984;346:27–48. doi: 10.1113/jphysiol.1984.sp015005. [DOI] [PMC free article] [PubMed] [Google Scholar]
- Hikichi H, Murai T, Okuda S, Maehara S, Satow A, Ise S, Nishino M, Suzuki G, Takehana H, Hata M, Ohta H. Effects of a novel metabotropic glutamate receptor 7 negative allosteric modulator, 6-(4-methoxyphenyl)-5-methyl-3-pyridin-4-ylisoxazonolo[4,5-c]pyridin-4(5H)-one (MMPIP), on the central nervous system in rodents. Eur J Pharmacol. 2010;639:106–114. doi: 10.1016/j.ejphar.2009.08.047. [DOI] [PubMed] [Google Scholar]
- Hölscher C, Schmid S, Pilz PK, Sansig G, van der Putten H, Plappert CF. Lack of the metabotropic glutamate receptor subtype 7 selectively impairs short-term working memory but not long-term memory. Behav Brain Res. 2004;154:473–481. doi: 10.1016/j.bbr.2004.03.015. [DOI] [PubMed] [Google Scholar]
- Hölscher C, Schmid S, Pilz PK, Sansig G, van der Putten H, Plappert CF. Lack of the metabotropic glutamate receptor subtype 7 selectively modulates Theta rhythm and working memory. Learn Mem. 2005;12:450–455. doi: 10.1101/lm.98305. [DOI] [PubMed] [Google Scholar]
- Jalan-Sakrikar N, Field JR, Klar R, Mattmann ME, Gregory KJ, Zamorano R, Engers DW, Bollinger SR, Weaver CD, Days EL, Lewis LM, Utley TJ, Hurtado M, Rigault D, Acher F, Walker AG, Melancon BJ, Wood MR, Lindsley CW, Conn PJ, et al. Identification of positive allosteric modulators VU0155094 (ML397) and VU0422288 (ML396) reveals new insights into the biology of metabotropic glutamate receptor 7. ACS Chem Neurosci. 2014;5:1221–1237. doi: 10.1021/cn500153z. [DOI] [PMC free article] [PubMed] [Google Scholar]
- Kalinichev M, Rouillier M, Girard F, Royer-Urios I, Bournique B, Finn T, Charvin D, Campo B, Le Poul E, Mutel V, Poli S, Neale SA, Salt TE, Lütjens R. ADX71743, a potent and selective negative allosteric modulator of metabotropic glutamate receptor 7: in vitro and in vivo characterization. J Pharmacol Exp Ther. 2013;344:624–636. doi: 10.1124/jpet.112.200915. [DOI] [PubMed] [Google Scholar]
- Katona I, Sperlágh B, Sik A, Kafalvi A, Vizi ES, Mackie K, Freund TF. Presynaptically located CB1 cannabinoid receptors regulate GABA release from axon terminals of specific hippocampal interneurons. J Neurosci. 1999;19:4544–4558. doi: 10.1523/JNEUROSCI.19-11-04544.1999. [DOI] [PMC free article] [PubMed] [Google Scholar]
- Kawaguchi Y, Katsumaru H, Kosaka T, Heizmann CW, Hama K. Fast spiking cells in rat hippocampus (CA1 region) contain the calcium-binding protein parvalbumin. Brain Res. 1987;416:369–374. doi: 10.1016/0006-8993(87)90921-8. [DOI] [PubMed] [Google Scholar]
- Kingston AE, Ornstein PL, Wright RA, Johnson BG, Mayne NG, Burnett JP, Belagaje R, Wu S, Schoepp DD. LY341495 is a nanomolar potent and selective antagonist of Group II metabotropic glutamate receptors. Neuropharmacology. 1998;37:1–12. doi: 10.1016/S0028-3908(97)00191-3. [DOI] [PubMed] [Google Scholar]
- Kinoshita A, Shigemoto R, Ohishi H, van der Putten H, Mizuno N. Immunohistochemical localization of metabotropic glutamate receptors, mGluR7a and mGluR7b, in the central nervous system of the adult rat and mouse: a light and electron microscopic study. J Comp Neurol. 1998;393:332–352. doi: 10.1002/(SICI)1096-9861(19980413)393:3<332::AID-CNE6>3.0.CO;2-2. [DOI] [PubMed] [Google Scholar]
- Klausberger T, Marton LF, O'Neill J, Huck JH, Dalezios Y, Fuentealba P, Suen WY, Papp E, Kaneko T, Watanabe M, Csicsvari J, Somogyi P. Complementary roles of cholecystokinin- and parvalbumin-expressing GABAergic neurons in hippocampal network oscillations. J Neurosci. 2005;25:9782–9793. doi: 10.1523/JNEUROSCI.3269-05.2005. [DOI] [PMC free article] [PubMed] [Google Scholar]
- Kosinski CM, Risso Bradley S, Conn PJ, Levey AI, Landwehrmeyer GB, Penney JB, Jr, Young AB, Standaert DG. Localization of metabotropic glutamate receptor 7 mRNA and mGluR7a protein in the rat basal ganglia. J Comp Neurol. 1999;415:266–284. doi: 10.1002/(SICI)1096-9861(19991213)415:2<266::AID-CNE9>3.0.CO;2-7. [DOI] [PubMed] [Google Scholar]
- Losonczy A, Somogyi P, Nusser Z. Reduction of excitatory postsynaptic responses by persistently active metabotropic glutamate receptors in the hippocampus. J Neurophysiol. 2003;89:1910–1919. doi: 10.1152/jn.00842.2002. [DOI] [PubMed] [Google Scholar]
- Malinow R, Miller JP. Postsynaptic hyperpolarization during conditioning reversibly blocks induction of long-term potentiation. Nature. 1986;320:529–530. doi: 10.1038/320529a0. [DOI] [PubMed] [Google Scholar]
- Morris RG, Anderson E, Lynch GS, Baudry M. Selective impairment of learning and blockade of long-term potentiation by an N-methyl-d-aspartate receptor antagonist, AP5. Nature. 1986;319:774–776. doi: 10.1038/319774a0. [DOI] [PubMed] [Google Scholar]
- Niswender CM, Conn PJ. Metabotropic glutamate receptors: physiology, pharmacology, and disease. Annu Rev Pharmacol Toxicol. 2010;50:295–322. doi: 10.1146/annurev.pharmtox.011008.145533. [DOI] [PMC free article] [PubMed] [Google Scholar]
- Ohno-Shosaku T, Tsubokawa H, Mizushima I, Yoneda N, Zimmer A, Kano M. Presynaptic cannabinoid sensitivity is a major determinant of depolarization-induced retrograde suppression at hippocampal synapses. J Neurosci. 2002;22:3864–3872. doi: 10.1523/JNEUROSCI.22-10-03864.2002. [DOI] [PMC free article] [PubMed] [Google Scholar]
- Pancani T, Bolarinwa C, Smith Y, Lindsley CW, Conn PJ, Xiang Z. M4 mAChR-mediated modulation of glutamatergic transmission at corticostriatal synapses. ACS Chem Neurosci. 2014;5:318–324. doi: 10.1021/cn500003z. [DOI] [PMC free article] [PubMed] [Google Scholar]
- Pelkey KA, Lavezzari G, Racca C, Roche KW, McBain CJ. mGluR7 is a metaplastic switch controlling bidirectional plasticity of feedforward inhibition. Neuron. 2005;46:89–102. doi: 10.1016/j.neuron.2005.02.011. [DOI] [PubMed] [Google Scholar]
- Pelkey KA, Yuan X, Lavezzari G, Roche KW, McBain CJ. mGluR7 undergoes rapid internalization in response to activation by the allosteric agonist AMN082. Neuropharmacology. 2007;52:108–117. doi: 10.1016/j.neuropharm.2006.07.020. [DOI] [PubMed] [Google Scholar]
- Pelkey KA, Topolnik L, Yuan XQ, Lacaille JC, McBain CJ. State-dependent cAMP sensitivity of presynaptic function underlies metaplasticity in a hippocampal feedforward inhibitory circuit. Neuron. 2008;60:980–987. doi: 10.1016/j.neuron.2008.11.018. [DOI] [PMC free article] [PubMed] [Google Scholar]
- Pergadia ML, Glowinski AL, Wray NR, Agrawal A, Saccone SF, Loukola A, Broms U, Korhonen T, Penninx BW, Grant JD, Nelson EC, Henders AK, Schrage AJ, Chou YL, Keskitalo-Vuokko K, Zhu Q, Gordon SD, Vink JM, de Geus EJ, Macgregor S, et al. A 3p26–3p25 genetic linkage finding for DSM-IV major depression in heavy smoking families. Am J Psychiatry. 2011;168:848–852. doi: 10.1176/appi.ajp.2011.10091319. [DOI] [PMC free article] [PubMed] [Google Scholar]
- Rosemond E, Wang M, Yao Y, Storjohann L, Stormann T, Johnson EC, Hampson DR. Molecular basis for the differential agonist affinities of group III metabotropic glutamate receptors. Mol Pharmacol. 2004;66:834–842. doi: 10.1124/mol.104.002956. [DOI] [PubMed] [Google Scholar]
- Selvam C, Oueslati N, Lemasson IA, Brabet I, Rigault D, Courtiol T, Cesarini S, Triballeau N, Bertrand HO, Goudet C, Pin JP, Acher FC. A virtual screening hit reveals new possibilities for developing group III metabotropic glutamate receptor agonists. J Med Chem. 2010;53:2797–2813. doi: 10.1021/jm901523t. [DOI] [PubMed] [Google Scholar]
- Shigemoto R, Kulik A, Roberts JD, Ohishi H, Nusser Z, Kaneko T, Somogyi P. Target-cell-specific concentration of a metabotropic glutamate receptor in the presynaptic active zone. Nature. 1996;381:523–525. doi: 10.1038/381523a0. [DOI] [PubMed] [Google Scholar]
- Summa M, Di Prisco S, Grilli M, Usai C, Marchi M, Pittaluga A. Presynaptic mGlu7 receptors control GABA release in mouse hippocampus. Neuropharmacology. 2013;66:215–224. doi: 10.1016/j.neuropharm.2012.04.020. [DOI] [PubMed] [Google Scholar]
- Tsou K, Mackie K, Sanudo-Peña MC, Walker JM. Cannabinoid CB1 receptors are localized primarily on cholecystokinin-containing GABAergic interneurons in the rat hippocampal formation. Neuroscience. 1999;93:969–975. doi: 10.1016/S0306-4522(99)00086-X. [DOI] [PubMed] [Google Scholar]
- Varma N, Carlson GC, Ledent C, Alger BE. Metabotropic glutamate receptors drive the endocannabinoid system in hippocampus. J Neurosci. 2001;21:RC188. doi: 10.1523/JNEUROSCI.21-24-j0003.2001. [DOI] [PMC free article] [PubMed] [Google Scholar]
- Whitlock JR, Heynen AJ, Shuler MG, Bear MF. Learning induces long-term potentiation in the hippocampus. Science. 2006;313:1093–1097. doi: 10.1126/science.1128134. [DOI] [PubMed] [Google Scholar]
- Yang Y, Pan C. Role of metabotropic glutamate receptor 7 in autism spectrum disorders: a pilot study. Life Sci. 2013;92:149–153. doi: 10.1016/j.lfs.2012.11.010. [DOI] [PubMed] [Google Scholar]