Abstract
We present nnnnnin vivo volumetric depth-resolved vasculature images of the anterior segment of the human eye acquired with phase-variance based motion contrast using a high-speed (100 kHz, 105 A-scans/s) swept source optical coherence tomography system (SSOCT). High phase stability SSOCT imaging was achieved by using a computationally efficient phase stabilization approach. The human corneo–scleral junction and sclera were imaged with swept source phase-variance optical coherence angiography and compared with slit lamp images from the same eyes of normal subjects. Different features of the rich vascular system in the conjunctiva and episclera were visualized and described. This system can be used as a potential tool for ophthalmological research to determine changes in the outflow system, which may be helpful for identification of abnormalities that lead to glaucoma.
Keywords: optical coherence tomography, imaging systems, medical and biological imaging, ophthalmology
1. Introduction
OCT provides depth resolved high-resolution cross-sectional and volumetric imaging of biological tissues, noninvasively [1]. It is widely used as a standard procedure in clinical ophthalmology for retinal as well as anterior segment disease diagnosis [2, 3]. Most of the current clinical OCT technology, mainly spectral domain (SD) OCT, operates in the 800–950 nm spectral window. This technology permits efficient measurements of corneal structures, including vessels and capillaries, but provides limited ability to examine the limbus and its layered vascular beds. This is mainly because the 800–950 nm band is strongly scattered and absorbed by the sclera. Swept-source (SS) OCT is now an attractive alternative for 1 μm spectral band OCT (1000–1100 nm) over SD-OCT. Its main advantages include robustness to sample motion, a long measurement range in depth due to short instantaneous line-width, linear sampling in wavenumber (k-clock—trigger), compactness, increased detection efficiency (balanced detection scheme) and high imaging speed [4–6]. Various OCT blood flow detection techniques [7–13] have been developed based on the phase shift and the angle between the imaging beam and flow direction. Some of them allowed direct and total retinal blood flow measurement [14–18]. However, those systems utilize complex hardware design. Microvasculature can be twisted so techniques that are angularly dependent may fail to generate complete vascular maps in vivo. In recent years the class of OCT methods detecting blood perfusion rather than quantifying flow (also called optical coherence angiography) has been developed and successfully applied to map volumetric vasculature. As an example the phase variance technique provides good results for detecting blood perfusion [19, 20]. Another method, speckle variance, is based on changes in structural image intensity and has been described for tumor microvascular imaging [21]. Most ophthalmic applications of these methods [14, 18, 20] have been applied to visualize retinal vasculature. More recently, quantitative characterization of different vascular networks and visualization of capillaries of the anterior segment have been reported [22, 23]. Kagemann et al presented velocity measurements in the limbal regions [23]. SDOCT and Doppler method based optical microangiography has been used to perform microvascular imaging of limbal vessels [24]. However, few of these angiographic studies have been performed using swept source optical coherence tomography system (SSOCT) systems [9, 10, 13, 20].
The transitional region between the cornea and sclera is called the limbus. This region contains vessels that are associated with the circulatory system, lymphatic system and aqueous outflow. Their roles include cell nutrition, cell waste removal as well as maintaining the balance between production and drainage of aqueous humor. The disruption of aqueous flow dynamics is often regarded as one of the factors contributing to the development of glaucoma [24–26]. Clinical angiographic techniques require injecting a fluorescent dye (indocyanine green or sodium fluorescein) and photographing the fluorescence emission stimulated by short-wavelength light as the dye passes through the vessels.
In this paper, we demonstrate the swept source phase-variance optical coherence angiography (SSpvOCA) method for in vivo visualization of limbal and scleral vasculature. This is a non-invasive, non-contact angiographic technique that does not require any exogenous dyes as with fluorescence based angiographic methods, fluorescein angiography (FA) and indocyanine green angiography. It utilizes a high speed swept source OCT system operating in the 1–1.1 μm wavelength range and phase variance contrast (PVC) method [19, 20].
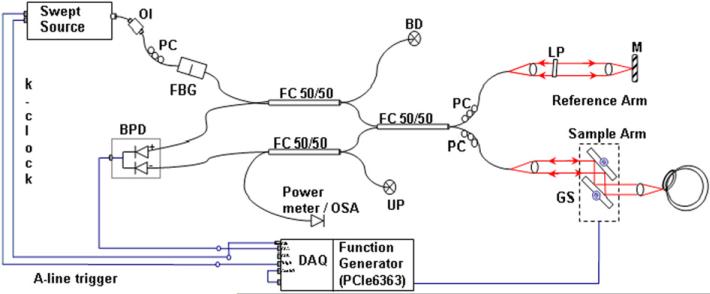
SS-OCT systems often experience a jittering effect due to small fluctuations between the timing of the trigger of the sweep wavelength and data acquisition. This jittering results in phase instability which causes random spectral shifts between consecutive A-line spectra. This instability in phase creates a significant problem for SSpvOCA data acquisition. Recently, we demonstrated a simple and robust method to overcome this problem [6, 20]. Our method uses a reference wavenumber from a fixed fiber Bragg grating (FBG, shown in figure 1) to register each A-line. This numerical phase stabilization was performed without much change in hardware. Application of this method for imaging the microvasculature of the anterior segment using SSpvOCA has clinical utility for diagnosis of corneal diseases as well as monitoring surgical outcomes.
Figure 1.
Schematic diagram of SSpvOCA system. Swept source laser; FBG—fiber Bragg grating; interferometer; FC—fiber coupler; M— mirror: BPD—balanced photo-detector; PC—polarization controller; LP—linear polarizer; RF Amp, GS—galvanometer scanning mirrors; BD—beam dump; UP—unused port; OI—optical isolator; DAQ: A/D converter (Alazartech ATS 9350, 500 MS/s, 12 Bit); OSA—optical spectrum analyzer.
2. Materials and methods
2.1. Imaging system
The schematic diagram of the SSpvOCA system utilized in the current study is presented in figure 1. A commercial broadband SS laser (Axsun Tech., USA; characteristics: centered at 1060 nm, bandwidth of 110 nm, 46% duty cycle with average output power of ~23 mW, and sweeping rate of 100 kHz) was used. A Mach–Zehnder interferometer consisting of three 50/50 fiber couplers (AC Photonics, USA) was employed. The reference arm of the interferometer consisted of a beam collimator lens (focal length of 12.38 mm, Thorlabs, Inc.), an achromatic doublet lens (focal length of 50 mm, Thorlabs, Inc.) and a static gold-coated mirror. The sample arm was designed with a collimator lens, two single-axis (X–Y) scanners (Cambridge Technology, USA) and an achromatic doublet (focal length of 30 mm) [20]. The scattered beam from the sample arm was interfered with back reflected beam from the reference arm at the couplers and detected by a balanced photo-detector (bandwidth of DC to 350 MHz, Thorlabs Inc.). The power of the incident beam on the sample was set to less than 1.85 mW, as per the ANSI limit for maximum permissible exposure (ANSI Z136.1 standard) [27]. The sample was scanned with a galvanometric scanner, which was steered by an analog board (PCI-6363, National Instruments, USA) in synchronization with A-line trigger and data acquisition card. The OCT interference signal was acquired by a data acquisition board (DAQ, ATS9350, AlazarTech, Canada; max. acquisition speed 500 MHz and 12 bit digital resolution) at a sampling rate scaled by the external trigger provided by the source k-clock.
Data acquisition and scanning of the sample was controlled by custom LabVIEW software (National Instruments, USA), which utilized the built-in sweep trigger signal of the laser source. The OCT spectral data in binary format were transferred to a workstation (HP xw8600, 3.2 GHz dual processors).
2.2. Data processing for SSpvOCA
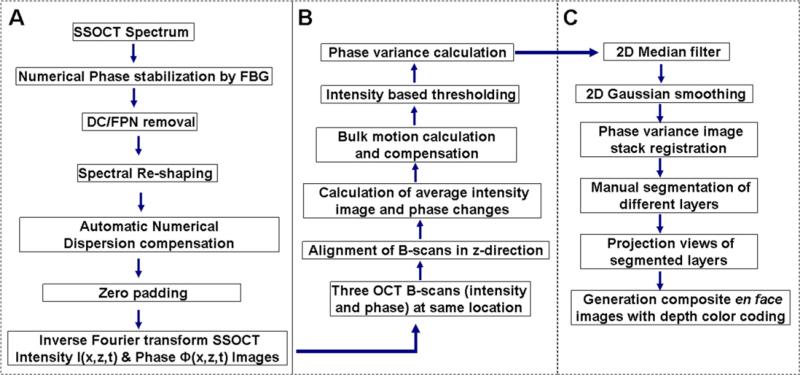
The flow chart for SSpvOCA data processing is presented in figure 2. Post-processing starts with registration ‘in time’ of each A-line, using a fixed wavelength reference signal generated by a fiber Bragg grating. This computationally robust registration process leads to phase-stabilization in the OCT signal [20], thereby helping to remove fixed-pattern noise and to generate artifact (due to phase instability) free phase-variance (pv) contrast images. An optically generated clock signal (equi-spaced in wavenumber) namely, k-clock from the laser source was used for automatic sampling of the OCT spectrum in the k-domain. Owing to this k-linear sampling, no rescaling process is required before the Fourier transform is applied on the spectral data. The averaged B-scan spectrum was subtracted from the individual A-line spectra to remove fixed-pattern noise. To minimize side-lobes of the coherence function a flat top Gaussian window function was apodized with the resultant spectra [9, 19].
Figure 2.
Flow chart showing steps for SSpvOCA data processing, (A) SSOCT data post-processing, (B) phase-variance processing; (C) en face visualization of different layers.
An automatic numerical dispersion compensation operation (based on entropy minimization method [10]) was applied on processed spectra to compensate residual dispersion mismatch between the sample and reference arm. Then, SSOCT spectral data were subjected to zero padding (to 2048 points). Finally, fast Fourier-transformation was performed to obtain the complex SSOCT data with intensity and phase information, and saved as compressed image files.
2.3. Data acquisition for SSpvOCA
A 62-year-old healthy male subject with normal ocular media was recruited in the Vision Science and Advanced Retinal Imaging laboratory (VSRI) at the University of California Davis Medical Center to obtain SSpvOCA data sets. Written informed consent was obtained prior to imaging using a protocol approved by the UC Davis Institutional Review Board. Visualization of blood perfusion required reconstruction of flow contrast (due to phase-change measurements) which was achieved by extracting pv from data acquired with BM-scanning mode (multiple B-scans at the same position). In our current study, phase variance data were calculated from sets of 3 B-scans acquired at each location (BM-scans) in the volume. Three B-scans produce two phase change measurements for each BM-scan. The spatial over-sampling between consecutive BM-scans was implemented in the scanning protocol to achieve good PVC. These data highlight motion within each cross-section, primarily due to the flow of red blood cells, yielding the location and size of vessels. The axial and lateral resolution of the system was 5.2 μm (refractive index of tissue, n = 1.38) and 14 μm, respectively. Detailed characteristics of this system are described in our previous paper [20]. All images shown in this manuscript were acquired in vivo at a rate of 105 axial scans (A-scan) per second. The scanning protocol involved 3 repeated B-scans with 440 A-scans/B-scan and 360 B-scans/C-scan requiring approximately 6 s measurement time. For imaging the sclera, scans were acquired over a 2 × 2.5 mm area, whereas the same scanning parameters were used over a scanning area of 2 × 2 mm for imaging the limbus to provide better PVC of smaller terminal vessels (TV). For the 2 × 2.5 mm2 scanning pattern, spacing between successive A-scans was 5.4 and 6.9 μm between BM-scans, whereas 5.3 μm spacing between consecutive A-scans and 5.5 μm BM-scans were used for 2 × 2 mm2 scanning.
A dynamic range of 35 dB was observed in the intensity image and the variation in phase values was from −π to +π. Mean intensity images and phase differences were calculated from sets of 3 BM-scans acquired at the same location. Then, pv data were extracted as described above. Intensity thresholding (less than 10 dB above the noise level) was applied on averaged intensity (calculated from two sets of BM-scans). Two-dimensional (2D) Gaussian smoothing (σ = 0.7) and stack registration for both the intensity and the pv data were applied over the entire volumetric data. The cross-correlation function was calculated from consecutive intensity images in an axial direction and the calculated shift was applied for motion correction. To remove phase shifts caused by eye motion (bulk motion), a histogram-based thresholding method was implemented. The details of the algorithm are presented in figure 2 as a flow chart. The basic concept of the pv-based motion contrast method has been described elsewhere [28]. The acquired and preprocessed OCT data sets were post-processed with a custom C++ program developed in Biological Imaging Center at the California Institute of Technology, USA.
En face cross-sections were produced by Gaussian averaging of 50 axial depths at the absolute location, where each slice has 1 μm separations after flattening (for sclera). 2D vascular perfusion maps were generated from the en face depth resolved projection of the SSpvOCA data. The same protocol was used for limbus imaging, but without flattening the volume. Slit lamp images were acquired with the Topcon SL-D8Z Digital Slit Lamp (TRC-50IX), trademarked product of TopCon, Japan. Pseudo-color (red-green-blue (RGB)) depth coding of the processed volumetric data sets was used for better visualization of three-dimensional (3D) vessel networks and its projection view created 2D color vasculature maps linearly color coded by axial depth location of the vessels.
2.4. Phase-stabilization for SSpvOCA system
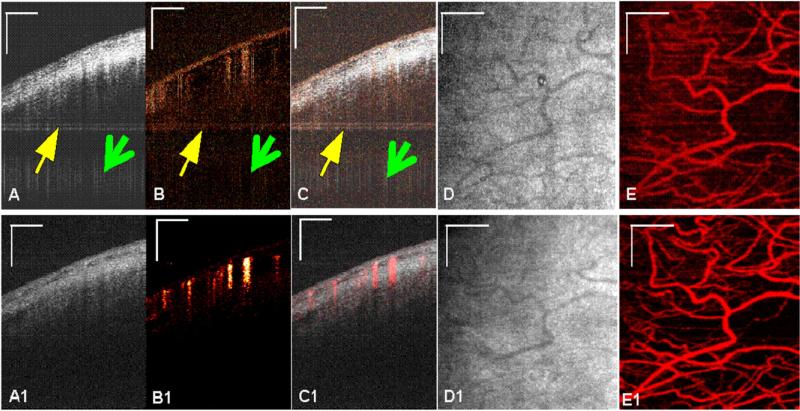
The effect of applying the phase-stabilization method before SSpvOCA processing is shown on B-scans acquired from sclera (figure 3). The intensity images are shown in figures 3(A) and (A1) and the corresponding pv images (figures 4(B) and (B1) have the same dimensions. 2D median and Gaussian filters (3 × 10 pixels) were used for noise reduction. In figure 3(B) (top panel), the pv image demonstrates that when the phase-stabilization method was not implemented, there were horizontal (pointed by yellow arrow) as well as vertical (pointed by green arrow) phase-artifact lines throughout the B-scan, resulting in a noisy vasculature map derived from the detected blood-flow. These artifacts are, however, absent when the phase-stabilization method was used as shown in figure 3(B1). The same effect can be also observed on en face projection images in figures 3(E) and (E1).
Figure 3.
In vivo images of human sclera (away from limbus) using SSpvOCA. Top and bottom panels show images before and after phase stabilization, respectively (A) and (A1): Average intensity image of three B-scans (B) and (B1), phase-variance processed image using phase data from the same three B-scans (C) and (C1), composite image of (A) and (B), (D), (D1) intensity projection image of (A), (E) and (E1) phase variance projection of (B). Scale bar: 0.5 mm.
Figure 4.
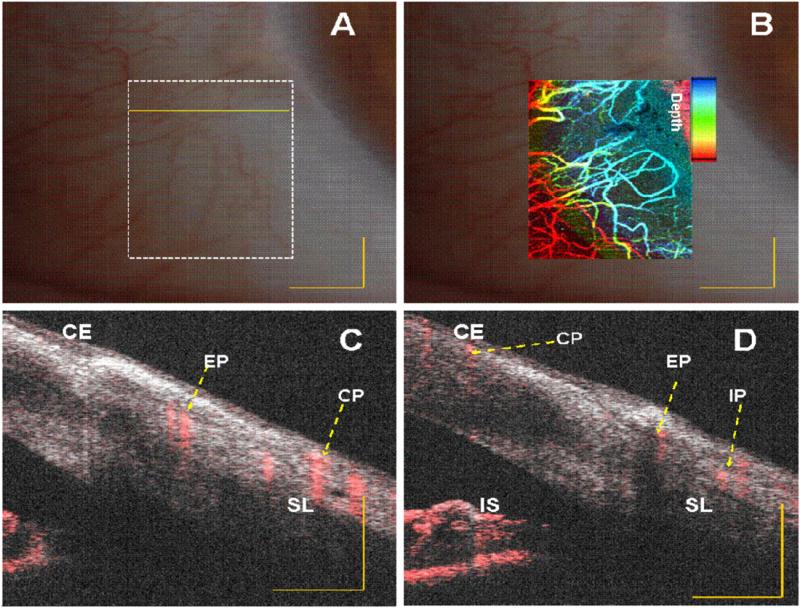
In vivo vasculature image of human limbus (corneo–scleral junction) captured with slit lamp imaging system of a normal subject. (A) and (B) Embedded image of the same region (white dotted rectangle in (A)) with slit lamp and depth color-coded phase-variance imaging; (C) and (D) composite (intensity and phase variance) B-scans corresponding to different B-scans marked as yellow continuous and dotted line in (A), respectively. CE: corneal epithelium, SL: Sclera, IS: Iris stroma, CP: conjunctival plexus; EP: episcleral plexus; IP: intrascleral plexus. Scale bar: 1 mm.
3. Results and discussion
3.1. Comparison between SSpvOCA and slit lamp images
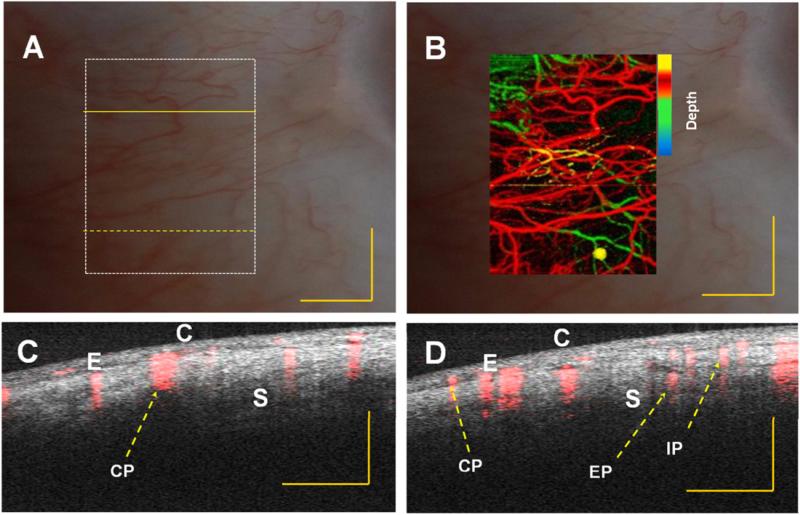
Comparisons between depth color-coded SSpvOCA images with normal slit lamp images of the limbal and scleral region of the eye are presented in figures 4 and 5. The corneo–scleral junction can be seen more clearly with our system. Vertical stripes across the image come from the vasculature in the sclera (blood vessel shadowing effect). Enhanced penetration of light at the 1060 nm wavelength range enables visualization of deeper tissue structures such as the ciliary body. Additionally, the pigmented posterior layer of the iris is highly scattering and can be easily observed.
Figure 5.
In vivo vasculature image of human sclera region (away from limbus) from a normal subject captured with slit lamp imaging system (A) and (B). Embedded image of the same region (white dotted rectangle in (A)) with slit lamp and depth color-coded phase-variance imaging; (C) and (D) composite (intensity and phase variance) B-scans corresponding to different locations denoted by yellow continuous and dotted lines in (A), respectively. C: conjunctiva, E: episclera and S: sclera, CP: conjunctival plexus; EP: episcleral plexus; IP: intrascleral plexus. Scale bar: 1 mm.
The blood supply of the limbus area originates from the anterior ciliary artery (not shown in figure 4) which divides to form the conjunctival plexus (CP), the episcleral plexus (EP) and the intrascleral plexus (IP). Figures 4(C) and (D) and 5 (C)and (D), present a cross-sectional composite (intensity and blood flow) image obtained using the PVC calculation. In this image we can identify the CP, EP and IP regions. In both images, superposition of the microstructural (intensity) and microvascular images better illustrate the spatial location of the blood flow.
Structures beneath blood vessels are shadowed (figures 4(C) and (D) due to strong absorption of the light which is characteristic of vessels in OCT images. SSpvOCA (figures 4(B) and 5(B) provides better detail of micro-vasculature compared to slit-lamp images (figures 4(A) and 5(A). The color-to-depth correspondence of the depth color-coded images (figures 4(B) and 5(B)) was provided in later sections (3.2 and 3.3). The blood supply to this region is dense and derived from the anterior ciliary arteries. The most superficial layer of vessels namely, the CP, overlies these structures. The vessels in the limbus merge with the conjunctival vessels and with other members of the same plexus. The deep episcleral capillary network is closely adhered to the sclera in the visceral layer of Tenon's capsule (4 (C) and (D)).
Where there is no flow, the lack of PVC signal creates darker regions within non-scattering media such as lymph or aqueous. These vessels do not produce shadows because there is no absorption.
3.2. 2D and 3D imaging of scleral vascular network
The posterior opaque sclera occupies five-sixths of the globe with a radius of curvature of 12 mm. There is variation in scleral thickness, the thickest part is near the optic nerve (1 mm) and it gradually decreases at the equator (0.4 to 0.5 mm). The scleral thickness in the area adjacent to the limbus is 0.83 mm. The episclera (thickness nearly 1 mm near the limbus area), or Tenon's capsule, is a thin layer containing blood vessels that provides metabolites to the sclera [29, 30]. The sclera region (away from limbus) was imaged and the interface of tissue was segmented. After that, the entire data set was flattened to perform depth sectioning (for sclera imaging only). Projection images from data at different depths are shown in figure 7.
Figure 7.
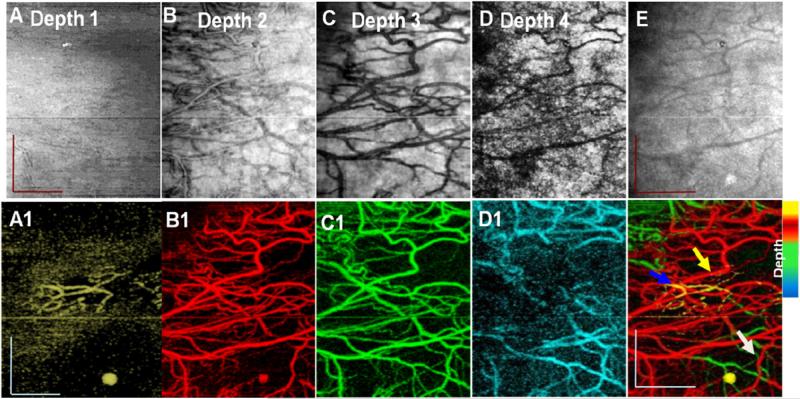
En face projection images from intensity (B), (C), (D) and (E) and phase variance (B1), (C1), (D1) and (E1) data sets showing vascular networks in conjunctiva (depth 1, ~ 0.3 mm, yellow), episclera (depth 2; ~ 0.44 mm, red), sclera (depth 3; ~ 0.43 mm, green) and deep sclera (depth 4; ~ 0.88 mm, cyan) respectively, obtained from figure 6(A). Total volume projection (2 × 2.5 mm2) of structural images (A) and phase-variance (E1) OCT scleral layers, Scale bar: 1 mm. White arrow, episcleral vein; yellow arrow, recurrent vessel; and blue arrow, SCV: superficial conjunctival vessel. Scale bar: 0.7 mm.
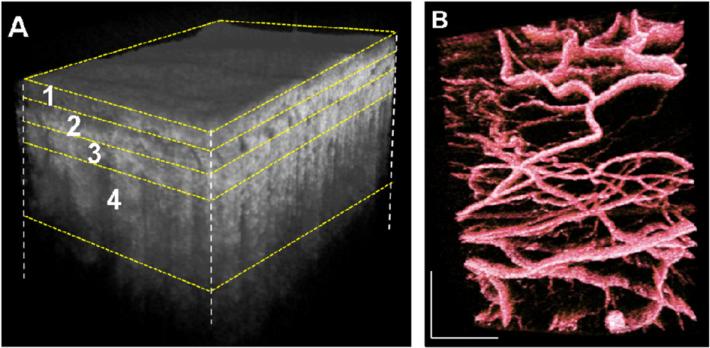
The total volume was manually segmented based on the literature [29, 30] and, as mentioned above, in four layers namely conjunctiva (~0.3 mm, figure 6(A) layer 1), episclera (~0.44 mm 6(A) layer 2), sclera (~0.43 mm 6(A) layer 3) and deep sclera (~0.88 mm 6(A) layer 4). Corresponding projection maps of microstructure and blood flow are also presented in figures 7(A)–(D) and (A1)–(D1), respectively. Different layers contain different vasculature networks. The superficial vascular plexus of the conjunctiva is also shown in figure 7.
Figure 6.
(A) Three-dimensional reconstruction of sclera after flattening. (B) 3D volume rendering of vasculature layers in false color scale. The volume size was 2 × 2.5 × 2.6 (x–y–z) mm3.
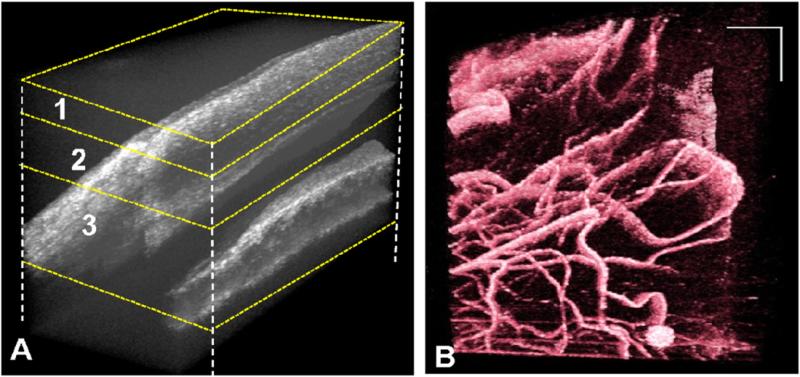
3D representations (figures 6 and 8) with projection images of different layers (figures 7 and 9) of the micro-vasculature and microstructure were also generated. The blood vessels in the sclera form a compact reticular arrangement, observed in figure 7 (D1). However, shadows from overlying vessels and the low resolution of the system limit the depth that may be visualized with this arrangement.
Figure 8.
(A) Three-dimensional reconstruction of limbus. (B) 3D volume rendering of vasculature in false color. The volume size was 2 × 2 × 2.6 (x–y–z) mm3.
Figure 9.
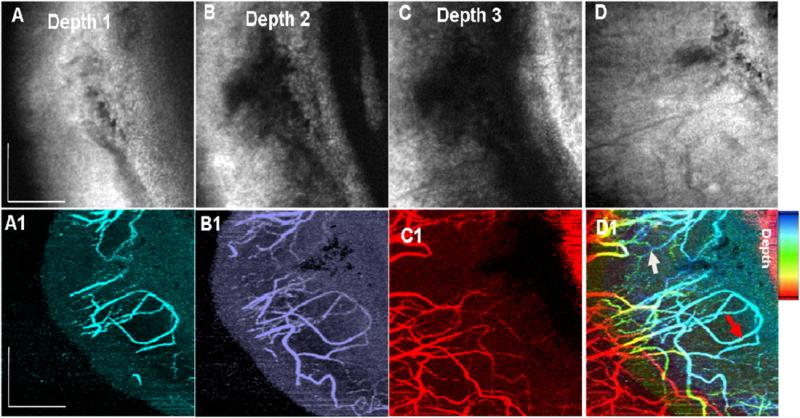
En face projection images from intensity (B), (C) and (D) and phase variance (B1), (C1) and (D1) data sets showing vascular networks in Depth 1 (0.4 mm, cyan), 2 (0. 68 mm, blue) and 3 (1.14 mm, red), respectively, for figure 8(A). Total projection of structural images is (D) and (D1) represents the projection image (2 × 2 mm2) of phase-variance data OCT scleral layers. White arrow: recurrent vessel (RV) within the conjunctival layer, red arrow: episcleral vein. Scale bar: 0.7 mm.
3.3. 2D and-3D imaging of limbus vascular network
We also performed 3D imaging of limbal structures. This region consists of thinner and compact vessels compared to those in the scleral region [30]. To reveal better PVC for smaller vessels at the limbus, a 2 × 2 mm scanning area was used. The 3D volume rendering of microstructure and blood vessels are shown in figure 8. Here, the entire data set was not flattened to perform depth sectioning due to its complex structure. However, projection images from data at different depths are shown in figure 9. Again, total volume was manually segmented based on the literature [29, 30] in three layers, namely, cornea-conjunctiva junction (~0.4 mm, figures 8(A) and 9(A) layer 1), cornea–conjunctiva–episcleral junction (~0.68 mm 8(A) and 9(A) layer 2) and conjunctiva–sclera–trabecular–iris junction (~1.14 mm 8(A) and 9(A) layer 3). Corresponding projection maps of microstructure and blood flow are also presented in figure 9(A)–(C) and (A1)–(C1), respectively.
A better visualization of Schlemm's canal was presented in our previous work [6]. However, in the current work, it appears as a dark band in the projection image (figure 9) due to clear and non-scattering aqueous fluid. The large empty spaces may be cysts. Cystic structures may be also related to the natural aqueous regulatory system. The deeper layers show different vasculature patterns (figures 9(A)–(C)).
A fraction of the CP consists of TV that reach the palisades of Vogt to supply the peripheral corneal arcades, observed in figure 9(D1). Another part of the CP is comprised of recurrent vessels, which run posteriorly to supply the perilimbal area, and can be observed in the microvasculature across the conjunctival area. The IP extends deep into the area around Schlemm's canal to supply the middle and deep sclera. Blood is transported by a fine venous network to the limbus via the episcleral veins. The largest blood vessel, in figures 7(D1) and 9(D1), most likely corresponds to an episcleral vein and connects to Schlemm's canal via the aqueous vein. However, terminal vessels (TV, located at limbus) were not observed clearly, perhaps due to low resolution of the system and low sampling density of the B-M scanning protocol.
We demonstrated that anterior segment SSpvOCA provides 3D microstructural and microvascular images of the anterior segment of the eye simultaneously, without the use of exogenous contrast agents. The microstructural images reveal different features for several tissue layers. After some calibration, it is possible to quantify several biometric parameters such as the angle opening distance and the trabecular–iris space area [19]. The SSpvOCA images provide visualization of diverse vessel patterns at different layers, including the episcleral vein distribution. Composite images (the structural and vascular information) help to locate microcirculation within different tissue layers and structures, and to map the aqueous outflow pathway from in vivo human subjects. However, the current SSpvOCA system has some limitations, including axial resolution and scan size; increasing them may help to visualize the entire outflow. Shadows from the superficial blood vessels significantly influence the image quality of the deeper vessels.
Our system has the potential to detect abnormalities of the aqueous outflow system that may precede development of glaucoma, an irreversible and progressive optic neuropathy associated with visual field loss. The information about iridocorneal angle and the aqueous outflow system may help the assessment and concurrent management of primary angle-closure glaucoma. This system may provide additional valuable information such as fibrotic thickening and neovascularization, which are important for post-surgical management of glaucoma [22, 23, 25, 26]. An additional application of our system will be to study the microcirculation in the corneal arcades and palisade of Vogt, which contribute to conjunctival, corneal and sclera diseases.
4. Conclusion
We present in vivo, noninvasive, deep penetration volumetric imaging of limbus and sclera using a swept source phase variance optical coherence angiography system. It allows detailed visualization of vascular capillary networks comparable to FA or slit-lamp image without the need for exogenous contrast agents. It also allows the generation of microcapillary perfusion maps with depth color-coding. This enables qualitative presentation of vascular networks in the anterior segment of the eye. It promises to provide valuable information about its changes in health and disease during and after corneal as well as glaucoma surgery.
Acknowledgments
We gratefully acknowledge the contributions of Susan Garcia, VSRI, University of California, Davis, USA. This research was supported by the National Eye Institute (R01 EY 024239) and DST- Govt. of India (IDP/MED/10/2010).
References
- 1.Huang D, et al. Optical coherence tomography. Science. 1991;254:1178–81. doi: 10.1126/science.1957169. [DOI] [PMC free article] [PubMed] [Google Scholar]
- 2.Drexler W, Fujimoto JG, editors. Optical Coherence Tomography Technology and Applications. Springer; Berlin-Heidelberg: 2008. [Google Scholar]
- 3.Cornea/Anterior Segment OCT SS-1000 . CASIA. Tomey Corp.; Nagoya, Japan: 2014. www.tomey.com/Products/OCT/SS-1000CASIA.html. [Google Scholar]
- 4.Poddar R, et al. In vitro 3D anterior segment imaging of lamb eye with extended depth range swept source optical coherence tomography. J. Opt. Laser Technol. 2014;67:33–7. [Google Scholar]
- 5.Potsaid B, et al. Ultrahigh speed 1050 nm swept source/fourier domain OCT retinal and anterior segment imaging at 100 000 to 400 000 axial scans per second. Opt. Express. 2010;18:20029–48. doi: 10.1364/OE.18.020029. [DOI] [PMC free article] [PubMed] [Google Scholar]
- 6.Poddar R, et al. Three-dimensional anterior segment imaging in patients with type 1 Boston Keratoprosthesis with switchable full depth range swept source optical coherence tomography. J. Biomed. Opt. 2013;18:086002. doi: 10.1117/1.JBO.18.8.086002. [DOI] [PMC free article] [PubMed] [Google Scholar]
- 7.Makita S, et al. Optical coherence angiography. Opt. Express. 2006;14:7821–40. doi: 10.1364/oe.14.007821. [DOI] [PubMed] [Google Scholar]
- 8.Baumann B, et al. Total retinal blood flow measurement with ultrahigh speed swept source/Fourier domain OCT. Biomed. Opt. Express. 2011;2:1539–52. doi: 10.1364/BOE.2.001539. [DOI] [PMC free article] [PubMed] [Google Scholar]
- 9.Braaf B, et al. Phase-stabilized optical frequency domain imaging at 1 μm for the measurement of blood flow in the human choroid. Opt. Express. 2011;19:20886–903. doi: 10.1364/OE.19.020886. [DOI] [PubMed] [Google Scholar]
- 10.Hong Y, et al. High-penetration swept source Doppler optical coherence angiography by fully numerical phase stabilization. Biomed. Opt. Express. 2012;20:2740–60. doi: 10.1364/OE.20.002740. [DOI] [PubMed] [Google Scholar]
- 11.Hendargo HC, et al. Doppler velocity detection limitations in spectrometer-based versus swept-source optical coherence tomography. Biomed. Opt. Express. 2011;2:175–88. doi: 10.1364/BOE.2.002175. [DOI] [PMC free article] [PubMed] [Google Scholar]
- 12.Szkulmowski M, et al. Flow velocity estimation using joint spectral and time domain optical coherence tomography. Opt. Express. 2008;16:6008–25. doi: 10.1364/oe.16.006008. [DOI] [PubMed] [Google Scholar]
- 13.Choi WJ, et al. Choriocapillaris and choroidal microvasculature imaging with OCT angiography. PLoS One. 2013;8:81499–503. doi: 10.1371/journal.pone.0081499. [DOI] [PMC free article] [PubMed] [Google Scholar]
- 14.Tan O, et al. Dual-angle protocol for Doppler optical coherence tomography to improve retinal blood flow measurement. Trans. Vis. Sci. Tech. 2014;3:6. [Google Scholar]
- 15.Dai C, et al. Absolute retinal blood flow measurement with a dual-beam Doppler optical coherence tomography. Invest. Ophthalmol. Vis. Sci. 2013;54:7998–8003. doi: 10.1167/iovs.13-12318. [DOI] [PMC free article] [PubMed] [Google Scholar]
- 16.Doblhoff-Dier V, et al. Measurement of the total retinal blood flow using dual beam Fourier-domain Doppler optical coherence tomography with orthogonal detection planes. Biomed. Opt. Express. 2014;5:630–42. doi: 10.1364/BOE.5.000630. [DOI] [PMC free article] [PubMed] [Google Scholar]
- 17.Bukowska DM, et al. Assessment of the flow velocity of blood cells in a microfluidic device using joint spectral and time domain optical coherence tomography. Optics Express. 2013;21:24025–38. doi: 10.1364/OE.21.024025. [DOI] [PubMed] [Google Scholar]
- 18.Chan AC, et al. Maximum likelihood Doppler frequency estimation under decorrelation noise for quantifying flow in optical coherence tomography. IEEE Trans. Med. Imaging. 2014;33:1313–23. doi: 10.1109/TMI.2014.2309986. [DOI] [PubMed] [Google Scholar]
- 19.Kim DY, et al. In vivo volumetric imaging of human retinal circulation with phase-variance optical coherence tomography. Biomed. Opt. Express. 2011;2:1504–13. doi: 10.1364/BOE.2.001504. [DOI] [PMC free article] [PubMed] [Google Scholar]
- 20.Poddar R, et al. In vivo imaging of human blood circulation in the chorioretinal complex with new phase stabilized 1 μm swept-source phase-variance optical coherence tomography (pv-SSOCT) J. Biomed. Opt. 2014;19:126010. doi: 10.1117/1.JBO.19.12.126010. [DOI] [PMC free article] [PubMed] [Google Scholar]
- 21.Zhao Y, et al. Doppler standard deviation imaging for clinical monitoring of in vivo human skin blood flow. Opt. Lett. 2000;25:1358–60. doi: 10.1364/ol.25.001358. [DOI] [PubMed] [Google Scholar]
- 22.Johnstone M, et al. Pulsatile flow into the aqueous veins: manifestations in normal and glaucomatous eyes. Exp. Eye Res. 2011;92:318–27. doi: 10.1016/j.exer.2011.03.011. [DOI] [PMC free article] [PubMed] [Google Scholar]
- 23.Kagemann L, et al. 3D visualization of aqueous humor outflow structures in-situ in humans. Exp. Eye Res. 2011;93:308–15. doi: 10.1016/j.exer.2011.03.019. [DOI] [PMC free article] [PubMed] [Google Scholar]
- 24.Li Peng, et al. In vivo microstructural and microvascular imaging of the human corneo-scleral limbus using optical coherence tomography. Biomed. Opt. Express. 2012;2:3109–18. doi: 10.1364/BOE.2.003109. [DOI] [PMC free article] [PubMed] [Google Scholar]
- 25.Ren J, et al. Ex vivo optical coherence tomography imaging of collector channels with a scanning endoscopic probe. Invest. Ophthalmol. Vis. Sci. 2011;52:3921–25. doi: 10.1167/iovs.10-6744. [DOI] [PubMed] [Google Scholar]
- 26.Grieshaber MC, et al. Clinical evaluation of the aqueous outflow system in primary open-angle glaucoma for canaloplasty. Invest. Ophthalmol. Vis. Sci. 2010;51:1498–504. doi: 10.1167/iovs.09-4327. [DOI] [PubMed] [Google Scholar]
- 27.Laser Institute of America American National Standard for Safe Use of Lasers: ANSI Z136.1. 2007 [Google Scholar]
- 28.Fingler J, et al. Volumetric microvascular imaging of human retina using optical coherence tomography with a novel motion contrast technique. Opt. Express. 2009;17:22190–200. doi: 10.1364/OE.17.022190. [DOI] [PMC free article] [PubMed] [Google Scholar]
- 29.Gold DH, Lewis RA. Clinical Eye Atlas. 2nd edn Oxford University Press; Oxford: 2011. p. 298. [Google Scholar]
- 30.Vurgese S, et al. Scleral thickness in human eyes. PloS One. 2012;7:1–9. doi: 10.1371/journal.pone.0029692. [DOI] [PMC free article] [PubMed] [Google Scholar]


