

Abstract
The scope of lung ultrasound (LUS) in emergency and critical care settings has been studied extensively. LUS is easily available at bedside, free of radiation hazard and real time. All these features make it useful in reducing need of bedside X-rays and CT scan of chest. LUS has been proven to be superior to the bedside chest X-ray and equal to chest CT in diagnosing many pleural and lung pathologies. The first International Consensus Conference on Lung Ultrasound (ICC-LUS) has given recommendations for unified approach and language in major six areas of LUS. The LUS diagnosis is to be given after integration of findings of both lungs. The BLUE protocol is first LUS-based systematic approach in diagnosing pleural and lung pathologies. The protocol suggested in this article includes history and conventional clinical assessment along with LUS features.
KEY WORDS: Interstitial syndrome, lung ultrasound, pneumothorax, pulmonary edema
LUNG ULTRASOUND: PRESENT AND FUTURE
Use of ultrasonography (USG) in emergency department, critical care and cardiac care units is becoming popular. It is now considered as “third eye” of health care providers in these units. This imaging modality is easily available at bedside, real time and free of radiation hazards in comparison to conventional imaging modalities of lung (Bedside chest radiography and lung computed tomography) in critically ill patients. Lung ultrasound (LUS) complements conventional assessment methods and other imaging modalities of lung.[1,2] Growing application of LUS in different settings has led to difference in approach and nomenclature. The recently published consensus statements by the international panel of experts in the first International Consensus Conference on Lung Ultrasound (ICC-LUS) provide evidence-based recommendations on “point-of-care” LUS with a promise of update every four years or whenever there is major change in evidence. These recommendations provide unified approach and language for six major areas of LUS (terminology, technology, technique, clinical outcomes, cost effectiveness, and future research).[3]
Ultrasound machine and probe
The ultrasound imaging process and interpretation is different from radiographic imaging where x-ray beams are used. A basic understanding of ultrasound generation, image formation by reflection/echo, artifacts and factors affecting imaging are must for accurate interpretation.[4] The ultrasound machine should be portable, lightweight and with facility to store images and videos. Ideally a small footprint convex tip probe with 5-11 MHz frequency is best suited because it can be placed easily in intercostal space. A high-frequency linear probe (6-13 MHz) is very useful in assessment of soft tissues, ribs, pleura and lung sliding. A low-frequency (3-5 MHz) convex probe is useful in assessment of depth for effusions, consolidations and extension of B-Lines. At present there is no specific ultrasound machine mode for assessment of lung. A specific mode and probe should be selected based on lung findings and physician preference with optimization of the settings recommended for lung imaging.[2,5]
Ultrasound probes are potential source for transmission of nosocomial infection hence a strict and well-defined decontamination policy is must for prevention.[2,5]
Patient position
Patient is usually examined in supine/semi recumbent position with arm abducted to facilitate examination of anterior and lateral chest wall. Lateral decubitus position or minimal tilting with upper limb moved anteriorly is required to expose lateral and posterior chest wall for examination. Dorsal region of lower lobes are better appreciated in lateral decubitus position.[2,6]
Assessment areas
Ideally USG probe should be placed at the same places in the intercostal spaces where stethoscope is put for auscultation.[6] Each hemithorax is usually divided into anterior, lateral and posterior zones/regions by anterior and posterior axillary lines. Each zone/region is further divided into upper and lower regions. Dorsal region of upper lobes cannot be assessed easily because scapula does not allow acoustic window. A systematic and comprehensive approach for assessment is needed to avoid mistakes.[2,5,6] Consensus statement on interstitial syndromes has defined eight region Sonographic technique of examination. 28-scanning-site technique has been suggested for more precise quantification of interstitial syndrome.[3,7]
Reporting and archiving of images
Various sample formats are available in literature. A comprehensive recording of findings in each zone/region helps in construction of three-dimensional picture of lungs. Storage of images and video clips (minimal clip duration set to include at least one respiratory cycle) with a brief description of USG machine setting, probe and patient condition in report help in monitoring, comparison and research.[5,8]
One format for assessment and reporting is shown in Figure 1. Each hemithorax is divided into three regions (anterior, lateral and posterior) by anterior and posterior axillary lines. Posterior regions also include paravertebral areas. This format is representation of the surface anatomy of the lung and its lobes. The USG probe is placed longitudinally over intercostal space. USG assessment begins with the anterior region in the mid-clavicular line from above in each intercostal space till diaphragm is identified. In the same way assessment is done in mid-axillary, linea scapularis and paravertebral areas with suitable position. If abnormality is noted in any intercostal space, detailed assessment is made in that area. This surface anatomy-based format can help in localizing atelectasis, lobar pneumonia and other abnormalities to the corresponding lobe. USG diagnosis is given after complete analysis of USG findings of the both lungs.
Figure 1.

Report form
Ultrasound imaging of lung
When ultrasound beam travels through a medium reflection, refraction, and attenuation happen to it. Reflection of ultrasound wave is called echo which is the basis of ultrasound imaging. This reflection occurs at the boundary of the two materials (e.g., soft tissue and bone). The fraction of reflection from the incident ultrasound wave depends on the difference in the acoustic impedance of the materials. If difference is small a weak echo is produced and most of the ultrasound waves will pass through the second medium. A strong echo is produced when difference is large hence sometimes (e.g., soft tissue and air/bone) not enough ultrasound is left to image beyond the tissue interface. Weak reflection/echo appears dark (anechoic, hypoechoic) and strong echo appears white (hyperechoic) in image.[4]
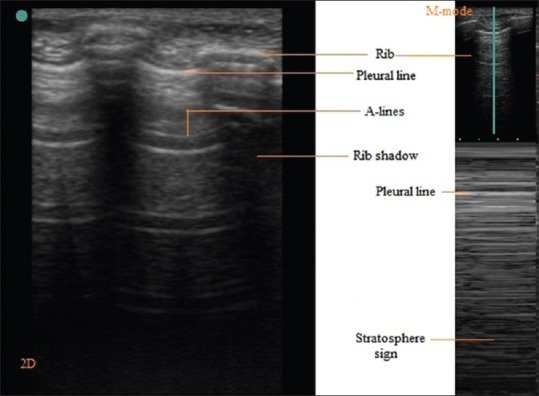
The USG probe is placed longitudinally and perpendicular to the ribs over intercostal space using USG gel as coupling medium to the skin because presence of air in between can reflect back >99.9% of the ultrasound beam. As the ultrasound beam travels through skin, subcutaneous tissue and muscles, it reaches soft tissue-rib and visceral pleura-lung air boundaries. At soft tissue-rib boundary the USG wave is almost totally reflected back hence rib appear as convex white (hyperechoic) bow like line followed by posterior acoustic shadow beyond boundary. At the visceral pleura-lung air boundary (seen 0.5 cm deeper and between upper and lower ribs in adults) >99.9% of the ultrasound beam are reflected back and no more ultrasound beams are left to image beyond.[2,4,6,9] This boundary appears as white band (lung/pleural line) measuring up to 2 mm.[10] Movement of visceral pleura over parietal pleura produces lung sliding and this white band appears dynamic. Lung sliding is the depiction of a regular rhythmic movement synchronized with respiration that occur between the parietal and visceral pleura that are either in direct apposition or separated by a thin layer of intrapleural fluid. Lung sliding is an indicator of ventilation in the inspected area. Beyond this pleural line in normally aerated lung, artifacts are seen in image. These are reverberation artifacts, produced by bouncing of echo between pleural line and probe. These motionless, regularly spaced (equal to the distance between the skin and the pleural line) and gradually fading horizontal white lines which resemble pleural line are called A-Lines. The characteristic appearance of two ribs and pleural line in between is called the bat sign. In time motion mode (M mode), the structures till parietal pleura appear as horizontal lines and beyond this sandy pattern representing lung sliding. This characteristic appearance is called the seashore sign. The presence of pleural line, lung sliding, A-Lines in 2D and seashore sign in M mode are characteristic of aerated lung [Figure 2].[2,6,9]
Figure 2.
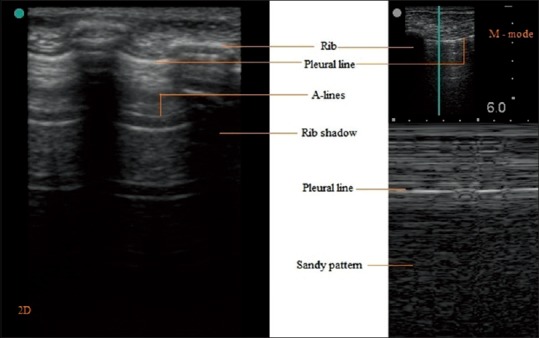
2D and M mode
The diaphragm [Figure 3a and b] can appear as a hypoechoic line (muscle) sandwiched between two hyperechoic lines [peritoneum and pleura; Figure 3a]. It is best visualized by subcostal placement of probe and using liver and spleen as acoustic window. Right hemi-diaphragm is seen easily because liver provides bigger acoustic window.[10,11]
Figure 3.
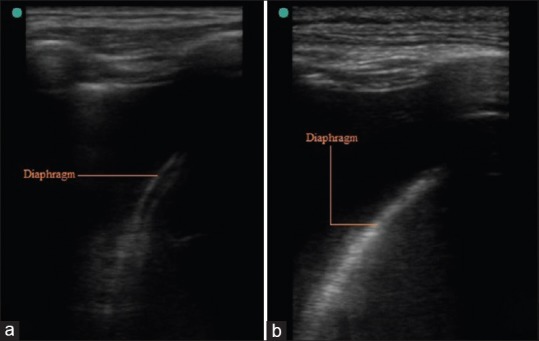
(a) Hypoechoic Diaphragm, (b) Hyperechoic Diaphragm
Image characteristics in lung pathologies
Various conditions and diseases affect lung imaging [Table 1]. Presence of excessive subcutaneous fat, tissue edema and subcutaneous emphysema prevent imaging. Identification of ribs, posterior acoustic shadowing of ribs, pleural line is important. Usually there is a thin layer of intrapleural fluid between parietal and visceral pleura which is not visible.[5,12] Pleural lines thickening, coarse appearance and irregularities are considered abnormal and are present in certain lung diseases.[3] There is possibility of collection of fluid or air in intrapleural space which produce characteristic image and artifacts described later. It is very clear that imaging beyond visceral pleural line depends on aeration of lung. In certain diseases like lobar pneumonia, atelectasis there is total loss of aeration and involved sub-pleural lung appears echo-poor region or tissue like-echotexture. The accumulations of fluid in subpleural interstitial, alveolar spaces alter air-fluid ratio and produce characteristic artifact called B-lines. These B-Lines are also produced by thickening of subpleural intralobular or interlobular septum by fibrosis. The anatomic and physical basis of B-lines is not known with certainty at this time. The B-lines are defined as discrete laser-like vertical hyperechoic reverberation artifacts that arise from the pleural line (previously described as “comet tails”), extending to the bottom of the screen without fading, and moving synchronously with lung sliding [Figure 4a]. The presence of multiple B-lines is the sonographic sign of lung interstitial syndrome. A positive region is defined by the presence of three or more B-lines in a longitudinal plane between two ribs [Figure 4b]. Multiple B-lines which are 7 mm apart characterize subpleural interlobular septal oedema or thickening. Closely spaced (≤3 mm) and coalescent B-lines suggest subpleural fluid filled alveoli which correspond to ground glass opacities in CT. The term “B-pattern” should be used in the description of multiple B-lines in patients with interstitial syndrome [Figure 3].[2,3,5,6,12,13,14] Isolated positive scan for B-lines should be interpreted carefully in laterobasal areas because these can be present in the radiographically normal lung.[15]
Table 1.
Image characteristics in lung pathologies*
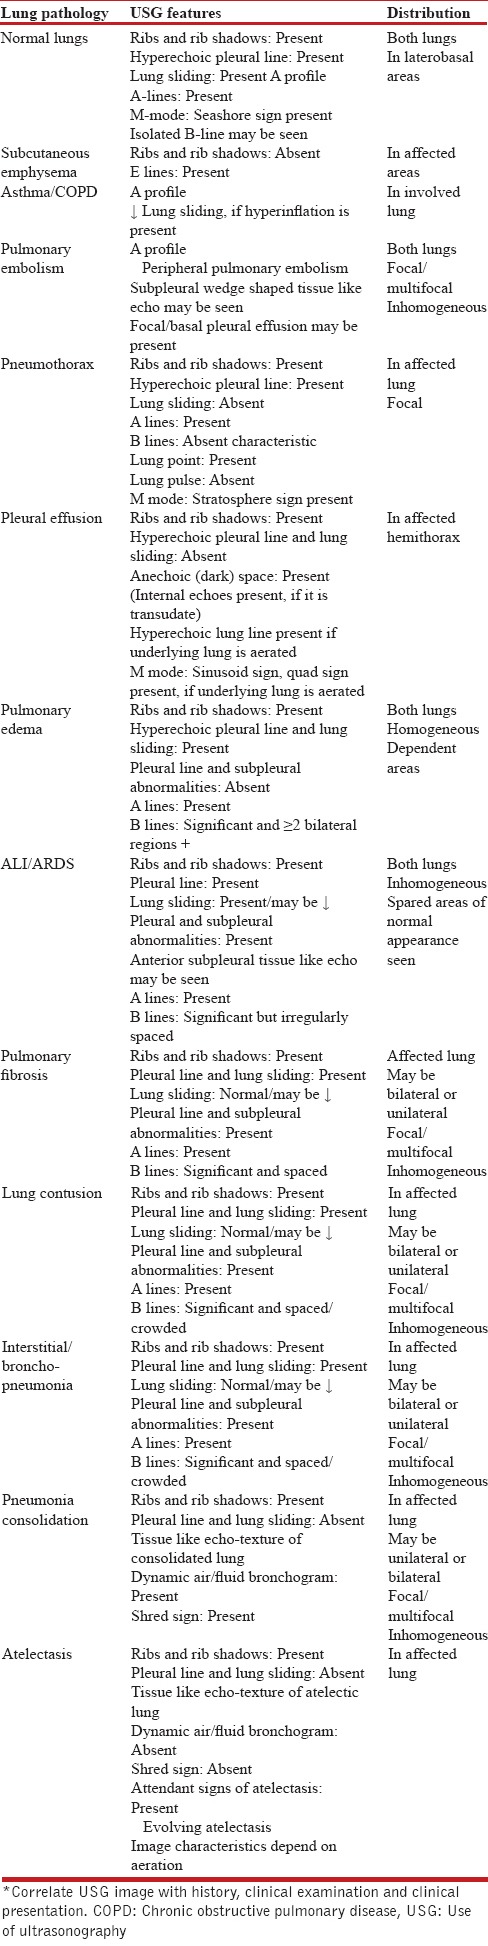
Figure 4.
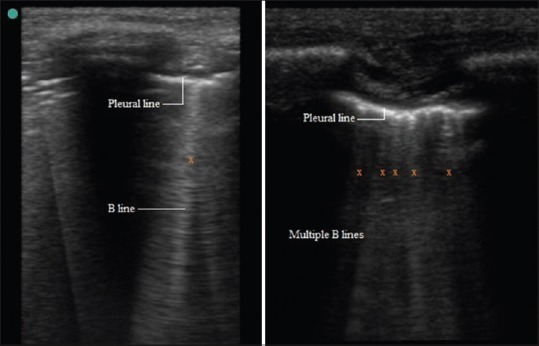
B lines
Pneumothorax
There is collection of air between visceral and parietal pleura in pneumothorax. This results in the absence of lung sliding. A-Lines are seen beyond hyperechoic parietal pleura-air boundary in image. In M mode only horizontal lines are seen because dynamic pleural sliding is absent. This characteristic pattern is called stratosphere sign [Figure 5]. The presence of B-Line rules out pneumothorax because this artifact arises at visceral pleura-lung boundary only. The presence of Lung point or the absence of Lung pulse confirms the diagnosis of pneumothorax. Lung point is defined as the absence of any sliding or moving B-lines at a physical location where this pattern consistently transitions into an area of sliding, which represents the physical limit of pneumothorax as mapped on the chest wall. In M mode Lung point appears as the transition zone where stratosphere and seashore sign appear and disappear. The lung pulse refers to the subtle rhythmic movement of the visceral upon the parietal pleura with cardiac oscillations.[3,16]
Figure 5.
Pneumothorax
The absence of lung sliding, B-Lines, lung pulse and presence of Lung point are four characteristic sonographic signs of pneumothorax. LUS accurately rules in and also rules out the diagnosis of pneumothorax than supine anterior chest radiography. LUS compares well with computerized tomography in assessment of pneumothorax extension.[3]
Pleural effusion
The appearance of effusion between parietal and visceral pleura in ultrasound image depends on its nature. Most transudates and some exudates appear as anechoic space between pleura because at pleura-effusion boundary negligible echo is produced [Figure 6a]. The presence of internal echoes in this anechoic space is suggestive of exudate or hemorrhage which can be confirmed by thoracentesis [Figure 6b]. The visceral pleura-lung boundary appears as hyperechoic line in normally aerated lung. In a free effusion and aerated lung, the variation in interpleural distance during respiratory cycle is easily visualized in M mode as sinusoid movement of visceral pleura and called sinusoid sign. Minimal pleural effusion is delineated during expiration between parietal pleura and lung in 2D echo and M mode; this is called as quad sign. The posterior axillary line above diaphragm is the optimal site for detection of nonloculated pleural effusion.[3,5,6,17,18] Various ultrasound-guided approaches have been suggested for assessment of volume of pleural effusion. Interpleural distance of ≥ 50 mm between posterior chest wall and lung is predictive of pleural effusion ≥ 500 mL.[19,20] The LUS is superior to supine chest X-ray in diagnosis of pleural effusion and distinguishing it from other causes of white opacities in chest X-ray. The LUS is as good as CT in diagnosis of pleural effusion.[3]
Figure 6.
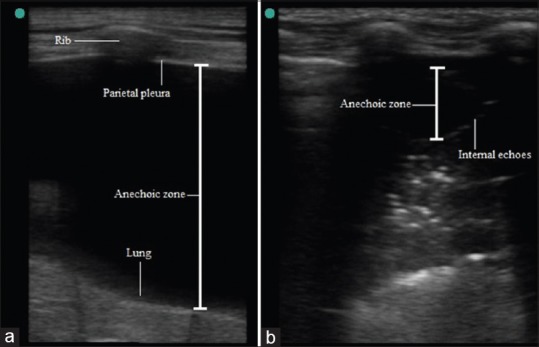
(a) Pleural effusion (Anechoic zone), (b) Internal echoes in anechoic zone
A hydropneumothorax can be identified by dynamic air-fluid margin, with features of pneumothorax above air fluid level. Sometimes air in pleural space may obscure underlying effusion during inspiration; this is called “curtain sign”.[10,21]
Hydrostatic/Cardiogenic pulmonary edema
Septal or alveolar edema caused by cardiac or other hydrostatic transudate pulmonary edema present with sonographic picture of alveolar-interstitial edema. Presence of two or more positive regions for homogeneously distributed B lines bilaterally in eight zone LUS examination without pleural line and subpleural abnormalities is suggestive of diagnosis. Regularly spaced B lines suggest septal or interstitial edema. Crowded or coalescent B lines are suggestive of alveolar edema.[3,5]
LUS has useful prognostic value in assessment of extravascular lung water in patients with dyspnea and/or chest pain.[22] It has shown role in volume assessment in patients with kidney disease requiring hemodialysis.[23]
Acute lung injury/Acute respiratory distress syndrome
In this condition, compromised alveolar capillary membrane leads to increased capillary permeability and diffuse flooding of alveoli take place. ALI/ARDS usually presents as nonhomogeneous B line positive areas in both lungs. The reduction or absence of lung sliding with pleural line abnormalities are also present. Anterior subpleural consolidations can be found. The “spared areas” of normal parenchyma are characteristic and help to differentiate it from other causes of alveolar-interstitial syndrome involving both lungs.[3,5,14]
Pulmonary fibrosis
This condition can be caused by diverse etiology. The lobular septae are thickened due to collagen deposition. Involvement of peripheral pleura is characteristic of pulmonary fibrosis. LUS can have complementary role in diagnosis, severity assessment and management. It presents as bilateral interstitial syndrome with nonhomogeneous B line positive areas. Pleural line thickening, irregularities, fragmentation and subpleural echo poor areas are also seen [Figure 7a].[3,14,24]
Figure 7.
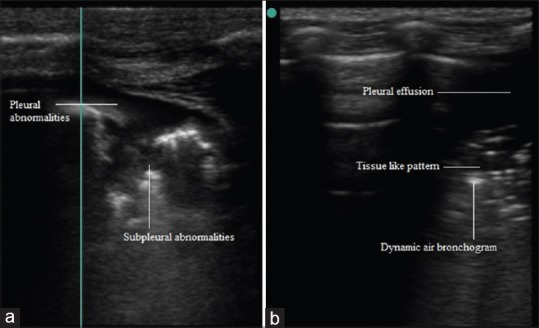
(a) Pleural and subpleural abnormalities, (b) Air bronchogram in pneumonia
Lung contusion
Blunt trauma to thorax can cause pneumothorax, hemothorax and/or lung contusion (LC). Pneumothorax and hemothorax (in pleural effusion) have been discussed above. Lung contusion can result in ARDS, pneumonia and respiratory dysfunction. The diagnosis of LC determines need of close observation. Although thoracic CT is considered gold standard in diagnosis but is not practically possible always. LUS in the setting of blunt trauma chest can help in diagnosis of LC. It can be seen as focal or multifocal asymmetrical positive areas for B lines in one or both lungs. Reduced or absent lung sliding with pleural line thickening, irregularity and subpleural tissue like pattern are seen with B lines.[3,5,25,26]
Pneumonia
The appearance in LUS depends on the relative aeration of alveoli. Subpleural echo-poor region or tissue like echo texture is seen in alveolar consolidations which reach up to pleura. Alveolar consolidation margins are irregular, serrated and blurred in depth (shred line; shred sign). Dynamic air and fluid bronchogram(s) along with shred line are characteristic of lung consolidation caused by pneumonia [Figure 7b].[6,27,28,29]
Inhomogeneous unilateral/bilateral and focal/multifocal positive areas for B lines with pleural abnormalities (thickened, fragmented pleura and subpleural consolidation) and reduced or absent lung sliding are seen in LUS in interstitial and broncho-pneumonia.[5,6]
Atelectasis
Subpleural echo-poor region or tissue like echo texture is seen in compression or obstructive atelectasis. This appearance is due to absence of peripheral lung expansion. Compression atelectasis caused by massive pleural effusion is seen as floating wedge-shaped tissue like structure.[2] The absence of dynamic air/fluid in this tissue like echo texture helps it in differentiating it from pneumonia [Figure 8a].[3,5] Loss of aeration in lung at various stages due to gradually increasing pleural effusion can be seen as compression atelectasis develops.
Figure 8.
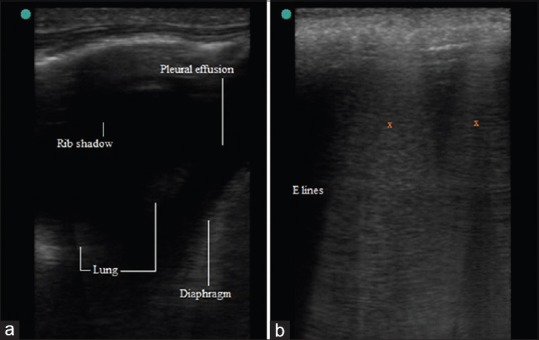
(a) Compression Atelectasis, (b) E lines
Compression or resorptive atelectasis shows early and late signs along with tissue like echo texture. Early signs are abolished lung sliding with lung pulse, standstill cupola. Residual trapped air with static air bronchogram is late sign. Air is completely absorbed subsequently.[28,30]
Subcutaneous emphysema
It poses limitation to LUS and has characteristic presence of E lines. It is a comet tail like artifact like B lines which arises from air collection in subcutaneous tissue. E lines are laser like vertical hyperechoic reverberation artifact arising from subcutaneous tissue and extending up to bottom of screen [Figure 8b]. Pleural line and bat sign is not seen because subcutaneous air prevents imaging beyond it.[31,32]
Asthma/Chronic obstructive pulmonary disease
The presence of pleural line, lung sliding, A-Lines in 2D and seashore sign in M mode in both lungs as characteristic LUS picture of aerated lung have been mentioned above. In conditions like COPD, asthma and pulmonary embolism subpleural aeration is usually not affected. Lung sliding may be reduced by hyperinflation.[5] These conditions usually present with similar LUS picture of aerated lung. The BLUE protocol has described this LUS picture as A profile and suggested a decision tree to differentiate these.[6]
Pulmonary embolism
A profile or A pattern is seen in LUS. The BLUE protocol suggests search for venous thrombosis if A profile is present. If venous thrombosis is present, diagnosis of pulmonary embolism is considered in patients with acute respiratory failure.[6] Peripheral pulmonary embolism is seen as multiple hypoechoic subpleural wedge-shaped tissue like echo texture. There can be local or basal pleural effusion also.[33,34]
Transthoracic USG can be used in diagnosis of chest wall soft tissue and bony lesions.[10,12,35] LUS is also used in pleural fluid aspiration, closed intercostal tube drainage place selection and biopsy of peripheral lesions.[10] Monitoring of recovery and effectiveness of therapy can be assessed and guided by LUS.[3,5]
The BLUE and BLUE-plus protocols have been proposed to help in diagnosis of various lung conditions.[6,36] One protocol suggests systematic LUS approach starting with identification of landmarks before identification of LUS pattern. Each region or zone is then sonographically characterized. Integration of various LUS findings in all regions/zones gives sonographic diagnosis. Finally interpretation of sonographic diagnosis is done in context with history, clinical assessment, other investigations and laboratory data.[5] One algorithm is suggested in Figure 9. History and clinical assessment are integrated with sequential interpretation of characteristic LUS findings described above.
Figure 9.

The modified protocol
The LUS is free from radiation hazard, real time and easily available at bedside. Its use in diagnosis of lung diseases is real but with some practical limitations. Importance of history taking, clinical examination cannot be undermined and one should not jump to the conclusion after seeing LUS only.
Footnotes
Source of Support: Nil
Conflict of Interest: None declared.
REFERENCES
- 1.Karabinis A, Fragou M, Karakitsos D. Whole-body ultrasound in the intensive care unit: A new role for an aged technique. J Crit Care. 2010;25:509–13. doi: 10.1016/j.jcrc.2009.07.001. [DOI] [PubMed] [Google Scholar]
- 2.Bouhemad B, Zhang M, Lu Q, Rouby JJ. Clinical review: Bedside lung ultrasound in critical care practice. Crit Care. 2007;11:205. doi: 10.1186/cc5668. [DOI] [PMC free article] [PubMed] [Google Scholar]
- 3.Volpicelli G, Elbarbary M, Blaivas M, Lichtenstein DA, Mathis G, Kirkpatrick AW, et al. International Liaison Committee on Lung Ultrasound (ILC-LUS) for International Consensus Conference on Lung Ultrasound (ICC-LUS). International evidence-based recommendations for point-of-care lung ultrasound. Intensive Care Med. 2012;38:577–91. doi: 10.1007/s00134-012-2513-4. [DOI] [PubMed] [Google Scholar]
- 4.Aldrich JE. Basic physics of ultrasound imaging. Crit Care Med. 2007;35(Suppl):S131–7. doi: 10.1097/01.CCM.0000260624.99430.22. [DOI] [PubMed] [Google Scholar]
- 5.Via G, Storti E, Gulati G, Neri L, Mojoli F, Braschi A. Lung ultrasound in the ICU: From diagnostic instrument to respiratory monitoring tool. Minerva Anestesiol. 2012;78:1282–96. [PubMed] [Google Scholar]
- 6.Lichtenstein DA, Mezière GA. Relevance of lung ultrasound in the diagnosis of acute respiratory failure: The BLUE protocol. Chest. 2008;134:117–25. doi: 10.1378/chest.07-2800. [DOI] [PMC free article] [PubMed] [Google Scholar]
- 7.Jambrik Z, Monti S, Coppola V, Agricola E, Mottola G, Miniati M, et al. Usefulness of ultrasound lung comets as a nonradiologic sign of extravascular lung water. Am J Cardiol. 2004;93:1265–70. doi: 10.1016/j.amjcard.2004.02.012. [DOI] [PubMed] [Google Scholar]
- 8.Picano E, Frassi F, Agricola E, Gligorova S, Gargani L, Mottola G. Ultrasound lung comets: A clinically useful sign of extravascular lung water. J Am Soc Echocardiogr. 2006;19:356–63. doi: 10.1016/j.echo.2005.05.019. [DOI] [PubMed] [Google Scholar]
- 9.Lichtenstein DA, Mezière GA, Lagoueyte JF, Biderman P, Goldstein I, Gepner A. A-lines and B-lines: Lung ultrasound as a bedside tool for predicting pulmonary artery occlusion pressure in the critically ill. Chest. 2009;136:1014–20. doi: 10.1378/chest.09-0001. [DOI] [PubMed] [Google Scholar]
- 10.Koegelenberg CF, von Groote-Bidlingmaier F, Bolliger CT. Transthoracic ultrasonography for the respiratory physician. Respiration. 2012;84:337–50. doi: 10.1159/000339997. [DOI] [PubMed] [Google Scholar]
- 11.Gerscovich EO, Cronan M, McGahan JP, Jain K, Jones CD, McDonald C. Ultrasonographic evaluation of diaphragmatic motion. J Ultrasound Med. 2001;20:597–604. doi: 10.7863/jum.2001.20.6.597. [DOI] [PubMed] [Google Scholar]
- 12.Mathis G. Thoraxsonography--Part 1: Chest wall and pleura. Praxis (Bern 1994) 2004;93:615–21. doi: 10.1024/0369-8394.93.15.615. [DOI] [PubMed] [Google Scholar]
- 13.Copetti R, Soldati G, Copetti P. Chest sonography: A useful tool to differentiate acute cardiogenic pulmonary edema from acute respiratory distress syndrome. Cardiovasc Ultrasound. 2008;6:16. doi: 10.1186/1476-7120-6-16. [DOI] [PMC free article] [PubMed] [Google Scholar]
- 14.Reissig A, Kroegel C. Transthoracic sonography of diffuse parenchymal lung disease: The role of comet tail artifacts. J Ultrasound Med. 2003;22:173–80. doi: 10.7863/jum.2003.22.2.173. [DOI] [PubMed] [Google Scholar]
- 15.Volpicelli G, Caramello V, Cardinale L, Mussa A, Bar F, Frascisco MF. Detection of sonographic B-lines in patients with normal lung or radiographic alveolar consolidation. Med Sci Monit. 2008;14:CR122–8. [PubMed] [Google Scholar]
- 16.Lichtenstein D, Mezière G, Biderman P, Gepner A. The “lung point”: An ultrasound sign specific to pneumothorax. Intensive Care Med. 2000;26:1434–40. doi: 10.1007/s001340000627. [DOI] [PubMed] [Google Scholar]
- 17.Yang PC, Luh KT, Chang DB, Wu HD, Yu CJ, Kuo SH. Value of sonography in determining the nature of pleural effusion: Analysis of 320 cases. AJR Am J Roentgenol. 1992;159:29–33. doi: 10.2214/ajr.159.1.1609716. [DOI] [PubMed] [Google Scholar]
- 18.Pneumatikos I, Bouros D. Pleural effusions in critically ill patients. Respiration. 2008;76:241–8. doi: 10.1159/000143108. [DOI] [PubMed] [Google Scholar]
- 19.Roch A, Bojan M, Michelet P, Romain F, Bregeon F, Papazian L, et al. Usefulness of ultrasonography in predicting pleural effusions>500 mL in patients receiving mechanical ventilation. Chest. 2005;127:224–32. doi: 10.1378/chest.127.1.224. [DOI] [PubMed] [Google Scholar]
- 20.Usta E, Mustafi M, Ziemer G. Ultrasound estimation of volume of postoperative pleural effusion in cardiac surgery patients. Interact Cardiovasc Thorac Surg. 2010;10:204–7. doi: 10.1510/icvts.2009.222273. [DOI] [PubMed] [Google Scholar]
- 21.Targhetta R, Bourgeois JM, Chavagneux R, Marty-Double C, Balmes P. ULtrasonographic approach to diagnosing hydropneumothorax. Chest. 1992;101:931–4. doi: 10.1378/chest.101.4.931. [DOI] [PubMed] [Google Scholar]
- 22.Frassi F, Gargani L, Tesorio P, Raciti M, Mottola G, Picano E. Prognostic value of extravascular lung water assessed with ultrasound lung comets by chest sonography in patients with dyspnea and/or chest pain. J Card Fail. 2007;13:830–5. doi: 10.1016/j.cardfail.2007.07.003. [DOI] [PubMed] [Google Scholar]
- 23.Vitturi N, Dugo M, Soattin M, Simoni F, Maresca L, Zagatti R, et al. Lung ultrasound during hemodialysis: The role in the assessment of volume status. Int Urol Nephrol. 2014;46:169–74. doi: 10.1007/s11255-013-0500-5. [DOI] [PubMed] [Google Scholar]
- 24.Sperandeo M, Varriale A, Sperandeo G, Filabozzi P, Piattelli ML, Carnevale V, et al. Transthoracic ultrasound in the evaluation of pulmonary fibrosis: Our experience. Ultrasound Med Biol. 2009;35:723–9. doi: 10.1016/j.ultrasmedbio.2008.10.009. [DOI] [PubMed] [Google Scholar]
- 25.Soldati G, Testa A, Silva FR, Carbone L, Portale G, Silveri NG. Chest ultrasonography in lung contusion. Chest. 2006;130:533–8. doi: 10.1378/chest.130.2.533. [DOI] [PubMed] [Google Scholar]
- 26.Rocco M, Carbone I, Morelli A, Bertoletti L, Rossi S, Vitale M, et al. Diagnostic accuracy of bedside ultrasonography in the ICU: Feasibility of detecting pulmonary effusion and lung contusion in patients on respiratory support after severe blunt thoracic trauma. Acta Anaesthesiol Scand. 2008;52:776–84. doi: 10.1111/j.1399-6576.2008.01647.x. [DOI] [PubMed] [Google Scholar]
- 27.Lichtenstein DA, Lascols N, Mezière G, Gepner A. Ultrasound diagnosis of alveolar consolidation in the critically ill. Intensive Care Med. 2004;30:276–81. doi: 10.1007/s00134-003-2075-6. [DOI] [PubMed] [Google Scholar]
- 28.Lichtenstein D, Mezière G, Seitz J. The dynamic air bronchogram. A lung ultrasound sign of alveolar consolidation ruling out atelectasis. Chest. 2009;135:1421–5. doi: 10.1378/chest.08-2281. [DOI] [PubMed] [Google Scholar]
- 29.Parlamento S, Copetti R, Di Bartolomeo S. Evaluation of lung ultrasound for the diagnosis of pneumonia in the ED. Am J Emerg Med. 2009;27:379–84. doi: 10.1016/j.ajem.2008.03.009. [DOI] [PubMed] [Google Scholar]
- 30.Lichtenstein DA, Lascols N, Prin S, Mezière G. The “lung pulse”: An early ultrasound sign of complete atelectasis. Intensive Care Med. 2003;29:2187–92. doi: 10.1007/s00134-003-1930-9. [DOI] [PubMed] [Google Scholar]
- 31.Lichtenstein DA, Mezière G, Lascols N, Biderman P, Courret JP, Gepner A, et al. Ultrasound diagnosis of occult pneumothorax. Crit Care Med. 2005;33:1231–8. doi: 10.1097/01.ccm.0000164542.86954.b4. [DOI] [PubMed] [Google Scholar]
- 32.Lichtenstein DA. Lung ultrasound in the critically ill. Ann Intensive Care. 2014;4:1. doi: 10.1186/2110-5820-4-1. [DOI] [PMC free article] [PubMed] [Google Scholar]
- 33.Reissig A, Kroegel C. Transthoracic ultrasound of lung and pleura in the diagnosis of pulmonary embolism: A novel non-invasive bedside approach. Respiration. 2003;70:441–52. doi: 10.1159/000074195. [DOI] [PubMed] [Google Scholar]
- 34.Mathis G, Blank W, Reissig A, Lechleitner P, Reuss J, Schuler A, et al. Thoracic ultrasound for diagnosing pulmonary embolism: A prospective multicenter study of 352 patients. Chest. 2005;128:1531–8. doi: 10.1378/chest.128.3.1531. [DOI] [PubMed] [Google Scholar]
- 35.Rainer TH, Griffith JF, Lam E, Lam PK, Metreweli C. Comparison of thoracic ultrasound, clinical acumen, and radiography in patients with minor chest injury. J Trauma. 2004;56:1211–3. doi: 10.1097/01.ta.0000075800.65485.48. [DOI] [PubMed] [Google Scholar]
- 36.Wang XT, Liu DW, Zhang HM, He HW, Liu Y, Chai WZ, et al. The value of bedside lung ultrasound in emergency-plus protocol for the assessment of lung consolidation and atelectasis in critical patients. Zhonghua Nei Ke Za Zhi. 2012;51:948–51. [PubMed] [Google Scholar]