

Abstract
Cellular mechanisms involved in multiple neurodegenerative diseases converge on mitochondria to induce overproduction of reactive oxygen species, damage to mitochondria, and subsequent cytochrome c release. Little is currently known regarding the contribution mitochondrial dynamics play in cytochrome c release following oxidative stress in neurodegenerative disease. Here we induced oxidative stress in the HT22 cell line with glutamate and investigated key mediators of mitochondrial dynamics to determine the role this process may play in oxidative stress induced neuronal death. We report that glutamate treatment in HT22 cells induces increase in reactive oxygen species (ROS), release of the mitochondrial fusion protein Opa1 into the cytosol, with concomitant release of cytochrome c. Furthermore, following glutamate treatment alterations in cell signaling coincide with mitochondrial fragmentation which culminates in significant cell death in HT22 cells. Finally, we report that treatment with the antioxidant tocopherol attenuates glutamate induced-ROS increase, release of mitochondrial Opa1 and cytochrome c, and prevents cell death.
Keywords: HT22, Cytochrome c, Neurodegeneration, Mitochondrial Dynamics: Mitochondria, Oxidative Stress, Glutamate
Introduction
Neurodegenerative diseases develop from diverse stimuli yet these pathologies are linked by the involvement of mitochondria and oxidative stress [1–3]. Signaling pathways involved in neurodegenerative diseases converge on mitochondria where the release of cytochrome c from the mitochondrial intermembrane space (IMS) is a pivotal event in whether a neuron has committed to death [4]. Over production of reactive oxygen species (ROS; oxidative stress) in mitochondria is a central feature of neurodegenerative disorders [5]. ROS are normal byproducts of mitochondrial respiratory chain activity, and typically excess ROS concentration is rectified by mitochondrial antioxidants. In disease states, mitochondrial ROS overwhelm endogenous antioxidants. There is strong evidence that mitochondrial dysfunction and oxidative stress play a causal role in various neurodegenerative diseases, including Alzheimer’s, Parkinson’s, Huntington’s, epilepsy, and brain ischemia [3, 6–8].
The precise mechanism of release of cytochrome c in neurons has been highly researched, nonetheless, there is little consensus on the mode that leads to this paramount event. Many researchers postulate that the release of cytochrome c is a result of swelling of mitochondria, formation of pores, or the formation of channels. Here we propose that dysfunction in mitochondrial dynamics is the basis of cytochrome c release following pathological ROS increase in neurons.
Recent studies continue to expand our knowledge of the dynamic nature of mitochondrial structure [9–13]. Advances in microscopy have enabled us to image mitochondria in vivo allowing us appreciate the temporal changes these organelles constantly undergo. We now know that mitochondria are dynamic organelles that normally exist in a steady state of fusion and fission events. Although the physiological environment regulates the balance of mitochondrial fusion and fission, pathological insults typically drive the balance of fusion or fission to either extreme. In fact, experimental manipulation of yeast and mammalian cells has led to the classification of proteins that are key regulators of mitochondrial fission or fusion. Mitochondrial fission proteins include Drp1, Fis1, MFF, whereas proteins regarded as responsible for fusion are Opa1, Mfn1 and Mfn2.
To investigate the contribution of mitochondrial dynamics in cytochrome c release following oxidative stress in neurodegenerative disease, we utilized the HT22 cell line that is susceptible to oxidative stress [14, 15]. The HT22 cell line is a clone of murine HT4 cells which do not possess glutamate receptors, however, treatment with high levels of glutamate can inhibit the synthesis of intracellular glutathione[16]. Typically, within cells cystine is rapidly reduced to cysteine, necessary for the formation of glutathione (GSH). However, elevated levels of extracellular glutamate competes with cystine for the plasma membrane bound glutamate-cystine antiporter. Therefore, the inhibition of cystine uptake by the constant and high exposure to glutamate gives rise to an inability to maintain intracellular GSH levels, leading to a reduced ability to protect against accumulation of ROS, oxidative injury to the cell, and ultimately, cell death[15–18].
Here we report that glutamate treatment in HT22 cells induces an increase in mitochondrial ROS, release of the mitochondrial fusion protein Opa1 into the cytosol, with concomitant release of cytochrome c. Furthermore, following glutamate treatment alterations in cell signaling coincide with mitochondrial fragmentation which culminates in significant cell death in HT22 cells. Finally, we report that treatment with the antioxidant tocopherol attenuates glutamate induced-ROS increase, release of mitochondrial Opa1 and cytochrome c, and prevents cell death.
Materials and Methods
Cell Culture
HT22 cells were a generous gift from Dr. David Schubert (The Salk Institute, La Jolla, CA). HT22 cells were fed with Dulbecco’s Modified Eagle Medium (DMEM #11995; Invitrogen/Life Technologies, Grand Island, NY) supplemented with 10% fetal bovine serum (FBS #F4135; Sigma-Aldrich, St. Louis, MO), and cultured at 50–55% relative humidity, in 10% CO2 at 37°C (as recommended by Dr. Schubert). The cells were maintained at ≤50% confluency, as previously described [17]. It is important to note that sensitivity to glutamate cytotoxicity varies in HT22 neurons depending on their density and passage number. Therefore, experiments were always performed at a constant cell number in early passages of cells. HT22 cells were plated 12 hours before the experiment, and at the beginning of the experiment the entire media was changed in all groups to DMEM + 10% FBS (control); 5mM Glutamate in DMEM + 10% FBS (Glutamate); and 5mM Glutamate + 100 μM tocopherol in DMEM + 10% FBS (Tocopherol treated). L-glutamic acid (#G8415), and (±)-α-Tocopherol (#T3251) were obtained from Sigma-Aldrich (St. Louis, MO).
Cytotoxicity and Viability Assays
Cytotoxicity of HT22 cells following glutamate treatment was assessed using LDH assay. The LDH leakage assay is based on the measurement of lactate dehydrogenase activity in the extracellular medium. The loss of intracellular LDH and its release into the culture medium is an indicator of irreversible cell death due to cell membrane damage. HT22 cells were seeded in 96-well plates at a density of 5000 cells per well. The LDH assay was performed per manufacturer’s instructions (#88953; Pierce, Rockford, IL, USA).
MTT (3-[4,5-dimethylthiazol-2-yl]-2,5-diphenyltetrazolium bromide) is a water soluble tetrazolium salt, which is converted to an insoluble purple formazan by cleavage of the tetrazolium ring by succinate dehydrogenase within the mitochondria. The formazan product is impermeable to the cell membranes and therefore it accumulates in healthy cells. Again, HT22 cells were seeded in 96-well plates at a density of 5000 cells per well. The MTT assay was according to manufacturer’s instructions (#KA1334; Abnova, Taiwan)
Fractionation of Cells and Western Blotting
Crude mitochondria were isolated using the modified method of Fukui et al.[19]. At the appropriate time, cells were washed with PBS and collected in ice-cold isolation buffer (10mM HEPES [pH 7.5]; 1mM EDTA; 1mM EGTA; 10mM KCl; 210mM mannitol; 70mM sucrose; 2X HALT protease inhibitor [#87785; Pierce, Rockford, IL, USA]; 1X phosphatase inhibitor [#7840; Pierce, Rockford, IL, USA]). Cells were permeabilized with 0.05% digitonin (#300410; Calbiochem/Millipore, Billerica, MA, USA) for exactly 5 minutes on ice. Cell suspensions were centrifuged at 10,000×g at 4°C for 10 minutes to separate the supernatant and pellet fractions. The supernatant was collected as cytosol. The pellet was solubilized in isolation buffer, sonicated, and labeled as crude mitochondrial/heavy membrane fraction. Protein concentration was determined using the Coomassie protein assay (#1856209; Thermo scientific, Rockford, IL, USA) according to manufacturer’s instructions.
Equal amounts of each protein sample were separated by sodium dodecyl sulfate–polyacrylamide gel electrophoresis (8–12% polyacrylamide), transferred to nitrocellulose membranes and analyzed for Opa1 (1:1,000; #612607; BD Biosciences, San Jose, CA) and cytochrome c (1:1,000; 556433; BD Biosciences, San Jose, CA), GADPH (1:2,000; #G8795; Sigma, St. Louis, MO), and ATP Synthase (1:1,000; #ab14730; Abcam, Cambridge, MA) by Western blotting using the enhanced chemiluminescence technique (#32132; Pierce, Rockford, IL, USA). In the gures, each lane represents one experiment. The data were represented as means ± SD from three experiments. Relative band densities were determined by densitometry and groups were compared using a one-way ANOVA followed by a Tukey’s HSD test for post-hoc analysis to statistically evaluate differences between groups.
Immunofluorescence
For detection of mitochondrial morphology changes and alterations in mitochondrial proteins following glutamate treatment, HT22 cells plated on coverslips were exposed to 5mM glutamate for 10 hours and fixed with 4% paraformaldehyde for 15 minutes at room temperature.
To evaluate changes in gross mitochondrial morphology, coverslips were incubated in permeabilization/blocker solution (5% horse serum [#26050; Gibco] in 0.3% Triton-X100/PBS) for 1 hour, and then incubated in primary antibody solution against the mitochondrial protein ATP Synthase (1:1,000; #ab14730; Abcam, Cambridge, MA) overnight at 4°C. The next day, coverslips were exposed to a 2 hour incubation with Alexa Fluor 488 labeled secondary antibody (1:200; #A11017; Invitrogen, Grand Island, NY) and coverslips were mounted with Vectorshield mounting media containing DAPI that counterstained the nuclei (#H-1200; Vector Laboratories, Burlingame, CA).
Immunofluorescence was utilized to visualize release of cytochrome c from the mitochondria. Glutamate treated and untreated paraformaldehyde fixed coverslips were incubated in primary antibodies against cytochrome c (1:100; #ab110325; Abcam, Cambridge, MA), and ATP synthase (1:1000; #ab14730; Abcam, Cambridge, MA) followed by Alexa Fluor 488 (1:200; #A11017; Invitrogen, Grand Island, NY) and 546 (1:200; #A11003 Invitrogen, Grand Island, NY;) secondary antibodies, respectively. Imaging of mitochondrial morphology was performed using an AxioObserver inverted fluorescence microscope, equipped with an AxioCam MRm camera (Carl Zeiss Microscopy, Jena, Germany).
Counting of two different types of mitochondrial morphology states was performed for quantification in at least three independent experiments with 100 cells per condition in n=4 coverslips by three independent investigators blinded towards the treatment of the cells. The two categories of cells were characterized by their contrasting mitochondrial morphology states and were defined as follows: category 1 were healthy cells displaying mitochondria in an elongated tubular network with some smaller mitochondria; these mitochondria are equally distributed throughout the cytosol. Category 2 were injured and dying cells contain smaller round mitochondria located close to the nucleus. For statistical analysis, the experiments were repeated at least three times.
Detection of mitochondrial ROS
HT22 cells were plated on coverslip bottom culture dishes 24 hours prior to experimentation to provide ~40% confluence at the time of experimentation. Cells were incubated with 2μM MitoSOX (Invitrogen, Grand Island, NY) in HBSS for 30 minutes then gently washed with DMEM and placed in a stage top incubator (PeCON; Germany). Cells equilibrated for 3 hours on the microscope stage prior to experimentation. Real-time imaging of cells during 5mMglutamate exposure was carried out on a Zeiss AxioObserver inverted microscope. A z-stack of images was obtained every 10 minutes for the duration of the glutamate exposure + or − tocopherol. Images were obtained of MitoSOX fluorescence and brightfield; maximum intensity projections of all z-planes were integrated to analyzed temporal changes in fluorescence intensity. All intensity measurements are mean intensity of the entire field of view normalized to 1 hour (6 images) of baseline fluorescence to allow normalization to small differences in cell density between experiments.
Statistics
All data and experiments described in the present study were repeated multiple times, and only one set of representative data is shown. Standard deviation (SD) was used to reflect the variation of the replicate determinations. Data were t by linear regression and groups are compared using a one-way ANOVA of regression lines followed by a Tukey’s HSD test for post-hoc analysis to statistically evaluate differences between groups (GraphPad Prism, LaJolla, CA).
Results
Glutamate exposure inhibits cell proliferation and increases cell death in HT22 cells
Glutamate exposure of HT22 cells is a well-established model of oxidative stress [14–17, 19, 20], however, this model is dependent on cell confluency and passage number. Thus to confirm that glutamate effects cell viability in our hands, HT22 cells were plated on 96-well plates and treated with 5mM glutamate. At 24 hours, LDH and MTT levels were measured and compared to controls. Following glutamate exposure there was reduced cellular proliferation, as measured by MTT, to 19% of controls (p<0.05; Figure 1A). Analogously, there was an 87% increase in LDH in the media compared to control levels (p<0.05; Figure 1B). Using real-time imaging of MitoSOX fluorescence we found mitochondrial ROS generation begins 8–10 hours after glutamate exposure. Initially, this is visualized as punctate perinuclear red fluorescence indicative of mitochondrial ROS generation (Figure 1C-“10 Hours”). Red fluorescence continues to accumulate in additional cells and increase in intensity, between 10 and 15 hours of glutamate exposure (Figure 1C). Peak cellular florescence corresponds with cellular condensation and membrane rupture detected with brightfield microscopy (Supplemental Figure 1-Glutamate video). Based on the temporal progression of ROS generation to cell death, we chose 10 hours of glutamate exposure for subsequent experiments to visualize changes in mitochondrial morphology. This allowed analysis of cells after ROS production but before cellular condensation and membrane rupture. Glutamate exposure of undifferentiated HT22 cells that do not possess ionotropic glutamate receptors results in oxidative stress [17]. Using an antibody against the NMDAR1 [21] we confirmed that the HT22 cells did not have glutamate receptors (Figure 1D) and therefore were undifferentiated.
Figure 1. Glutamate treatment reduces cell proliferation and induces cell death.

HT22 cells were plated in 96-well plates and treated with 5mM glutamate. Following 24 hours, there was a (A) 5.5-fold reduction in MTT levels in 5 mM glutamate treated cells compared to controls (p<0.0001); and a (B) 35.8-fold increase in LDH release compared to controls (p<0.0001). Data shown is n=24 in each group. Mitochondrial ROS was probed using MitoSox. Following exposure to 5mM glutamate, there was a significant increase in mitochondrial ROS by 8 hours in glutamate treated cells compared to control (p<0.05; C). Equal amounts of HT22 cells and rat primary neurons were resolved by SDS-PAGE and probed for glutamate receptor (NMDAR1 subunit). The HT22 cells that were used in all experiments did not exhibit glutamate receptors (D).
Glutamate exposure alters mitochondrial morphology
We next set out to investigate if glutamate-induced oxidative stress affected mitochondrial morphology. Cells were treated with 5mM glutamate for 10 hours, fixed and probed with a mitochondrial marker, ATP Synthase. Following imaging, cells were characterized according to their overall mitochondrial morphology using the classification described in methods (Figure 2). In control cells, 83% of cells had a mixed population of mitochondria with tubular, fragmented and thread-like phenotypes. However, following glutamate treatment only the fragmented phenotype persists in 98% of cells (p<0.05). These findings suggest that glutamate induced oxidative stress promotes mitochondrial fragmentation.
Figure 2. Glutamate treatment increases mitochondrial fragmentation.
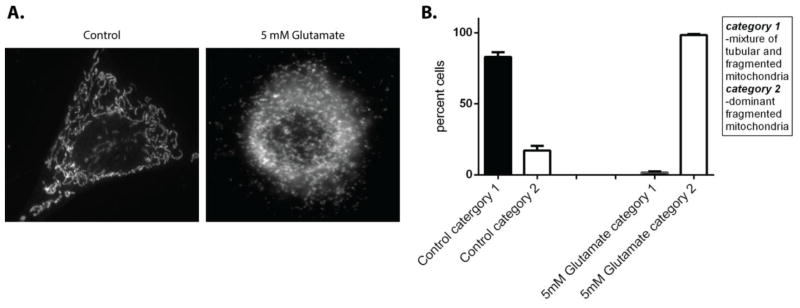
The gross mitochondrial morphology of HT22 cells that were exposed to 5 mM glutamate for 10 hours were compared to control. Cells were classified according to gross mitochondrial morphology following staining mitochondria with primary antibody directed against ATP synthase (A). Cells that contained mitochondria that were tubular and fragmented were labeled as category 1, cells that had a dominant fragmented mitochondrial phenotype were labeled as category 2. In control cells 82% of the cells had a mixed tubular and fragmented phenotype, whereas following 5mM glutamate treatment 98% of cells had a dominant fragmented mitochondrial phenotype (B).
Glutamate exposure results in release of Opa1 and Cytochrome c in the cytosol
The increase in fragmented mitochondria following glutamate treatment led us to investigate proteins involved in mitochondrial dynamics. Fragmented mitochondria could result from an increase in fission or alternatively, a decrease in fusion. Therefore to investigate whether the increase in mitochondrial fragmentation was a result of increased mitochondrial fission or a defect in mitochondria fusion, we examined key fission and fusion proteins. Drp1 is a dynamin-related GTPase that is predominantly found in the cytosol. Alterations in the cellular environment cause Drp1 to translocate to the mitochondria, oligomerize and ultimately result in fission of mitochondria. Optic atrophy 1 (Opa1) is a mitochondrial protein that is key to mitochondrial fusion but also maintains cristae morphology of inner mitochondrial membrane. Opa1 is typically seen as a balance of short and long isoforms associated with the inner mitochondrial membrane[22], but is only present in the mitochondria.
We chose to investigate the presence of Drp1, Opa1 and cytochrome c in fractionated HT22 cells exposed to glutamate. In our initial experiments, we had observed that 5mM glutamate treatment resulted in relatively low ROS at early time points, however, by 8 hours incubation with glutamate, cells had started to increase ROS accumulation. Moreover, by 10 hours glutamate treatment there was a peak in accumulated mitochondrial ROS and cells had not yet undergone cellular condensation and membrane rupture (Figure 1C; Supplemental Figure 1 Control and Glutamate video). To identify a possible role of ROS in mitochondrial dynamics, we designed our experiments to measure cell signaling proteins before and during the mitochondrial ROS burst. Cells were collected at 4 and 10 hours and fractionated into cytosolic and mitochondria/heavy membrane fractions. Equal protein concentrations were resolved by SDS-PAGE and membranes were probed with antibodies directed at Opa-1, cytochrome c, Drp-1, GADPH, and ATP synthase.
In control and 4 hour glutamate exposure samples, both cytochrome c and the long and short isoforms of Opa1 were only visible in the mitochondrial fractions. However, at 10 hours glutamate exposure Opa1 and cytochrome c appear in the cytosolic fraction (Figure 3A & B). There was a concomitant loss of cytochrome c in the corresponding mitochondrial fraction. In mitochondrial samples where cytochrome c release occurred, there were loss of the higher molecular weight Opa1 isoform and an increase in the lower molecular weight forms of Opa1. At the time points chosen, we did not detect any translocation or change in levels of Drp-1 (Figure 3D). The release of Opa1 from mitochondria provides evidence that there is disruption in mitochondrial fusion during oxidative stress.
Figure 3. Glutamate treatment results in Opa1 and cytochrome c release from the mitochondria to the cytosol.

HT22 cells were exposed to 5mM glutamate for 4 and 10 hours. Cells were fractionated to isolate a cytosolic and a mitochondrial/heavy membrane fraction and equal amounts of protein were resolved by SDS-PAGE. Membranes were probed with antibody against Opa-1 and cytochrome c (A). At 10 hours of glutamate treatment, there was a significant increase in Opa-1 (p<0.05; B) and cytochrome c (p<0.05; B) compared to controls. Immunofluorescence of HT22 cells (C) control and treated with 5mM glutamate for 10 hours, ATP synthase labeled red and cytochrome c labeled green, DAPI labeled blue. We measured Drp1 levels in both cytosolic and mitochondrial/heavy membrane fractions of control and 5mM glutamate exposed cells for 10 hours. There was no significant change in Drp1 at 10 hours glutamate exposure (p<0.05; D).
To visualize the release of cytochrome c in cells, glutamate treated cells were analyzed by immunofluorescence. In control samples, there is complete overlap of cytochrome c and ATP Synthase indicative of co-localization of these proteins in the mitochondria. Following glutamate treatment, there is release of cytochrome c from the mitochondria into the cytosol as visualized in the overlay with the mitochondrial specific ATP Synthase signal (Figure 3C).
Tocopherol attenuates mitochondrial ROS generation and Opa1 and cytochrome c release following glutamate treatment
Next, we tested if the Opa1 and cytochrome c release and alterations in mitochondrial morphology seen following glutamate exposure in HT22 cells was attributed to ROS accumulation. We treated HT22 cells with glutamate and the potent antioxidant tocopherol to impede accumulation of ROS. While glutamate did induced a significant increase in ROS, as seen by MitoSOX fluorescence (p<0.05), the antioxidant tocopherol effectively suppressed ROS levels to those seen in control cells (Figure 4A; supplemental Figure 1 Glutamate and tocopherol videos).
Figure 4. Tocopherol attenuates Opa1 and cytochrome c release following glutamate treatment.

Mitochondrial ROS was measured overtime using MitoSox. 100μM tocopherol prevented ROS accumulation in mitochondria following 5mM glutamate exposure in comparison to glutamate exposed cells (p<0.05; A). Tocopherol was also effective at preserving mitochondrial morphology as observed by immunofluorescence against ATP Synthase (green; B) and maintaining gross morphology of HT22 cells (C). HT22 cells were exposed to 5 mM glutamate alone or 5 mM glutamate with 100μM tocopherol for 10 hours. Cells were fractionated into cytosolic and mitochondrial/heavy membrane fractions. Proteins were resolved on SDS-PAGE and membranes probed for Opa1 and cytochrome c levels. The potent antioxidant tocopherol attenuated both Opa1 and cytochrome c release into the cytosol to levels seen in controls (p<0.05; D).
We then observed mitochondrial morphology by immunofluorescence using the mitochondrial probe ATP Synthase. In tocopherol treated glutamate exposed cells, the mitochondrial morphology resembled that of control cells, whereas, in glutamate-only cells the mitochondria were fragmented (Figure 4B). Additionally, in tocopherol treated glutamate exposed group, the gross morphology of the cells was healthy and similar to control cells (Figure 4C). Whereas in the 10 hour glutamate treated group, the cells were shrunken, rounded up, and lifting of the plate.
More importantly, we assayed if the tocopherol-induced block in ROS accumulation affected release of Opa1 and cytochrome c following glutamate exposure. HT22 cells were exposed to glutamate alone or glutamate plus 100 μM tocopherol and all samples were separated into cytosolic and mitochondria/heavy membrane fractions and resolved by SDS-PAGE. As previously noted, in the glutamate exposed group, there was a large increase in cytosolic Opa1 and concomitant cytochrome c release. However, in tocopherol treated glutamate cells, there was little to no release of Opa1 and cytochrome c into the cytosol similar to that seen in controls (p<0.05; Figure 4D).
This data demonstrates that tocopherol is effective at inhibiting ROS and Opa1 release, preserving mitochondria and protecting cells against oxidative stress.
Glutamate exposure results in caspase-3 activation
To confirm that glutamate-induced cytochrome c release triggered apoptosis we assayed cleaved caspase-3 (Figure 5A). Following glutamate exposure, there was significant proteolytic cleavage of caspase-3 in comparison to the control and tocopherol treated cells (p<0.05). There was no statistically significant change in translocation of the 20kDa form of Bax following glutamate exposure (Figure 5B) which was also observed by Fukui et al. [19]. Additionally, there were no statistically significant differences in Bcl-2 levels in experimental groups (Figure 5C). Although, there were significantly higher levels of Bcl-XL in the cytosol of control and tocopherol treated samples in comparison to glutamate treatment (p<0.05; Figure 5C). This data indicates that clearly apoptosis is activated, however, the relative contribution of BCL-2 proteins in this insult remains unclear.
Figure 5. Glutamate exposure results in caspase-3 activation.

HT22 cells were exposed to 5 mM glutamate alone or 5 mM glutamate with tocopherol for 10 hours. Cells were fractionated into cytosolic and mitochondrial/heavy membrane fractions. Proteins were resolved on SDS-PAGE and membranes probed for cleaved caspase-3, bax, bcl-xl and bcl-2. In cells exposed to glutamate there was a significant increase in the 17kDa proteolytic cleaved caspase-3 (p<0.05; A) that was absent in controls and tocopherol treated cells. Bax and Bcl-2 levels did not change when compared to controls (p<0.05; B & C), however, there was a significant decrease in Bcl-XL in glutamate samples compared to control (p<0.05; C).
Discussion
It is well accepted that cytochrome c release is an indicator that the cell has committed to death. Cytochrome c is normally located in the intermembranous space, between the outer and inner mitochondrial membranes, with the majority of cytochrome c held in the cristae formed by folding of the inner mitochondrial membrane. The cristae junctions are maintained by Opa1 proteins which are found in various isoforms, the number of isoforms varies dependent on the cell type. Opa1 isoforms are classified as being long or short isoforms and function as the structural “gatekeepers” at the cristae opening by forming oligomers. Typically, Opa1 is only present in the mitochondria as seen in our controls. We report that following glutamate-induced oxidative stress, Opa1 isoforms are released from the mitochondria into the cytosol in HT22 cells. This release is concomitant with cytochrome c release from the mitochondria and an increase in mitochondrial fragmentation.
We have shown that glutamate treatment in HT22 cells tips mitochondrial fragmentation to be the dominant phenotype. Fragmented mitochondria could result from an increase in fission or alternatively, a decrease in fusion. In fact, when the fusion phenotype is promoted by either inhibiting fission with the drug Mdivi that prevents Drp1 oligmerization [23] or down regulating Drp1 with siRNA[24], cells survive. In these studies, it was believed that increased mitochondrial fission was the source of cell death and attenuating fission would promote survival, the caveat being attenuating fission inadvertently promotes fusion. At the time points chosen here, we did not observe any translocation or change in expression of Drp-1, however, Drp-1 translocation is a transient event which we may have overlooked at the time points we observed. Based on our results, we attribute the increase in mitochondrial fragmentation and cell death to a breakdown in mitochondrial fusion process. Although the precise manner in which mitochondria fuse is not well-defined, it is clear that the presence of Opa1 in cytosol is only found in pathological situations [25–27]. Following glutamate treatment the release of Opa1 from the mitochondria has a two-fold affect: 1) it leads to a disruption in mitochondrial fusion inadvertently promoting fission; and 2) results in cytochrome c release from the mitochondrial cristae. Notably, the disassembly of Opa1 complexes would hinder the mitochondrial fusion process which ultimately results in an increased fission/fragmentation phenotype [26, 28]. This disruption of the cristae structure by altering Opa1 complexes in the inner mitochondrial membrane permits release cytochrome c in the IMS and into the cytosol [29].
Mitochondria are sensitive to cellular requirements in physiologic and stressful situations, responding by promoting fusion or fission. Mitochondrial fusion is essential for normal mitochondrial function, and thus a breakdown in proteins that promote fusion following oxidative stress is clearly damaging to the cell. Release of Opa1 isoforms from the mitochondria is triggered by either proteolytic cleavage or ROS-induced peroxidation of cardiolipin [4, 28, 30–35]. Here we demonstrate the potent antioxidant tocopherol was effective at attenuating mitochondrial ROS and, moreover, tocopherol prevented release of Opa1 and cytochrome c into the cytosol and maintained cellular and mitochondrial morphology following oxidative stress, suggesting ROS plays a major role in Opa1 release. As expected, the release of cytochrome c into the cytosol corresponds to an increase in activated (cleaved) caspase-3 in the cytosol and this was prevented by tocopherol. Contrary to a canonical role of apoptosis in this process, Bcl-2 proteins commonly shown to control to cytochrome c release (Bax, Bcl-2, and Bcl-XL) did not change in expression or sub-cellular localization in response to glutamate or tochoperol at the time points we examined. While this is not an exhaustive evaluation of the role of Bcl-2 proteins in this process, our data suggests mechanisms outside of the traditional bax/bcl-2 regulated apoptotic program are regulating this process. Further investigations are needed to identify the exact cause of Opa1 release following oxidative stress to enhance our understanding of cell death and more importantly, identify potential therapies for the neurodegenerative diseases affected by oxidative stress.
Supplementary Material
HT22 cells were imaged every 10 minutes for the 15 hour glutamate exposure duration. Control cells show no increase in MitoSOX fluorescence and proliferate normally (Control.avi). Glutamate exposure induces a significant increase in MitoSOX fluorescence, cellular condensation, and loss of membrane integrity (Glutamate.avi); however these events are not seen in cells incubated with glutamate and tocopherol (Glutamate + Tocopherol.avi).
Highlights.
Oxidative stress increases mitochondrial fragmentation.
Oxidative stress results in release of Opa1 & cyto c from the mitochondria.
Tocopherol attenuates ROS, prevents Opa1 & cyto c release, preserves mitochondrial.
Acknowledgments
We kindly thank Dr. Schubert for the HT-22 cells used in this study. Research described in this article was supported by grant NS076715 from the National Institutes of Health (RK, THS).
Abbreviations
- cyto c
cytochrome c
- Opa1
Optic Atrophy Type 1
- GAPDH
Glyceraldehyde 3-phosphate dehydrogenase
- ATP synthase
Adenosine Triphosphate
- MTT
3-(4,5- dimethylthiazol-2-yl)-2,5-diphenyltetrazolium bromide
- LDH
Lactate Dehydrogenase
- ROS
Reactive Oxygen Species
- IMS
Intermembrane Space
- OMM
Outer Mitochondria Membrane
- IMM
Inner Mitochondria Membrane
Footnotes
Publisher's Disclaimer: This is a PDF file of an unedited manuscript that has been accepted for publication. As a service to our customers we are providing this early version of the manuscript. The manuscript will undergo copyediting, typesetting, and review of the resulting proof before it is published in its final citable form. Please note that during the production process errors may be discovered which could affect the content, and all legal disclaimers that apply to the journal pertain.
References
- 1.Albers DS, Beal MF. Mitochondrial dysfunction and oxidative stress in aging and neurodegenerative disease. J Neural Transm Suppl. 2000;59:133–54. doi: 10.1007/978-3-7091-6781-6_16. [DOI] [PubMed] [Google Scholar]
- 2.Bains JS, Shaw CA. Neurodegenerative disorders in humans: the role of glutathione in oxidative stress-mediated neuronal death. Brain Res Brain Res Rev. 1997;25(3):335–58. doi: 10.1016/s0165-0173(97)00045-3. [DOI] [PubMed] [Google Scholar]
- 3.Coyle JT, Puttfarcken P. Oxidative stress, glutamate, and neurodegenerative disorders. Science. 1993;262(5134):689–95. doi: 10.1126/science.7901908. [DOI] [PubMed] [Google Scholar]
- 4.Huttemann M, et al. The multiple functions of cytochrome c and their regulation in life and death decisions of the mammalian cell: From respiration to apoptosis. Mitochondrion. 2011;11(3):369–81. doi: 10.1016/j.mito.2011.01.010. [DOI] [PMC free article] [PubMed] [Google Scholar]
- 5.Keating DJ. Mitochondrial dysfunction, oxidative stress, regulation of exocytosis and their relevance to neurodegenerative diseases. J Neurochem. 2008;104(2):298–305. doi: 10.1111/j.1471-4159.2007.04997.x. [DOI] [PubMed] [Google Scholar]
- 6.Trushina E, McMurray CT. Oxidative stress and mitochondrial dysfunction in neurodegenerative diseases. Neuroscience. 2007;145(4):1233–48. doi: 10.1016/j.neuroscience.2006.10.056. [DOI] [PubMed] [Google Scholar]
- 7.Pereira MD, Ksiazek K, Menezes R. Oxidative stress in neurodegenerative diseases and ageing. Oxid Med Cell Longev. 2012;2012:796360. doi: 10.1155/2012/796360. [DOI] [PMC free article] [PubMed] [Google Scholar]
- 8.Di Carlo M, et al. Are oxidative stress and mitochondrial dysfunction the key players in the neurodegenerative diseases? Free Radic Res. 2012;46(11):1327–38. doi: 10.3109/10715762.2012.714466. [DOI] [PubMed] [Google Scholar]
- 9.Chan D, Frank S, Rojo M. Mitochondrial dynamics in cell life and death. Cell Death Differ. 2006;13(4):680–4. doi: 10.1038/sj.cdd.4401857. [DOI] [PubMed] [Google Scholar]
- 10.Grohm J, Plesnila N, Culmsee C. Bid mediates fission, membrane permeabilization and peri-nuclear accumulation of mitochondria as a prerequisite for oxidative neuronal cell death. Brain Behav Immun. 2010;24(5):831–8. doi: 10.1016/j.bbi.2009.11.015. [DOI] [PubMed] [Google Scholar]
- 11.Yoon Y. Regulation of mitochondrial dynamics: another process modulated by Ca2+ signals? Sci STKE. 2005;2005(280):pe18. doi: 10.1126/stke.2802005pe18. [DOI] [PubMed] [Google Scholar]
- 12.Shaw JM, Nunnari J. Mitochondrial dynamics and division in budding yeast. Trends Cell Biol. 2002;12(4):178–84. doi: 10.1016/s0962-8924(01)02246-2. [DOI] [PMC free article] [PubMed] [Google Scholar]
- 13.Jensen RE, et al. Yeast mitochondrial dynamics: fusion, division, segregation, and shape. Microsc Res Tech. 2000;51(6):573–83. doi: 10.1002/1097-0029(20001215)51:6<573::AID-JEMT7>3.0.CO;2-2. [DOI] [PubMed] [Google Scholar]
- 14.Lee Y, et al. Proteomic analysis of glutamate-induced toxicity in HT22 cells. Proteomics. 2007;7(2):185–93. doi: 10.1002/pmic.200600644. [DOI] [PubMed] [Google Scholar]
- 15.Chen J, et al. The responses of Ht22 cells to oxidative stress induced by buthionine sulfoximine (BSO) BMC Neurosci. 2005;6:10. doi: 10.1186/1471-2202-6-10. [DOI] [PMC free article] [PubMed] [Google Scholar]
- 16.Li Y, Maher P, Schubert D. A role for 12-lipoxygenase in nerve cell death caused by glutathione depletion. Neuron. 1997;19(2):453–63. doi: 10.1016/s0896-6273(00)80953-8. [DOI] [PubMed] [Google Scholar]
- 17.Tan S, et al. The regulation of reactive oxygen species production during programmed cell death. J Cell Biol. 1998;141(6):1423–32. doi: 10.1083/jcb.141.6.1423. [DOI] [PMC free article] [PubMed] [Google Scholar]
- 18.Ha JS, Park SS. Glutamate-induced oxidative stress, but not cell death, is largely dependent upon extracellular calcium in mouse neuronal HT22 cells. Neurosci Lett. 2006;393(2–3):165–9. doi: 10.1016/j.neulet.2005.09.056. [DOI] [PubMed] [Google Scholar]
- 19.Fukui M, et al. Mechanism of glutamate-induced neurotoxicity in HT22 mouse hippocampal cells. Eur J Pharmacol. 2009;617(1–3):1–11. doi: 10.1016/j.ejphar.2009.06.059. [DOI] [PubMed] [Google Scholar]
- 20.Kimura Y, et al. Hydrogen sulfide protects HT22 neuronal cells from oxidative stress. Antioxid Redox Signal. 2006;8(3–4):661–70. doi: 10.1089/ars.2006.8.661. [DOI] [PubMed] [Google Scholar]
- 21.Zhao Z, et al. Differentiation of HT22 neurons induces expression of NMDA receptor that mediates homocysteine cytotoxicity. Neurol Res. 2012;34(1):38–43. doi: 10.1179/1743132811Y.0000000057. [DOI] [PubMed] [Google Scholar]
- 22.Chen H, Chan DC. Mitochondrial dynamics in mammals. Curr Top Dev Biol. 2004;59:119–44. doi: 10.1016/S0070-2153(04)59005-1. [DOI] [PubMed] [Google Scholar]
- 23.Grohm J, et al. Inhibition of Drp1 provides neuroprotection in vitro and in vivo. Cell Death Differ. 2012;19(9):1446–58. doi: 10.1038/cdd.2012.18. [DOI] [PMC free article] [PubMed] [Google Scholar]
- 24.Zhang C, et al. Downregualtion of dynamin-related protein 1 attenuates glutamate-induced excitotoxicity via regulating mitochondrial function in a calcium dependent manner in HT22 cells. Biochem Biophys Res Commun. 2014;443(1):138–43. doi: 10.1016/j.bbrc.2013.11.072. [DOI] [PubMed] [Google Scholar]
- 25.Arnoult D, et al. Release of OPA1 during apoptosis participates in the rapid and complete release of cytochrome c and subsequent mitochondrial fragmentation. J Biol Chem. 2005;280(42):35742–50. doi: 10.1074/jbc.M505970200. [DOI] [PubMed] [Google Scholar]
- 26.Ju WK, et al. Glutamate receptor activation triggers OPA1 release and induces apoptotic cell death in ischemic rat retina. Mol Vis. 2008;14:2629–38. [PMC free article] [PubMed] [Google Scholar]
- 27.Ranieri M, et al. Mitochondrial fusion proteins and human diseases. Neurol Res Int. 2013;2013:293893. doi: 10.1155/2013/293893. [DOI] [PMC free article] [PubMed] [Google Scholar]
- 28.McBride H, Soubannier V. Mitochondrial function: OMA1 and OPA1, the grandmasters of mitochondrial health. Curr Biol. 2010;20(6):R274–6. doi: 10.1016/j.cub.2010.02.011. [DOI] [PubMed] [Google Scholar]
- 29.Yamaguchi R, et al. Opa1-mediated cristae opening is Bax/Bak and BH3 dependent, required for apoptosis, and independent of Bak oligomerization. Mol Cell. 2008;31(4):557–69. doi: 10.1016/j.molcel.2008.07.010. [DOI] [PMC free article] [PubMed] [Google Scholar]
- 30.Zhang K, Li H, Song Z. Membrane depolarization activates the mitochondrial protease OMA1 by stimulating self-cleavage. EMBO Rep. 2014 doi: 10.1002/embr.201338240. [DOI] [PMC free article] [PubMed] [Google Scholar]
- 31.Ban T, et al. OPA1 disease alleles causing dominant optic atrophy have defects in cardiolipin-stimulated GTP hydrolysis and membrane tubulation. Hum Mol Genet. 2010;19(11):2113–22. doi: 10.1093/hmg/ddq088. [DOI] [PMC free article] [PubMed] [Google Scholar]
- 32.DeVay RM, et al. Coassembly of Mgm1 isoforms requires cardiolipin and mediates mitochondrial inner membrane fusion. J Cell Biol. 2009;186(6):793–803. doi: 10.1083/jcb.200906098. [DOI] [PMC free article] [PubMed] [Google Scholar]
- 33.Kagan VE, et al. Cytochrome c acts as a cardiolipin oxygenase required for release of proapoptotic factors. Nat Chem Biol. 2005;1(4):223–32. doi: 10.1038/nchembio727. [DOI] [PubMed] [Google Scholar]
- 34.Jiang J, et al. Interplay between bax, reactive oxygen species production, and cardiolipin oxidation during apoptosis. Biochem Biophys Res Commun. 2008;368(1):145–50. doi: 10.1016/j.bbrc.2008.01.055. [DOI] [PMC free article] [PubMed] [Google Scholar]
- 35.Haines TH. A new look at Cardiolipin. Biochim Biophys Acta. 2009;1788(10):1997–2002. doi: 10.1016/j.bbamem.2009.09.008. [DOI] [PubMed] [Google Scholar]
Associated Data
This section collects any data citations, data availability statements, or supplementary materials included in this article.
Supplementary Materials
HT22 cells were imaged every 10 minutes for the 15 hour glutamate exposure duration. Control cells show no increase in MitoSOX fluorescence and proliferate normally (Control.avi). Glutamate exposure induces a significant increase in MitoSOX fluorescence, cellular condensation, and loss of membrane integrity (Glutamate.avi); however these events are not seen in cells incubated with glutamate and tocopherol (Glutamate + Tocopherol.avi).