Abstract
While capillary zone electrophoresis (CZE) has been used to produce very rapid and efficient separations, coupling these high-speed separations with mass spectrometry (MS) has been challenging. Now, with much faster and sensitive mass spectrometers, it is possible to take full advantage of the CZE speed and reconstruct the fast migrating peaks. Here are three high-speed CZE-MS analyses via an electrokinetically pumped sheath-flow interface. The first separation demonstrates CZE-ESI-MS of an amino acid mixture with a two-minute separation, >50,000 theoretical plates, low micromolar concentration detection limits, and subfemtomole mass detection limits (LTQ XL mass spectrometer). The second separation with our recently improved third-generation CE-MS interface illustrates a 20 amino acid separation in ~7 minutes with an average over 200,000 plate counts, and results in almost-baseline resolution of structural isomers, leucine and isoleucine. The third separation is of a BSA digest with a reproducible CZE separation and mass spectrometry detection in two minutes. CZE-MS/MS analysis of the BSA digest identified 31 peptides, produced 52% sequence coverage, and generated a peak capacity of ~40 across the one-minute separation window (Q-Exactive mass spectrometer).
Keywords: High-speed separation, capillary zone electrophoresis, electrokinetically pumped nanospray, tandem mass spectrometry, amino acids, tryptic digest
Introduction
High-speed capillary zone electrophoresis (CZE) separations were first described by Monnig and Jorgenson in 1991 [1]. Most high-speed CZE separations have employed laser-induced fluorescence detection [2–5]. Increasing speed while maintaining high separation efficiency relies on maximizing the electric field strength and minimizing Joule heating; inefficient heat removal leads to band broadening and separation degradation. Capillaries with a narrower inner diameter increase the surface-to-volume ratio and efficiently remove excess heat. Therefore, a higher voltage can be applied to increase separation speed without drastically increasing the current output [1]. However, the use of narrow capillaries limits the injection volume, which degrades concentration detection limits.
Mass spectrometers are attractive detectors for fast CZE separations. Smith’s group pioneered the interface of CZE with electrospray ionization (ESI) for mass spectrometry detection [6], and since then interfaces have undergone many redesigns [7]. A common challenge has been creating a stable electrical contact that serves as both the terminal electrode for CE and the emitter electrode for the ESI [8–9].
The mass spectrometer must provide fast scan speed and high sensitivity to follow the rapid separation and detect the low injection amounts employed in high-speed CZE. Time-of-flight mass spectrometers have often been used in high speed CZE due to their high sampling rates. Banks Jr. and Dresch presented the first high speed CE-MS study of proteins and peptides utilizing a pumped sheath-flow interface coupled to TOF-MS [8]. Matysik and Pelzing have worked extensively with a coaxial sheath-flow interface design coupled to TOF-MS with exquisite results [10–13]. The pumped-sheath flow design allowed for detection in positive and negative ionization modes for many classes of compounds.
Ion traps and Orbitrap mass analyzers are interesting alternatives for detection of high-speed CZE separations. Moini and Martinez used an ion-trap mass spectrometer in an ultrafast CE-MS system that employed a short (< 20 cm) and narrow (≤ 5 μm inner diameter) capillary and ≥1000 V/cm electric field [14]. The analysis of standard peptides and protein digests were completed in about 1 min. Wojcik et al. employed an Orbitrap Velos mass spectrometer for the fast separation of tryptic peptides, achieving separation of ten peptides in 300 s [15].
This report employs an electrokinetically pumped, nanospray sheath-flow CE-ESI-MS interface that is quite simple and robust [16]. Briefly, the separation capillary is threaded through a tee union into a glass ESI emitter. Under applied voltage, sheath flow in the emitter tip is driven by electroosmosis flow. A stable electrical contact for both the terminal CE electrode and ESI electrode is created at the sheath liquid reservoir. Emitter lifetime is extended by applying the electrospray voltage at the sheath liquid reservoir, instead of to the emitter directly, which prevents undesirable electrolysis reactions. Previous work by Wojcik et al investigated fast CE-MS separations of amino acids and urine metabolites coupled with a high resolution, fast acquisition rate time-of-flight instrument. [17]. While the electrokinetically-pumped interface has been used in many CZE proteomic analyses [18–23], it has not applied for metabolite analysis in combination with ion trap MS instrumentation.
2. Materials and Methods
2.1 Materials and Chemicals
Amino acids, bovine pancreas TPCK-treated trypsin, bovine serum albumin (BSA), urea, ammonium bicarbonate (NH4HCO3), dithiothreitol (DTT), iodoacetamide (IAA) and acetonitrile (ACN) were purchased from Sigma–Aldrich (St. Louis, MO, USA). Formic acid (FA) and hydrofluoric acid were purchased from Fisher Scientific (Pittsburgh, PA, USA). LC-MS grade water and methanol were purchased from Honeywell Burdick & Jackson (Wicklow, Ireland). Fused silica capillaries (10 μm i.d./150μm o.d., 20 μm i.d./150μm o.d.) were purchased from Polymicro Technologies (Phoenix, AZ, USA).
2.2 Sample preparation
2.2.1 Amino acid preparation
Concentrated stock solutions of each amino acid were prepared in water and kept at −80°C until needed. Two sample mixtures were prepared for CE-ESI-MS analysis. For the first sample, ten amino acid standards were diluted into 1 mL of 200 mM formic acid. The final concentrations of each amino acid in solution are listed in Table 1. The second sample consisted of 20 amino acid standards diluted to ~20 μM each in 0.04% (v/v) formic acid containing 30% (v/v) acetonitrile (ACN).
Table 1.
Final concentrations of amino acids in sample solution.
| Amino Acid | Concentration (μM) |
|---|---|
| Glycine | 150 |
| Alanine | 200 |
| Serine | 135 |
| Proline | 130 |
| Threonine | 150 |
| Asparagine | 125 |
| Lysine | 110 |
| Glutamic acid | 100 |
| Histidine | 115 |
| Arginine | 95 |
2.2.2 Bovine serum albumin digest preparation
Bovine serum albumin (BSA, 0.5 mg/mL) in 100 mM NH4HCO3 (pH 8.0) containing 8 M urea was denatured at 37 °C for 30 min, followed by standard reduction and alkylation with DTT and IAA. After dilution with 100 mM NH4HCO3 (pH 8.0) to reduce the urea concentration below 2 M, protein digestion was performed for 12 h at 37 °C with trypsin at a trypsin/protein ratio of 1/30 (w/w). After acidification, the protein digest was desalted with C18-SepPak column (Waters, Milford, MA), followed by lyophilization with a vacuum concentrator (Thermo Fisher Scienti c, Marietta, OH). The dried sample was resuspended in 0.05% (v/v) formic acid to a final concentration of 1.6 mg/mL and stored at −20 °C prior to CZE-ESI-MS and MS/MS analysis.
2.3 CE-MS analysis
2.3.1 High speed CE-MS analysis of amino acids
Uncoated, fused silica capillaries were used for all experiments (150 μm o.d., 20 μm i.d.). The capillaries were conditioned by sequential washes with methanol for 2 minutes, 100 mM HCl for 5 minutes, and 1 M NaOH for 10–15 minutes, with intermediate water washes. Finally, the capillary was equilibrated with separation buffer for 5–10 minutes.
The first- and third-generations of the electrokinetically-pumped sheath-flow interface were employed to couple CZE to mass spectrometry [16, 24]. Briefly, high voltage is supplied by two Spellman CZE 1000R high-voltage power supplies via platinum electrodes to a custom-built injection block and electrospray emitter. A Sutter puller (P-1000) pulls emitter tips from borosilicate glass capillaries (1 mm o.d., 0.75 mm i.d.) to an opening size of 7–9 μm or 35 μm. Once the separation capillary is inserted into the interface, the ESI emitter and sheath flow tubing are flushed with sheath liquid prior to each run.
The high-speed CZE separations were coupled to an LTQ XL mass spectrometer (Thermo Fisher Scientific), operated in positive ionization mode. Instrument parameters were optimized for rapid data collection, resulting in an acquisition rate of approximately 4–6 Hz. Scan speed was increased by setting the scan range to 50–200 m/z, in addition to activating the “low” mass range setting. The maximum injection time was 30 ms, and microscans was set to 1.
A mixture of amino acids (Table 1) was used to optimize both the CE and MS conditions for subsequent experiments. Ion optics were tuned to asparagine (m/z 133) to maximize signal intensity in the m/z region of the analytes of interest.
For the sample containing ten amino acid standards, the first-generation electro-kinetically pumped sheath-flow interface [16] was employed. Sample plugs were electrokinetically introduced onto a 30 cm separation capillary at 5 kV for 1 sec. The separation buffer was 200 mM formic acid and the sheath liquid was 10 mM formic acid, containing 50% methanol. The spray emitter opening size was 7–9 μm. The applied separation voltage and electrospray voltage were 28.2 kV and 1.2 kV, respectively.
For the sample containing twenty amino acid standards, the recently improved third-generation electro-kinetically pumped sheath-flow CE-MS interface [24] was employed to couple CZE to mass spectrometry. A 45 cm separation capillary (150 μm o.d., 20 μm i.d.) with an etched end (~ 40 μm o.d.) was used. The spray emitter opening size was 35 μm. The distance between the etched tip of the separation capillary and the electrospray emitter orifice was ~50 μm. The separation buffer was 0.5% (v/v) formic acid and the sheath liquid was 0.5% (v/v) formic acid, containing 10% (v/v) methanol. The sample was dissolved in 0.04% (v/v) formic acid containing 30% (v/v) acetonitrile. Sample was injected with 10 psi for 2 seconds. The separation voltage and electrospray voltage were 16 kV and 2 kV, respectively.
The data were imported into MATLAB for analysis.
2.3.2 High-speed CE-MS analysis of BSA digest
The second-generation electrokinetically pumped sheath flow interface [21] was used to couple CZE to a Q-Exactive mass spectrometer (Thermo Fisher Scientific) for a high-speed separation of BSA digest. Approximately 5 mm of the separation capillary (28 cm, uncoated, 10 μm i.d./150 μm o.d.) was etched with hydrofluoric acid to a resulting o.d.~ 60 μm. The applied separation voltage and electrospray voltage were 29.5 kV and 1.5 kV, respectively. Sample was hydrodynamically introduced to the capillary via 8 psi for 2 sec. The separation buffer was 0.5% (v/v) formic acid (0.13 M) in water. The sheath buffer was 10% (v/v) methanol containing 0.1% (v/v) formic acid. The spray emitter opening size was 7–9 μm.
For CZE-ESI-MS analysis, the Q-Exactive mass spectrometer parameters were as follows. The resolution was 35,000 (at m/z 200), AGC target was 1E6, maximum injection time was 60 ms, microscan was 1, and the scan range was m/z 380–1800. For CZE-ESI-MS/MS, a top 5 data dependent acquisition (DDA) method was used. For the full MS1 scans, the parameters were the same as those mentioned above except the resolution was set to 17,500 (at m/z 200). For tandem spectra acquisition, the five most intense peaks from the MS1 spectrum were sequentially isolated in the quadrupole (isolation window as 2.0 m/z) and further fragmented in the higher energy collisional dissociation (HCD) cell (NCE as 28%), followed by Orbitrap analysis. The resolution was 17,500 (at m/z 200), AGC target was 1E6, maximum injection time was 60 ms and microscans was 1. The parent ions with charge states higher than +1 and intensity higher than 5.0E+04 were chosen for fragmentation. Dynamic exclusion was set to 1 sec. Peptide match and exclude isotopes were turned on.
Raw MS files were analyzed by MaxQuant [25] version 1.3.0.5. MS/MS spectra were searched by the Andromeda search engine [26] against ipi.BOVIN.v3.68.fasta database containing forward and reverse sequences. MaxQuant analysis included an initial search with a precursor mass tolerance of 20 ppm, main search precursor mass tolerance of 10 ppm and fragment mass tolerance of 20 ppm. The search included the enzyme as trypsin, variable modifications of methionine oxidation, N-terminal acetylation, lysine acetylation and deamidation (NQ), and fixed modification of carbamidomethyl cysteine. The minimal peptide length was set to seven amino acids and the maximum number of missed cleavages was set to two. The false discovery rate (FDR) was set to 0.01 for both peptide and protein identifications. The proteins identified by identical sets of peptides were grouped, and reported as one protein group.
3. Results and Discussion
3.1 High-speed CZE-MS for amino acid analysis
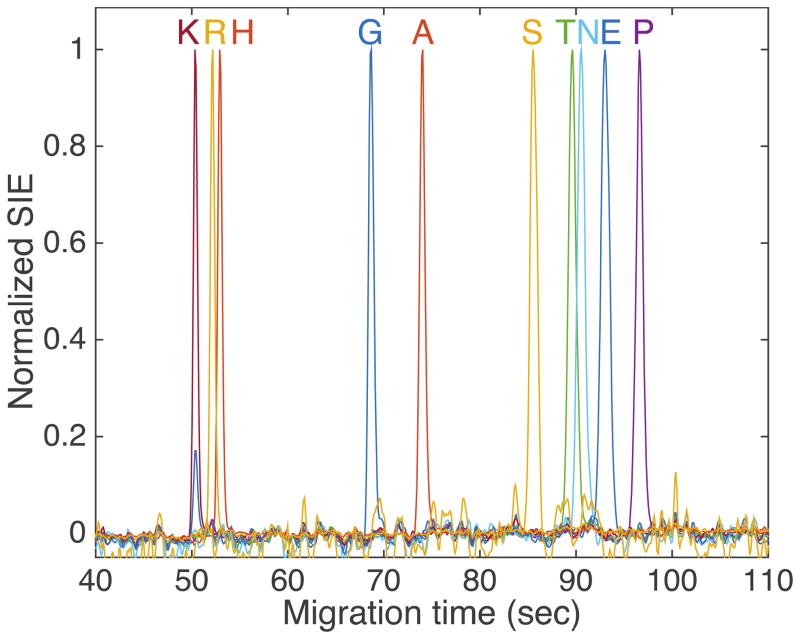
Figure 1 presents a high-speed separation of ten amino acids. The amino acids migrate within a ~50 second separation window, framed by lysine and proline, and a total analysis time of less than 100 seconds. Plate counts and detection limits are presented in Table 2. Plate counts range from 50,000 to 85,000 and appear to be dominated by injection volume; an Ohms plot of current vs. applied potential was linear (Supplementary materials), which indicates that the resistance of the buffer-filled capillary was constant across the range of 5–29 kV. Joule heating was removed as the source of degrading peak resolution in this experiment.
Figure 1.
Separation of ten amino acids. Peaks labeled by single letter amino acid symbol. Selected ion electropherograms extracted with a resolution of 500. Data were treated with a first order Lowess filter with a span of 10 and a Gaussian kernel.
Table 2.
Characteristics of high speed amino acid peaks
| Amino acid | Peak width (s) | S/N | Plate count | LOD (μM) | LOD(fmol) |
|---|---|---|---|---|---|
| Gly | 0.3 | 70 | 60000 | 6.1 ± 1.5 | 1.7 ± 0.4 |
| Ala | 0.3 | 110 | 84000 | 5.6 ± 0.5 | 1.4 ± 0.1 |
| Ser | 0.3 | 30 | 59000 | 15 ± 3 | 3.4 ± 0.7 |
| Pro | 0.4 | 110 | 85000 | 3.5 ± 0.6 | 0.7 ± 0.1 |
| Thr | 0.4 | 100 | 51000 | 4.3 ± 0.2 | 0.92 ± 0.05 |
| Asn | 0.5 | 40 | 59000 | 9 ± 1 | 1.5 ± 0.2 |
| Lys | 0.2 | 180 | 61000 | 1.9 ± 0.2 | 0.9 ± 0.1 |
| Glu | 0.4 | 90 | 51000 | 3.5 ± 0.7 | 0.8 ± 0.2 |
| His | 0.2 | 440 | 62000 | 0.9 ± 0.3 | 0.4 ± 0.1 |
| Arg | 0.2 | 290 | 58000 | 1.0 ± 0.3 | 0.5 ± 0.1 |
Average peak widths were extracted from the selection ion electropherograms of figure 1. Data were fit with the Gaussian function Signal(t) = A exp(−0.5* (t − t0)2/sigma2), where t is time, t0 is the peak’s migration time, A is peak amplitude, and sigma is the peak width expressed as the standard deviation of the Gaussian function. Limits of detection are presented as the average ± one standard deviation determined from three successive runs. Peak width is expressed as sigma; to convert to full width at half height, this value should be multiplied by 2.35. Detection limits correspond to that amount of analyte that generates a signal three times above the standard deviation of the baseline.
Concentration detection limits were in the low micromolar range and mass detection limits were in the high attomole to low femtomole range, Table 1. The superior mass detection limits reflect the very small injection volumes used in this experiment, which were a few hundred picoliters. This small injection volume is a result of the use of a very narrow inner diameter capillary (20 μm) and the absence of any stacking used in the injection. Improved concentration detection limits are anticipated from the use of stacking or a pH junction in future experiments, which allow use of larger injection volumes without a significant increase in peak width [27, 28].
A twenty-amino-acid-standards mixture was further analyzed by the CZE-MS system. In order to improve the separation efficiency of the CZE-MS system, we made several major changes. First, the analysis employed the third-generation electro-kinetically pumped sheath-flow interface. This interface includes a large spray emitter opening size and very short distance between separation capillary etched tip and spray emitter orifice [24], which reduces the sample diffusion in the spray emitter. Second, a longer separation capillary (45 cm) and lower separation voltage (14 kV across the separation capillary) were used. Third, the sample buffer was 0.04% (v/v) formic acid containing 30% (v/v) acetonitrile, and its conductivity is much lower than the separation buffer (0.5% (v/v) formic acid), which produces significant sample staking during separation, improving the separation efficiency.
Figure 2 shows the extracted ion electropherogram of 20 amino acids analyzed by the improved CZE-MS system. The separation can be completed in around 7 min, which is longer than that in Figure 1, but the improved CZE-MS system produced much longer separation window (~3 min vs. ~1 min) and much higher number of theoretical plates (on average >200, 000 vs. ~60, 000), Table 3. It is important to note that almost-baseline resolution of structural isomers, leucine and isoleucine, was obtained with the improved system, Figure 3, suggesting the high separation efficiency.
Figure 2.
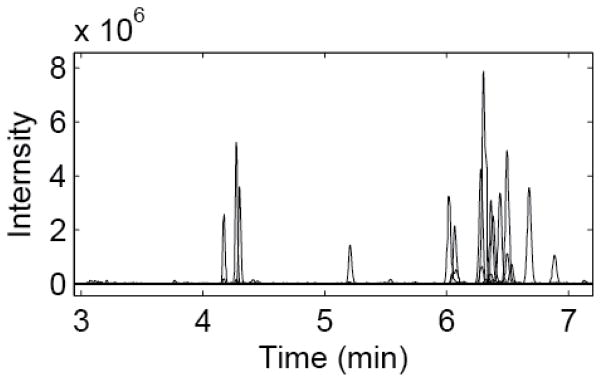
Extracted ion electropherogram of 20 amino acids analyzed by CZE-MS. Migration order (in single letter amino acid code): C, K, R, H, G, A, V, S, N, T, L, W, M, I, Q, E, F, Y, P, D. The electropherograms were treated with a first order Lowess filter with a span of 10 and a Gaussian kernel.
Table 3.
Characteristics of amino acid peaks with improved CE-MS system
| Amino Acid | Plate count |
|---|---|
| Cysteine | 140000 |
| Lysine | 300000 |
| Arginine | 310000 |
| Histidine | 260000 |
| Glycine | 260000 |
| Alanine | 170000 |
| Valine | 220000 |
| Serine | 240000 |
| Asparagine | 50000 |
| Threonine | 180000 |
| Leucine | 170000 |
| Tryptophan | 280000 |
| Methionine | 360000 |
| Isoleucine | 150000 |
| Glutamine | 150000 |
| Glutamic acid | 210000 |
| Phenylalanine | 240000 |
| Tyrosine | 230000 |
| Proline | 230000 |
| Aspartic acid | 200000 |
Amino acids, in order of migration. List of theoretical plate counts.
Figure 3.
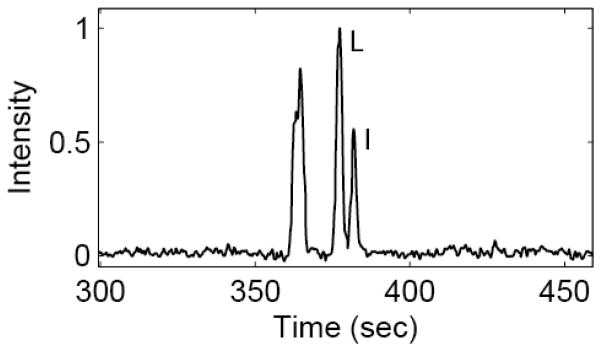
Zoomed extracted ion electropherogram of leucine (L) and isoleucine (I) of Figure 2. The electropherograms were treated with a first order Lowess filter with a span of 10 and a Gaussian kernel.
In terms of the stability of the CZE-MS system, the main concern is the electrospray emitter. The first and second-generation of electro-kinetically pumped sheath-flow interfaces [16, 21] employ spray emitters with ~8 μm opening size, which are susceptible to plugging. The lifetime of the 8 μm spray emitter is typically one day. The third-generation interface [24] employs much larger spray emitter (up to ~35 μm opening size), which produces a much longer lifetime. In previous work, the third-generation interface-based automated CZE-MS system generated over 5,000 min continuous analysis of BSA digest with good reproducibility, suggesting the good stability and reproducibility of the system [24].
3.2 High-speed CE-MS for BSA digests
The second-generation electrokinetically pumped sheath flow interface [21] based CZE-MS system was evaluated for an ultrafast separation of a BSA digest. 1000 V/cm was applied to a short separation capillary (28 cm) with a small inner diameter (10 μm) and was coupled to a Q-Exactive mass spectrometer with maximum acquisition speed of 12 Hz (at 17,500 resolution).
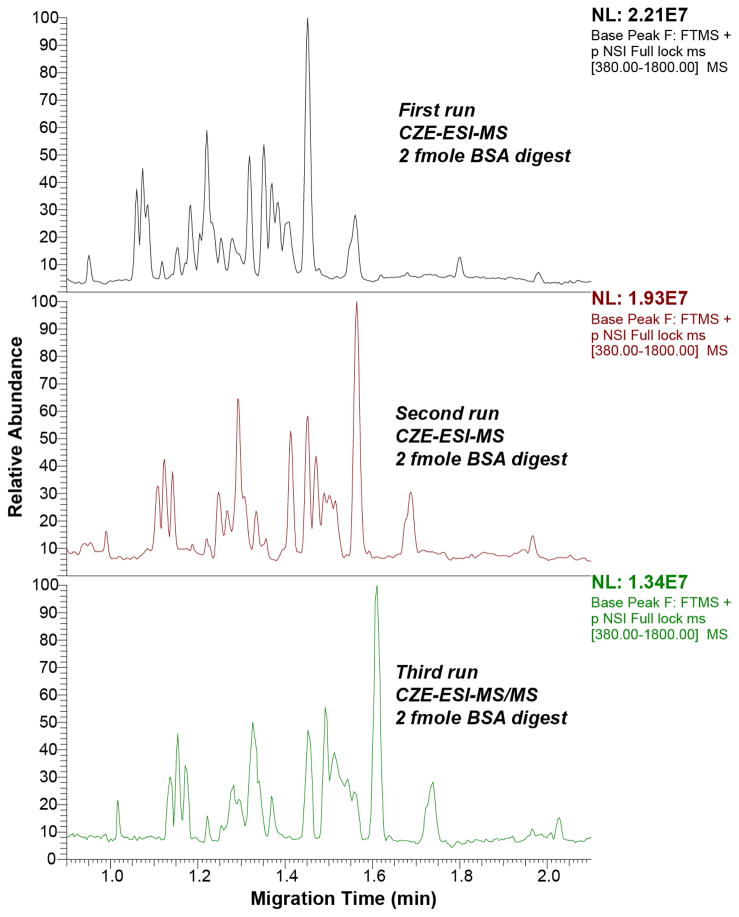
Figure 4 shows the base peak electropherogram of a BSA digest analyzed by the CZE-ESI-MS system in triplicate, demonstrating system stability and reproducibility for multiple runs. It needs to be noted that the peptide intensity in the third run is significantly lower than the first and second runs, which is most likely due to the tandem spectra acquisition performed in the third run. The separation requires less than two minutes and is also reasonably efficient; extracted ion peaks of five peptides produced efficiencies between 50,000 and 100,000 plates, Figure 5. Peak widths, estimated as the standard deviation of a Gaussian function fit to the peak, averaged roughly 700 ms, which corresponds to a peak capacity of roughly 40 across the one-minute separation window.
Figure 4.
Triplicate base peak electropherograms of BSA digest analyzed by high-speed CZE-ESI-MS and MS/MS. BSA digest loading amount was 2 fmole each run.
Figure 5.
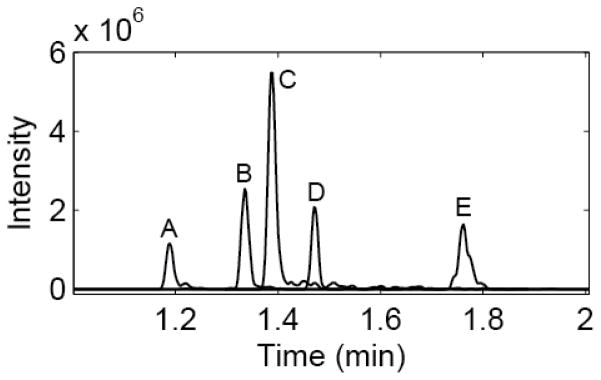
Extracted ion chromatograms of 5 peptides from the BSA digest. Peptides A-E m/z values are 495.78268, 732.29779, 409.71646, 820.47290 and 862.92096, respectively. Plate counts range from 50,000 to 100,000. Peak widths average 700 ms, with a peak capacity of 40 across the 1 minute separation window.
CZE-MS/MS analysis of the BSA digest generated 31 BSA peptide identifications corresponding to 52% sequence coverage from 2 fmole of BSA digest. The result suggests that the ultrafast separation and detection system will be valuable for high-throughput protein digests analysis. Around 300 tandem spectra were acquired from a single two-minute run of BSA digest, and 85 tandem spectra were matched to peptides. The number of matched tandem spectra and peptide identifications can be improved after further optimizations of the mass spectrometer parameters.
It is interesting to compare the present results with the recent work from Moini and Martinez [14]. The present work employs an electrokinetically pumped sheath flow interface [16, 21, 24] to couple the CZE separation to the mass spectrometer. This interface is compatible with a wide range of separation buffers because the sheath liquid, rather than the separation buffer, supports electrospray, which gives great flexibility. In contrast, Moini and Martinez employed a sheathless CE-MS interface [14] where the CZE separation buffer must also support electrospray, which limits the choices of the separation buffer.
Additionally, the distal end of the capillary in the present interface was etched to a 20-μm thickness, allowing the capillary to remain quite robust. In contrast, the porous electrospray emitter used by Moini and Martinez was etched to a wall thickness of 2 μm or less [14], which makes it very fragile.
Finally, the present high-speed separation took twice as long (2 min vs. ~1 min), due to the use of a longer capillary, and employed a larger i.d. capillary (10 μm vs. ≤ 5 μm), which allows a four-fold larger injection volume and proportional improvement in the concentration detection limit. The 10 μm i.d. capillary improves the system robustness over a ≤5 μm i.d. capillary because it is much less likely to become clogged over time.
4. Conclusions
The results demonstrate that CZE with an electrokinetically-pumped nanospray interface is capable of generating very rapid separations. However, mass spectrometer speed and sensitivity are crucial for detection. The Q-Exactive was running twice as fast as the LTQ XL (12 Hz vs. 4–6 Hz), which allowed for faster separations upstream. In addition, the sensitivity on the Q-Exactive permitted smaller injections onto a narrower separation capillary (10 μm i.d. for BSA digests, 20 μm i.d. for amino acids), which reduced peak tailing and overlap. The narrower capillary i.d. also allowed use of higher separation voltages, and consequently increased separation speed, without excessive Joule heating.
Highlights.
We demonstrate a two-minute CZE-ESI-MS separation of an amino acid mixture.
We demonstrate a two-minute CZE-ESI-MS separation of a BSA digest.
We demonstrate 52% sequence coverage for BSA in the separation.
We also demonstrate a peak capacity of ~50.
Acknowledgments
We thank Dr. Bill Boggess, Dr. Matthew Champion and Dr. Carlos Gartner for technical assistance toward the completion of this work. This work was supported by the National Institutes of Health (R01GM096767).
Footnotes
Publisher's Disclaimer: This is a PDF file of an unedited manuscript that has been accepted for publication. As a service to our customers we are providing this early version of the manuscript. The manuscript will undergo copyediting, typesetting, and review of the resulting proof before it is published in its final citable form. Please note that during the production process errors may be discovered which could affect the content, and all legal disclaimers that apply to the journal pertain.
References
- 1.Monnig CA, Jorgenson JW. On-column sample gating for high-speed capillary zone electrophoresis. Anal Chem. 1991;63:802–807. doi: 10.1021/ac00008a013. [DOI] [PubMed] [Google Scholar]
- 2.Moore AW, Jr, Jorgenson JW. Study of zone broadening in optically gated high-speed capillary electrophoresis. Anal Chem. 1993;65:3550–3560. doi: 10.1021/ac00072a004. [DOI] [PubMed] [Google Scholar]
- 3.Tao L, Kennedy RT. Measurement of antibody-antigen dissociation constants using fast capillary electrophoresis with laser-induced fluorescence detection. Electrophoresis. 1997;18:112–117. doi: 10.1002/elps.1150180121. [DOI] [PubMed] [Google Scholar]
- 4.Hutterer KM, Jorgenson JW. Ultrahigh-voltage capillary zone electrophoresis. Anal Chem. 1999;71:1293–1297. doi: 10.1021/ac981221e. [DOI] [PubMed] [Google Scholar]
- 5.Yan JY, Best N, Zhang JZ, Ren HJ, Jiang R, Hou J, Dovichi NJ. The limiting mobility of DNA sequencing fragments for both cross-linked and noncross-linked polymers in capillary electrophoresis: DNA sequencing at 1200 V cm−1. Electrophoresis. 1996;17:1037–1045. doi: 10.1002/elps.1150170611. [DOI] [PubMed] [Google Scholar]
- 6.Smith RD, Barinaga CJ, Udseth HR. Improved electrospray ionization interface for capillary zone electrophoresis - mass-spectrometry. Anal Chem. 1988;60:1948–1952. [Google Scholar]
- 7.Maxwell EJ, Chen DDY. Twenty years of interface development for capillary electrophoresis-electrospray ionization-mass spectrometry. Anal Chim Acta. 2008;627:25–33. doi: 10.1016/j.aca.2008.06.034. [DOI] [PubMed] [Google Scholar]
- 8.Banks JF, Jr, Dresch T. Detection of fast capillary electrophoresis peptide and protein separations using electrospray ionization with a time-of-flight mass spectrometer. Anal Chem. 1996;68:1480–1485. doi: 10.1021/ac9509824. [DOI] [PubMed] [Google Scholar]
- 9.Banks JF. Recent advances in capillary electrophoresis/electrospray/mass spectrometry. Electrophoresis. 1997;18:2255–2266. doi: 10.1002/elps.1150181216. [DOI] [PubMed] [Google Scholar]
- 10.Matysik FM, Neusüß C, Pelzing M. Fast capillary electrophoresis coupled with time-of-flight mass spectrometry under separation conditions of high electrical field strengths. Analyst. 2008;133:1764–1766. doi: 10.1039/b806349d. [DOI] [PubMed] [Google Scholar]
- 11.Matysik FM. Advances in fast electrophoretic separations based on short capillaries. Anal Bioanal Chem. 2010;397:961–965. doi: 10.1007/s00216-010-3586-y. [DOI] [PubMed] [Google Scholar]
- 12.Grundmann M, Matysik FM. Fast capillary electrophoresis-time-of-flight mass spectrometry using capillaries with inner diameters ranging from 75 to 5 μm. Anal Bioanal Chem. 2011;400:269–278. doi: 10.1007/s00216-011-4719-7. [DOI] [PubMed] [Google Scholar]
- 13.Grundmann M, Rothenhöfer M, Bernhardt G, Buschauer A, Matysik FM. Fast counter-electroosmotic capillary electrophoresis-time-of-flight mass spectrometry of hyaluronan oligosaccharides. Anal Bioanal Chem. 2012;402:2617–2623. doi: 10.1007/s00216-011-5254-2. [DOI] [PubMed] [Google Scholar]
- 14.Moini M, Martinez B. Ultrafast capillary electrophoresis/mass spectrometry with adjustable porous tip for a rapid analysis of protein digest in about a minute. Rapid Commun Mass Spectrom. 2014;28:305–10. doi: 10.1002/rcm.6786. [DOI] [PubMed] [Google Scholar]
- 15.Wojcik R, Li Y, Maccoss MJ, Dovichi NJ. Capillary electrophoresis with Orbitrap-Velos mass spectrometry detection. Talanta. 2012;88:324–329. doi: 10.1016/j.talanta.2011.10.048. [DOI] [PMC free article] [PubMed] [Google Scholar]
- 16.Wojcik R, Dada OO, Sadilek M, Dovichi NJ. Simplified capillary electrophoresis nanospray sheath-flow interface for high efficiency and sensitive peptide analysis. Rapid Commun Mass Spectrom. 2010;24:2554–2560. doi: 10.1002/rcm.4672. [DOI] [PubMed] [Google Scholar]
- 17.Wojcik R, Giardina M, Wheeler M, Keithley RB, Chetwani N, Go DB, Dovichi NJ. High resolution time-of-flight mass spectrometry with high speed data acquisition for sampling sub-second peak widths generated by capillary electrophoresis. 60th ASMS Conference on Mass Spectrometry; 2012; Vancouver, B.C. [Google Scholar]
- 18.Sun L, Zhu G, Yan X, Champion MM, Dovichi NJ. Capillary zone electrophoresis for analysis of complex proteomes using an electrokinetically pumped sheath flow nanospray interface. Proteomics. 2014;14:622–628. doi: 10.1002/pmic.201300295. [DOI] [PMC free article] [PubMed] [Google Scholar]
- 19.Zhu G, Sun L, Yan X, Dovichi NJ. Stable, reproducible, and automated capillary zone electrophoresis-tandem mass spectrometry system with an electrokinetically pumped sheath-flow nanospray interface. Analytica Chimica Acta. 2014;810:94–98. doi: 10.1016/j.aca.2013.11.057. [DOI] [PMC free article] [PubMed] [Google Scholar]
- 20.Zhu G, Sun L, Yan X, Dovichi NJ. Single shot proteomics using capillary zone electrophoresis-electrospray ionization-tandem mass spectrometry with production of more than 1250 Escherichia coli peptide identifications in a 50 min separation. Anal Chem. 2013;85:2569–2573. doi: 10.1021/ac303750g. [DOI] [PMC free article] [PubMed] [Google Scholar]
- 21.Sun L, Zhu G, Zhao Y, Yan X, Mou S, Dovichi NJ. Ultrasensitive and fast bottom-up analysis of femtogram amounts of complex proteome digests. Angew Chem Int Ed. 2013;52:13661–13664. doi: 10.1002/anie.201308139. [DOI] [PMC free article] [PubMed] [Google Scholar]
- 22.Li Y, Compton PD, Tran JC, Ntai I, Kelleher NL. Optimizing capillary electrophoresis for top-down proteomics of 30–80 kDa proteins. Proteomics. 2014;14:1158–1164. doi: 10.1002/pmic.201300381. [DOI] [PMC free article] [PubMed] [Google Scholar]
- 23.Sun L, Hebert SA, Yan X, Zhao Y, Westphall MS, Rush MJ, Zhu G, Champion MM, Coon JJ, Dovichi NJ. Over 10 000 peptide identifications from the HeLa proteome by using single-shot capillary zone electrophoresis combined with tandem mass spectrometry. Angew Chem Int Ed Engl. 2014;53:13931–13933. doi: 10.1002/anie.201409075. [DOI] [PMC free article] [PubMed] [Google Scholar]
- 24.Sun L, Zhu G, Zhang Z, Mou S, Dovichi NJ. Third-generation electrokinetically pumped sheath flow nanospray interface with improved stability and sensitivity for automated capillary zone electrophoresis-mass spectrometry analysis of complex proteome digests. J Proteome Res. 2015 doi: 10.1021/acs.jproteome.5b00100. [DOI] [PMC free article] [PubMed] [Google Scholar]
- 25.Cox J, Mann M. MaxQuant enables high peptide identification rates, individualized p.p.b.-range mass accuracies and proteome-wide protein quantification. Nat Biotechnol. 2008;26:1367–1372. doi: 10.1038/nbt.1511. [DOI] [PubMed] [Google Scholar]
- 26.Cox J, Neuhauser N, Michalski A, Scheltema RA, Olsen JV, Mann M. Andromeda: a peptide search engine integrated into the MaxQuant environment. J Proteome Res. 2011;10:1794–1805. doi: 10.1021/pr101065j. [DOI] [PubMed] [Google Scholar]
- 27.Britz-McKibbin P, Chen DD. Selective focusing of catecholamines and weakly acidic compounds by capillary electrophoresis using a dynamic pH junction. Anal Chem. 2000;72:1242–1252. doi: 10.1021/ac990898e. [DOI] [PubMed] [Google Scholar]
- 28.Zhu G, Sun GL, Yan X, Dovichi NJ. Bottom-up proteomics of escherichia coli using dynamic pH junction preconcentration and capillary zone electrophoresis-electrospray ionization-tandem mass spectrometry. Anal Chem. 2014;86:6331–6336. doi: 10.1021/ac5004486. [DOI] [PMC free article] [PubMed] [Google Scholar]


