Abstract
Many monoclonal antibodies (mAbs) and other protein drugs have targets usually residing within tissues, making tissue concentrations of mAbs relevant to their pharmacologic effects. Therefore, knowledge of tissue distribution kinetics is important to better understand their pharmacokinetics and pharmacodynamics. The tissue distribution of mAbs is affected by many physiologic factors that may be altered in disease status. In the present work, we studied the tissue distribution kinetics of the fusion protein etanercept in inflamed joint tissues and examined the impact of inflammation on the tissue distribution of etanercept. Etanercept concentration profiles in plasma, blister fluid, and different tissues were obtained from healthy and collagen-induced arthritic (CIA) rats by use of a fluorescence quantification method via IRDye800CW labeling. Stepwise minimal and full physiologically based pharmacokinetic (PBPK) approaches were applied to characterize the distribution kinetics of etanercept in tissues in healthy and diseased animals. Etanercept exhibited modest tissue access (tissue/plasma area under the concentration curve [AUC] ratios 0.03–0.15 and estimated tissue reflection coefficients [σ] of 0.6–1.0), but with good penetration into arthritic paws (tissue/plasma AUC ratio 0.23 and σ 0.36). Etanercept exposure in the inflamed paws of CIA rats was approximately 3-fold higher than in normal paws taken from either CIA or healthy rats (tissue/plasma AUC ratios 0.23 versus 0.07 and σ 0.36 versus 0.71). The tissue distribution kinetics of etanercept in arthritic paws were well characterized with PBPK modeling approaches. Etanercept shows good penetration to arthritic paws in CIA rats. Our study indicates that inflammation produced increased tissue distribution of etanercept in CIA rats.
Introduction
Rheumatoid arthritis (RA) is a chronic inflammatory disease exhibiting persistent inflammation, hyperplasia, and infiltration of immune cells in the joint synovial tissues (Choy and Panayi, 2001). The soluble cytokine tumor necrosis factor α (TNF-α) plays a pivotal role in the pathogenesis of RA. TNF-α is secreted by mononuclear cells in synovial fluid and interacts with TNF receptor locally. Through autocrine and paracrine mechanisms it exerts a proinflammatory effect (Brennan et al., 1992). In patients with active RA, serum and synovial fluid TNF-α concentrations are elevated compared with healthy subjects (Hopkins and Meager, 1988; Edrees et al., 2005). Etanercept is used for the treatment of RA by specifically binding to TNF-α with high affinity, neutralizing it and therefore blocking its proinflammatory activity in synovial fluid (Culy and Keating, 2002).
Etanercept is a dimeric fusion protein consisting of two ligand-binding domains of human p75 tumor necrosis factor receptor and the human IgG1 Fc portion (Scott, 2014). The plasma pharmacokinetics of etanercept have been well studied in various species (Lon et al., 2011; Zhou et al., 2011). However, information on the distribution kinetics of etanercept to inflamed joint tissues is lacking. As the drug concentration at the target site determines the magnitude of the pharmacologic effects, knowledge of etanercept distribution in the joints is important to better understand the pharmacokinetics and pharmacodynamics. With a molecular size of 150 kD and high hydrophilicity, etanercept is likely to show limited tissue distribution, making its concentration in inflamed joint tissue a major determinant of the pharmacodynamic effects.
The tissue distribution of monoclonal antibodies (mAbs) and other protein drugs is affected by physiologic factors such as blood flow, tissue permeability, and the expression and turnover rate of their target antigens (Tabrizi et al., 2010). Therefore, changes in physiologic status may alter the tissue distribution of these macromolecular drugs. RA causes increased vascular permeability as well as joint tissue edema, which would lead to increased tissue distribution of large molecules (Bell et al., 1983). Although the plasma pharmacokinetics of etanercept is not significantly altered in patients with RA compared with healthy subjects (Zhou et al., 2011), whether RA will alter the tissue distribution of etanercept has not been investigated and remains unclear.
We investigated the tissue distribution of etanercept to the inflamed joint tissue and examined the impact of inflammation on the kinetics of this distribution using the collagen-induced arthritic (CIA) rat model. This is a well-established animal model that mirrors human RA. We previously studied the plasma pharmacokinetics of etanercept using this animal model (Lon et al., 2011), and the present study extends our work by examining the tissue distribution kinetics of etanercept.
Materials and Methods
Drug.
Etanercept (Immunex Corporation, Thousand Oaks, CA) was diluted with vehicle (10 mg/ml sucrose, 5.8 mg/ml sodium chloride, 5.3 mg/ml l-arginine hydrochloride, 2.6 mg/ml sodium phosphate monobasic monohydrate, and 0.9 mg/ml sodium phosphate dibasic anhydrous, pH 6.3 ± 0.2) and was stored at 2–8°C before use.
IRDye800CW Labeling.
Etanercept in the injection solution was first subjected to a buffer exchange with phosphate-buffered saline (PBS), pH 7.8, using Zeba desalting spin columns (5 ml; Pierce Biotechnology, Rockford, IL) followed by dilution to 1 mg/ml. IRDye 800CW Protein Labeling Kit–High Molecular was used for etanercept labeling according to the manufacturer’s instructions (LI-COR Biosciences, Lincoln, NB). Briefly, 200 µl of 1 M potassium phosphate buffer (pH 9.0) was added into 2 ml of 1 mg/ml etanercept in PBS to adjust the pH to 8.5. Dye was resuspended in water (25 μl) and 15.5 μl was added dropwise to the etanercept solution, then it was incubated at room temperature for 2 hours in the dark. Free dye was then removed by Zeba desalting spin columns. The IRDye800CW-etanercept (I-E) conjugates were stored at −20°C until use.
Characterization and Stability of IRDye800CW-Etanercept (I-E) Conjugates.
To calculate the dye/etanercept (D/P) ratio and concentration of I-E conjugates, the conjugates were diluted with PBS/methanol (9:1) to determine the UV absorbances (A) at 280 and 780 nm. The following equations were applied in these calculations.Dye/etanercept ratio:
 |
(1) |
Final etanercept concentration:
 |
(2) |
where εdye is the molar extinction coefficient of the IRDye800CW at 780 nm, which was 270,000 M−1 • cm−1 according to manufacturer’s product manual. The molar extinction coefficient of etanercept (εetanercept) at 280 nm is assumed to be equal to that of IgG1 (203,000 M−1 • cm−1).
Ten percent denaturing SDS-PAGE was performed to examine the conjugation of etanercept with IRDye800CW. The stability of IRDye800CW-labeled etanercept in plasma was examined by incubation in normal rat plasma. Briefly, the stock solution of labeled etanercept was spiked into plasma and incubated at 37°C for up to 15 days. The spiked plasma was sampled over time, and the fluorescence was measured in a 96-well plate using the Odyssey Infrared Imaging System (LI-COR Biosciences).
Animals.
Male Lewis rats, aged 6 to 9 weeks, were purchased from Harlan (Indianapolis, IN). The animals were housed individually in the University Laboratory Animal Facility and acclimatized for 1 week under constant temperature (22°C), humidity (72%), and 12-hour light/dark cycles. Rats had free access to food and water. All protocols followed the Principles of Laboratory Animal Care (NRC, 1996) and were approved by the University at Buffalo Institutional Animal Care and Use Committee.
Induction of CIA in Lewis Rats.
The induction of CIA in Lewis rats was performed following procedures described previously elsewhere (Earp et al., 2008; Lon et al., 2011). The required reagents were purchased from Chondrex (Redmond, WA). Thirty Lewis rats were used for induction, and around 60% successfully developed CIA in one or both hind paws.
Suction Blister Technique.
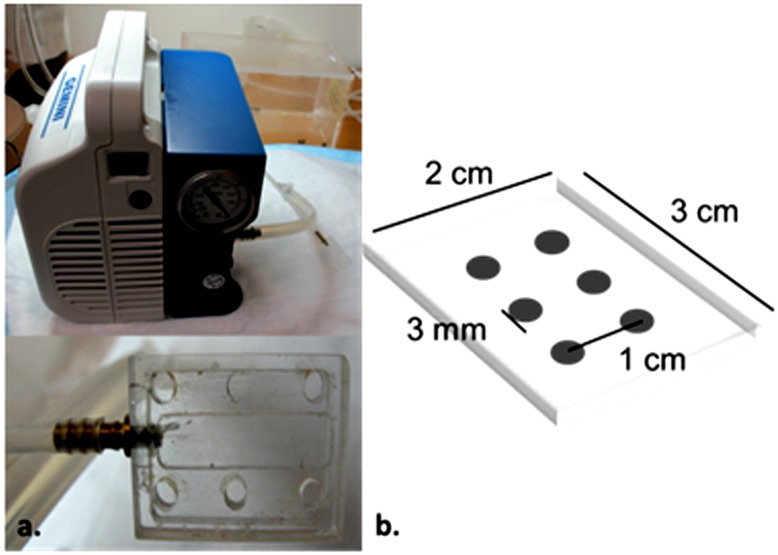
A suction technique was applied to obtain skin blister fluid. Previous studies have shown that under well-controlled experimental conditions, the composition of sampled blister fluid closely resembles interstitial fluid (ISF) (Kiistala, 1968; Herfst and van Rees, 1978). Therefore, blister fluid was assumed to serve as a surrogate for skin ISF. An acrylic device for producing suction blisters was manufactured in-house that was similar to the device used for sampling human blister fluid reported by Kiistala (1968). Modifications were made to the plate to fit the skin area on the back of the rats. A Welch Gemini dry vacuum pump model 2060 (Welch-Ilmvac, Niles, IL) was used to provide constant pressure. A picture of the device and the dimensions of the plate are shown in Fig. 1. The widths of the edges as well as the distance between the holes of the plate were carefully designed to minimize possible skin damage.
Fig. 1.
(A) Picture of the device for creating suction blisters. (B) Dimensions of the attached plate.
The animals were subjected to epilation using Nair hair removal lotion (Church & Dwight Co., Ewing, NJ) 1 day before suctioning. Smooth skin was observed with no rash.
To perform blister suctioning, the animals were anesthetized by inhalation of 2% isoflurane, and the plate was placed on the smooth skin area on the upper back of the epilated rat. Medical tape was used to wrap the plate to make sure it sealed well on the skin surface. The pump was turned on, and the pressure was gradually tuned to −150 mm Hg and maintained for 2 hours. Upon completion of suctioning, the plate was gently removed, and the blister fluid samples were collected with a 29 ga/1/2 ml syringe.
Pharmacokinetics of IRDye800CW-Etanercept Conjugates.
CIA rats were used 21 days after induction, which corresponds to peak edema in arthritic paws. Healthy (n = 18) and CIA Lewis rats (n = 17) weighing around 250 g were dosed with 5 mg/kg I-E conjugates subcutaneously (s.c.). The suction blister technique was applied at 6 hours, 12 hours, and 1, 2, 4, 7, and 11 days. At each time point, three animals were sampled for blister fluid (except for day 7, when two CIA rats were sampled). After blister fluid was collected, the rats were sacrificed by exsanguination from the abdominal aorta, and blood samples as well as tissue samples (liver, heart, spleen, lung, kidney, adipose tissues, gastrocnemius muscle, and paw) were harvested. The blister fluid samples were kept on ice and stored at −80°C. The blood samples were immediately centrifuged at 2000g, 4°C, for 15 minutes. The plasma fraction was then obtained, aliquoted, and stored at −80°C. The tissue samples were immediately placed in liquid nitrogen and stored at −80°C.
Tissue Protein Extraction.
Frozen tissue samples were pulverized in liquid nitrogen. Preweighed tissue powder was placed in tissue protein extraction solution (DSTPES) purchased from Dualsystem Biotech (Schlieren, Switzerland) containing 0.5% complete mini-protease-inhibitor (Roche Applied Science, Vilvoorde, Belgium) (1 ml/175 mg tissue). The resuspended tissue was shaken for 30 minutes at room temperature. Supernatants were obtained after centrifugation at 20,000g, 4°C, for 15 minutes and stored at −80°C.
Quantification of IRDye800CW-Etanercept Conjugates by Fluorescence.
Briefly, the stock solution of I-E conjugates was spiked into diluted blank plasma or blank tissue protein extracts to prepare a set of seven standards (ranging from 7.8 to 500 ng/ml). Plasma samples were diluted 50-fold with PBS, and blister fluid samples were diluted 10- or 50-fold with PBS to the desired linear concentration range. The tissue protein extracts were directly measured without dilution except for those from the kidney (1/4 dilution in PBS). Fluorescence (excitation = 778 nm; emission = 800 nm) of each 75-μl sample and standard was measured in a 96-well plate with the Odyssey Infrared Imaging System. The concentrations in unknown samples were determined from the standard curve. Due to the loss of intensity of fluorescence over time, the measured concentrations in plasma, blister fluid, and tissues were corrected with a biexponential decay function based on the in vitro stability of I-E conjugates in plasma:
| (3) |
The plasma concentration of the labeled etanercept was also quantified by enzyme-linked immunosorbent assay (ELISA) for validation purposes. The ELISA procedures were described previously elsewhere (Lon et al., 2011).
Tissue protein extracts were further subjected to 10% SDS-PAGE to determine the fluorescence intensity of the intact conjugate band as well as the fragment bands. The estimated fraction of the intact conjugate was used to calculate intact labeled etanercept concentrations in tissues.
Data Analysis.
The area under the concentration time curve (AUCinf) of I-E conjugates in plasma, blister fluid, and tissues was estimated by the trapezoidal rule using WinNonlin 6.1 (Phoenix, Pharsight Corporation, Palo Alto, CA).
Mathematical Modeling.
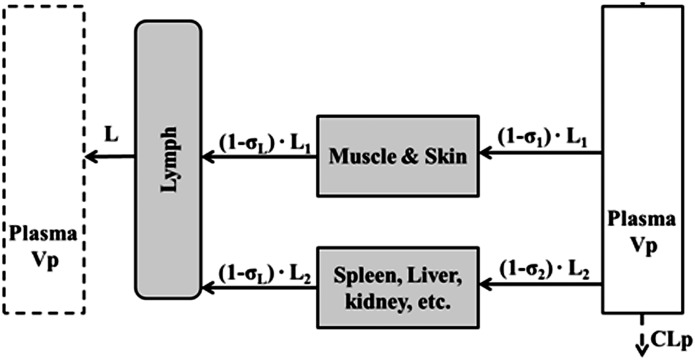
A stepwise modeling approach was applied to characterize the plasma and tissue disposition of etanercept. First, plasma concentration profiles from the present study together with our previously published data (Lon et al., 2011) were fitted with a minimal physiologically based pharmacokinetics (mPBPK) model to describe the disposition of etanercept. The model includes plasma, lymph, and two lumped tissue compartments connected in an anatomic manner, as shown in Fig. 2 (Cao et al., 2013). The nonlinear absorption and mixed linear and Michaelis-Menten elimination of etanercept in CIA rats were assumed based on previous studies (Lon et al., 2011). The linear clearance was assumed for healthy animals for simplicity. The model is described by a set of differential equations:
 |
(4) |
 |
(5) |
 |
(6) |
 |
(7) |
where Cp is the plasma concentration in Vp (plasma volume) and Ctight and Cleaky are ISF concentrations in two types of lumped tissues categorized by the leakiness of vasculature (continuous and fenestrated). The Vtight (0.65 • ISF • Kp, where Kp is the available fraction of ISF for antibody distribution) and Vleaky (0.35 • ISF • Kp) are ISF volumes of the two lumped tissues, and Vlymph is the lymph volume, which is assumed equal to blood volume. L is the total lymph flow rate, and L1 and L2 account for 1/3 and 2/3 of the total lymph flow. The σ1 and σ2 are vascular reflection coefficients for leaky and tight tissues. The σL is the lymphatic capillary reflection coefficient assumed to be 0.2.
Fig. 2.
Scheme of the mPBPK model used for characterization of the disposition of I-E conjugates in step 1. Tissues are lumped into two spaces according to their vascular structure. Tissue compartments are connected with plasma and lymph in an anatomic manner. Convection and lymphatic drainage are assumed to be the dominant tissue uptake and elimination pathways.
For CIA rats:
 |
(8a) |
For healthy controls:
| (8b) |
Etanercept is assumed to be eliminated from plasma, and CLdis and CLhea represent the linear clearances in CIA and healthy animals. An additional Vmax/ Km term was used to account for the nonlinear clearance in CIA rats.
The input functions are:
| (9) |
where
 |
(10a) |
| (10b) |
The absorption of etanercept is described as zero-order (k0) followed by first-order absorption (k1) after the time period τ, which is consistent with previous studies (Lon et al., 2011). The F is the bioavailability for s.c. administration. The Fr represents the fraction of the dose that undergoes first-order absorption, and ka is the absorption rate constant.
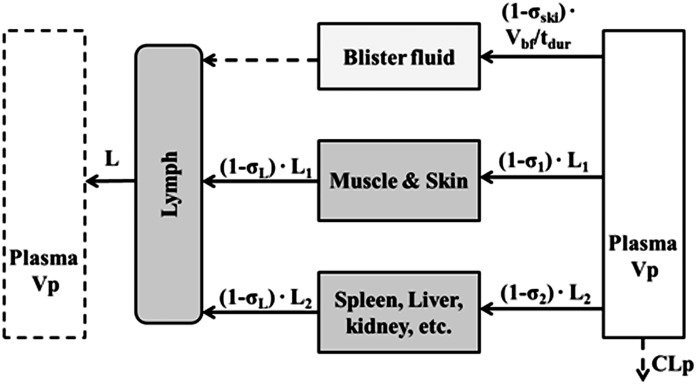
In the next step, parameter values estimated from the previous model were fixed to fit the blister fluid concentration profiles in healthy and CIA animals. The blister compartment was incorporated into the mPBPK model as shown in Fig. 3. The concentration of etanercept in blister fluid can be described as:
 |
(11) |
where Cbf represents the etanercept concentration in blister fluid, Vbf is the total volume of blister fluid yield during the duration of suction (tdur = 2 hours), σski is the vascular reflection coefficient of the skin. The inflow of the blister fluid compartment is derived by dividing Vbf by tdur, and the outflow is negligible.
Fig. 3.
Scheme for incorporating blister fluid into the mPBPK model to examine the distribution of I-E conjugates in skin interstitial space in step 2. The flow rate is determined by dividing volume of formed blisters (Vbf) by the duration of suction (tdur). The outflow of the blister fluid is negligible (dashed line).
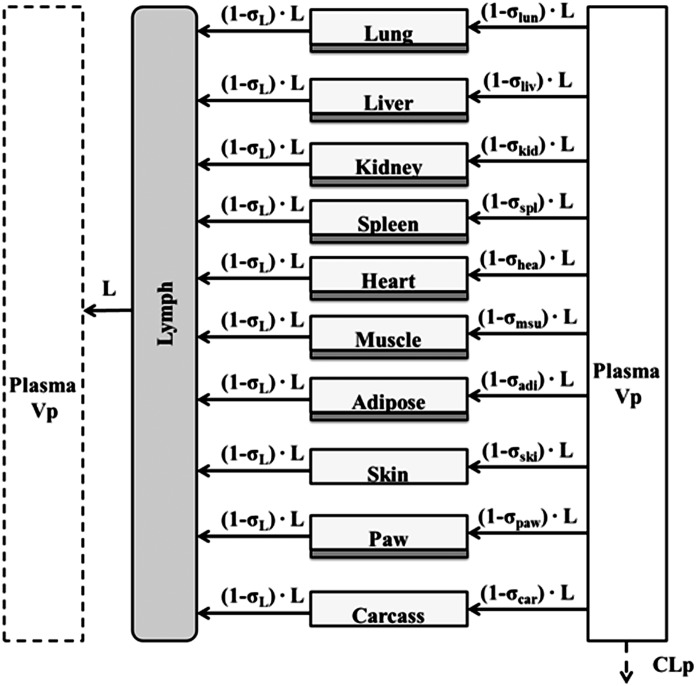
Finally, a modified full PBPK model was developed to characterize the distribution of etanercept in various tissues, including healthy and arthritic paws. Major organs and tissues included in this model are liver, lung, kidney, spleen, heart, skin, muscle, adipose, carcass remaining tissues, and paw. Figure 4 shows the model structure. The modified PBPK model is based on previous published PBPK models but with some simplifications (Garg, 2007). Tissue ISF is assumed to be the major extravascular space for mAb distribution. The distribution of etanercept from plasma to tissue interstitial space is dominated by convection. Lymphatic drainage is the primary pathway for tissue clearance. Shown are the mass balance equations for plasma, lymph, and tissue compartments:
 |
(12) |
 |
(13) |
 |
(14) |
where Ctis_isf is the tissue ISF concentration, the Visf and Ltis are the ISF volume and lymph flow rate of each tissue and organ, and σtis is the vascular reflection coefficient of a specific organ.
Fig. 4.
Scheme of the full PBPK model for characterization of biodistribution of I-E conjugates in various tissues in step 3. All major organs included in the model are connected by plasma. Convection and lymphatic drainage are assumed the dominant tissue uptake and elimination pathways. Whole tissue concentrations were measured, but divided into interstitial space (light gray) and cell space (dark gray).
The measured tissue concentration is total tissue concentration; therefore, the observed tissue concentration is:
 |
(15) |
where Ctis is the total tissue concentration, Vres is the volume of residual plasma in the tissue, and Vtot is the total tissue volume.
A normal paw weighs around 0.5 g in the rat with a body weight 280 g. The arthritic paw size is about 1.5-fold greater due to inflammation and edema. In the model, the tissue volume and the available volume of ISF for etanercept distribution in arthritic paw increases by 0.5-fold of the ISF volume in normal paws (Kp • ISFnormal + 0.5• ISFnormal).
The physiologic parameters for plasma, lymph, and tissue ISF and total volume were obtained from the literature (Shah and Betts, 2012). The residual plasma volume was assumed to be 6% of the total tissue volume for lung and spleen, 3% for kidney, liver, and heart, and 1.5% for muscle, paw, and adipose. This assumption is based on the average measurements from the literature and assuming the hematocrit is 45% in rats (Bernareggi and Rowland, 1991; Baxter et al., 1994; Garg, 2007). The total lymph flow rate was allometrically scaled from human (2.9 l/day) with a factor of 0.74. The lymph flow rates of tissues were derived from the total flow rate based on the fraction of their blood flow rates. The ISF volume of paw was obtained by assuming that 1 g of tissue yields 1 ml volume and that ISF accounts for 15% of total paw tissue volume. The physiologic parameter values used for model fitting are listed in Table 1.
TABLE 1.
Physiologic parameters associated with the physiologically based pharmacokinetic model
| Tissue | Total Tissue Volume (Vtot)a | Interstitial Volume (Visf)a | Lymphatic Flow Rate (Ltis)b | Residual Plasma Volume (% Vres/Vtot)c |
|---|---|---|---|---|
| ml | ml/h | |||
| Lung | 1.4 | 0.263 | 0.8291 | 6 |
| Liver | 15.7 | 2.56 | 0.2307 | 3 |
| Kidney | 2.41 | 0.361 | 0.1028 | 3 |
| Spleen | 2.77 | 0.554 | 0.0504 | 6 |
| Heart | 1.02 | 0.146 | 0.0425 | 3 |
| Muscle | 122 | 15.8 | 0.2604 | 1.5 |
| Adipose | 33.1 | 5.63 | 0.0631 | 1.5 |
| Paw | 0.5d | 0.075d | Estimated | 1.5 |
| Skin | 49.9 | 16.5 | 0.0563 | 1.5 |
| Carcass | 6.75 | 0.224 | 1.5 | |
| Plasma | 9.06 | |||
| Lymph | 16.47 | |||
| Total | 48.71 | 1.86 | ||
Physiologic parameter values obtained from (Shah and Betts, 2012).
Lymphatic flow rate in each tissue is estimated as the product of the relative ratio of the blood flow of that tissue (Shah and Betts, 2012) and the total lymphatic flow rate. Liver blood flow is assumed to be the sum of blood flows in the liver, spleen, small intestine, and pancreas. Total lymphatic flow rate is allometrically scaled from human (2.9 l/day) with exponent factor 0.74.
Average value of literature reports (Bernareggi and Rowland, 1991; Baxter et al., 1994; Garg, 2007).
Assuming interstitial space accounts for 15% of total tissue volume.
Model fittings were performed by nonlinear regression analysis using the maximum likelihood algorithm in ADAPT 5 (D’Argenio et al., 2009). The variance model used is:
| (16) |
where Vi is the variance of the ith observation, σa and σp are additive and proportional variance model parameters, and Yi is the ith model prediction. The goodness-of-fit was evaluated by objective function values and diagnostic plots.
Results
IRDye800CW Labeling and Stability of IRDye800CW Etanercept Conjugates.
Etanercept conjugated with IRDye800CW exhibited a D/P ratio of 2.5:1. The measured concentration of the I-E conjugates was 1.01 mg/ml, which is close to the etanercept concentration (1 mg/ml) used in the labeling reaction. This suggests that there was no loss of etanercept during the reaction and purification process.
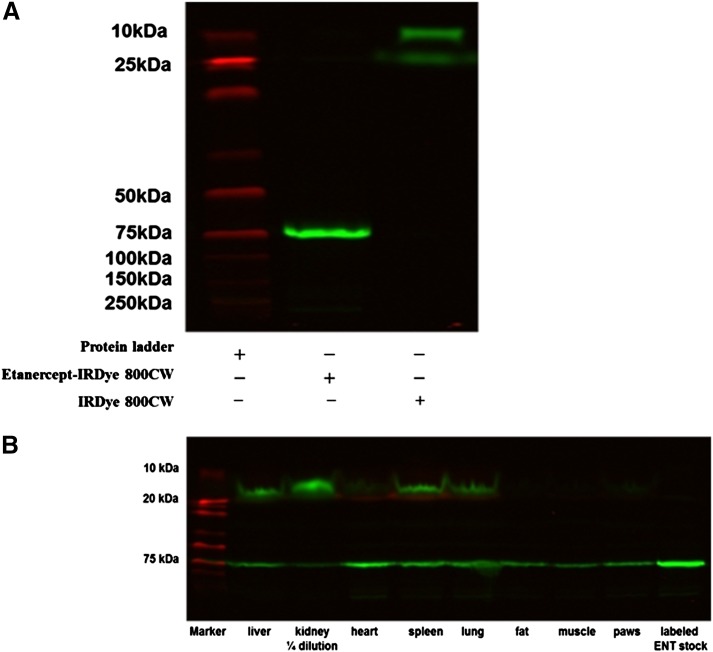
The I-E conjugates were subjected to SDS-PAGE to characterize the conjugation of IRDye800CW with etanercept. As shown in Fig. 5A, a clear single band of IRDye800CW etanercept conjugates was detected, which corresponds to a single arm of etanercept (75 kDa). This indicated that etanercept was labeled with IRDye800CW successfully and no degradation or free dye occurred.
Fig. 5.
(A) Characterization of I-E conjugates by SDS-PAGE. (B) SDS-PAGE of I-E conjugates in tissue protein extracts at 2 days.
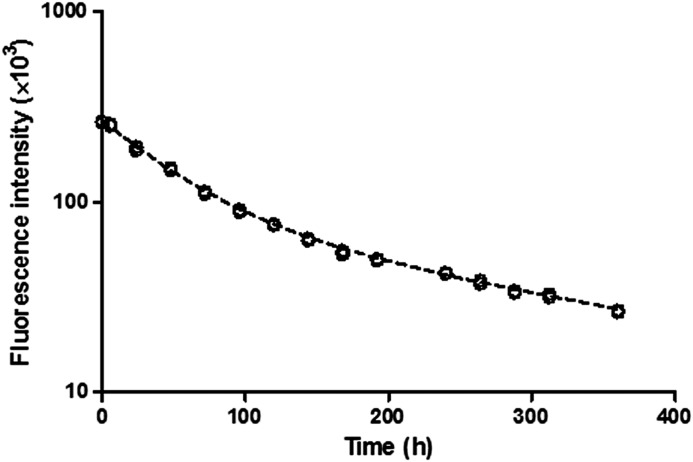
In the stability study, IRDye800CW labeled etanercept was incubated in plasma at 37°C for over 15 days. The measured fluorescence showed a loss of intensity over time (Fig. 6), which could be characterized by a biexponential function (eq. 3). SDS-PAGE was performed with the samples, and the results showed no sign of degradation (data not presented). This indicated that the loss of fluorescence intensity is not likely caused by degradation of the conjugates.
Fig. 6.
Fluorescence of I-E conjugates in plasma with time in the stability study. A biexponential decay function was used to characterize the loss of fluorescence signal (dashed curve).
Quantification of IRDye800CW Etanercept Conjugates.
The I-E conjugates in plasma and tissues were measured by fluorescence and adjusted using the biexponential decay function. Plasma concentrations of etanercept were also determined by ELISA for comparison and validation. Measurements by fluorescence suggested altered plasma pharmacokinetics (less etanercept exposure). However, after adjustment using the decay function, the plasma concentration profile was consistent with that measured by ELISA and with our previous pharmacokinetic studies of etanercept (Lon et al., 2011). The measured tissue concentrations of I-E conjugates by fluorescence indicated significantly increased liver and kidney uptake, which was partially attributed to the presence of a greater amount of IRDye800CW protein fragments, as shown in the SDS-PAGE results in Fig. 5B. The tissue concentrations of the intact conjugate were then estimated with the relative percentage of fluorescence intensity of the intact conjugate band.
Pharmacokinetics of IRDye800CW-Etanercept Conjugates.
The AUC of intact I-E conjugate concentrations in all tissues as well as plasma and blister fluid concentrations for healthy and CIA rats were first determined. The parameters are listed in Table 1. Slightly increased clearance of I-E conjugates was observed in CIA rats. Exposure of I-E conjugates in blister fluid was 1.5-fold greater in CIA rats compared with healthy controls. In both healthy and CIA rats, the biodistribution of I-E conjugates was more extensive in liver, spleen, lung, kidney, and heart, with tissue/plasma AUC ratios of 7%–15% compared with fat and muscle (tissue/plasma AUC ratios of 3%–6%). Etanercept exposure in inflamed paws in CIA rats was 3-fold higher than in normal paws (tissue/plasma AUC ratios of 0.23 versus 0.07).
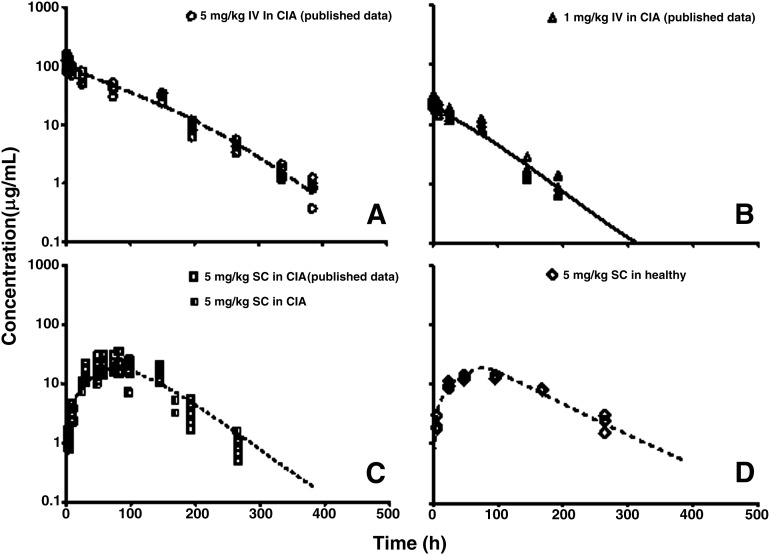
The stepwise modeling approach was used to characterize tissue biodistribution of I-E conjugates in healthy and CIA rats. In the first step, plasma concentration profiles in healthy and CIA rats were fitted with the mPBPK model to describe the disposition characteristics of I-E conjugates. Model fittings of the plasma concentration profiles are presented in Fig. 7, and parameter estimates are listed in Table 2. The estimated values of the parameters related to s.c. absorption correspond well with previous results (Lon et al., 2011). The mixed clearance mechanism of etanercept in CIA rats was assumed in the present model, which gave more flexibility in describing the elimination of etanercept. The estimated vascular reflection coefficients (σ1 and σ2) suggest a moderate interstitial distribution of etanercept.
Fig. 7.
Plasma etanercept concentrations versus time profiles in CIA rats after (A–C) 5 mg/kg i.v., 1 mg/kg i.v., and 5 mg/kg s.c. and (D) healthy controls after 5 mg/kg s.c. doses of etanercept. Symbols are measured etanercept concentrations in the present study and from our previous published data. Curves depict model fittings.
TABLE 2.
Plasma and tissue AUC values and ratios for healthy and CIA rats
| Tissue | AUC0–264 h | Tissue/Plasma AUC Ratio | ||
|---|---|---|---|---|
| Healthy (SD)a | CIA (SD)a | Healthy | CIA | |
| μg/ml • h | ||||
| Lung | 285.6 (39.0) | 248.3 (52.2) | 0.1290 | 0.1490 |
| Liver | 110.1 (32.4) | 135.7 (29.5) | 0.0487 | 0.0939 |
| Kidneyb | 177.1 (19.5) | 334.7 (55.2) | 0.0783 | 0.2320 |
| Spleen | 172.4 (35.8) | 121.2 (20.1) | 0.0762 | 0.0838 |
| Heart | 207.1 (34.4) | 111.4 (19.7) | 0.0916 | 0.0771 |
| Muscle | 80.9 (12.7) | 88.3 (24.8) | 0.0358 | 0.0611 |
| Adipose | 88.5 (20.3) | 87.9 (34.7) | 0.0391 | 0.0608 |
| Paw | 148.6 (21.8) | 338.6 (82.9) | 0.0657 | 0.2340 |
| Blister fluid | 970.2 (293.7) | 1006.6 (412.3) | 0.4290 | 0.6960 |
| Plasma | 2260.9 (213.6) | 1445.2 (370.6) | ||
SD of AUC0–264 h was calculated using NCA with sparse sampling using WinNonlin 6.1 (Nedelman and Jia, 1998; Holder, 2001).
Concentrations of etanercept in kidney used for calculation of AUC are subject to poor data quality.
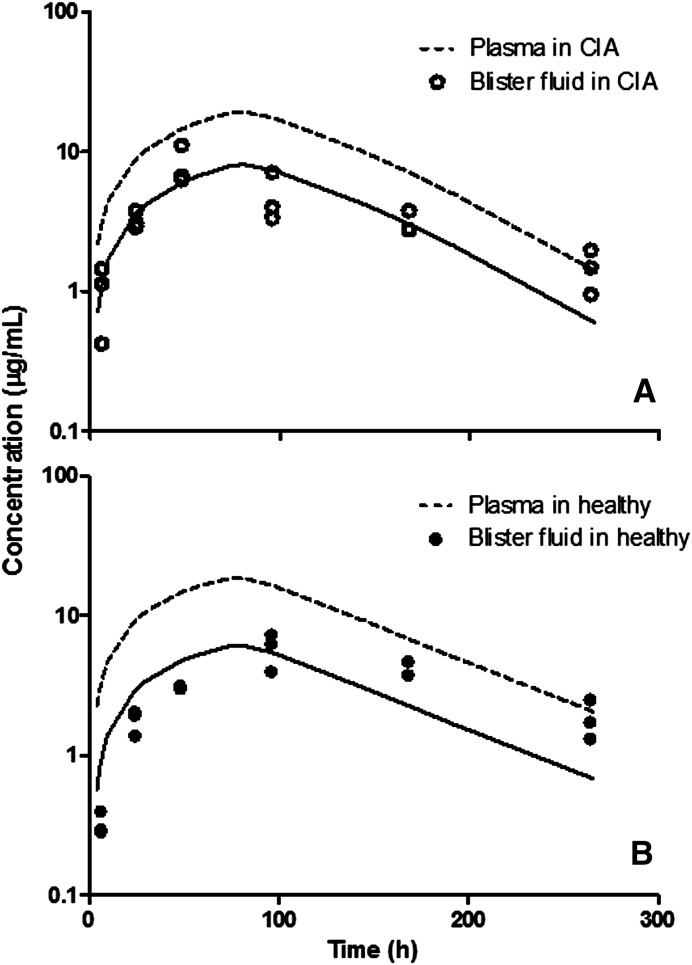
In the next step, an additional blister fluid compartment was included in the mPBPK model to characterize labeled etanercept concentration profiles in blister fluid in CIA and healthy rats. Parameter estimates from the previous step were fixed. The model-fitted profiles are presented in Fig. 8, and parameter estimates are listed in Table 2. Despite the variability of the measurements, the model is able to describe the general trend of etanercept concentration profiles in blister fluid. The σski in healthy animals is slightly greater than that in CIA rats, indicating a slight increase in vascular permeability in CIA rats compared with healthy controls.
Fig. 8.
Blister fluid concentrations versus time profiles in (A) CIA rats and (B) healthy controls. Symbols are concentration measurements, solid lines depict model fittings, and dashed lines represent simulated plasma concentration profiles.
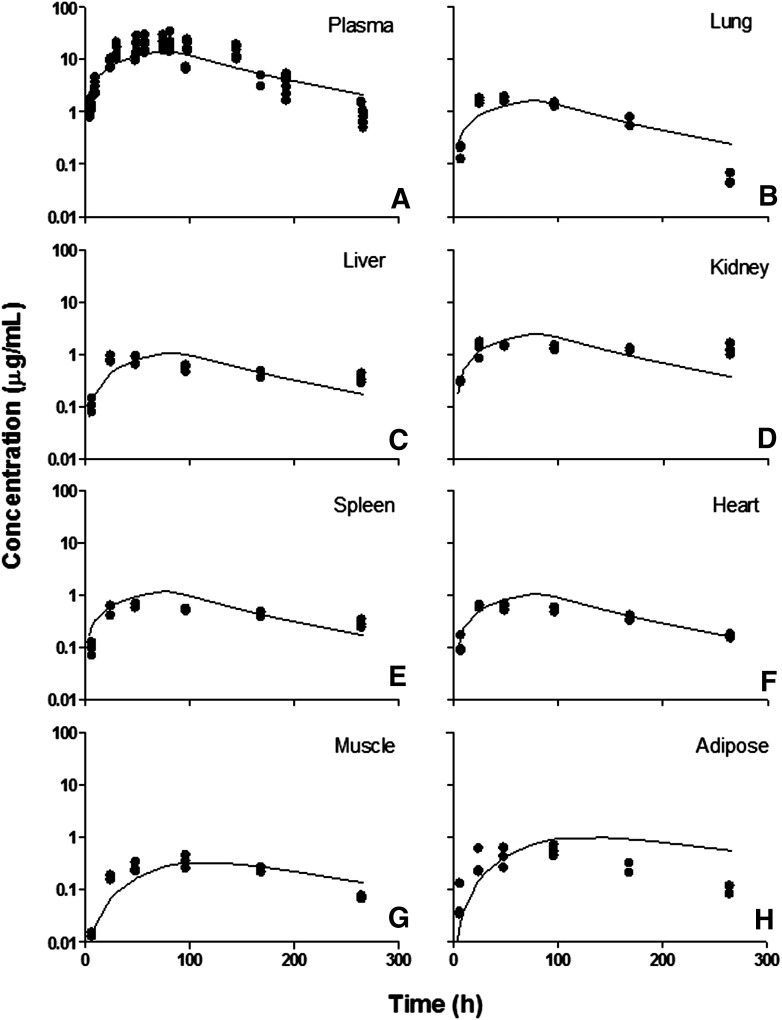
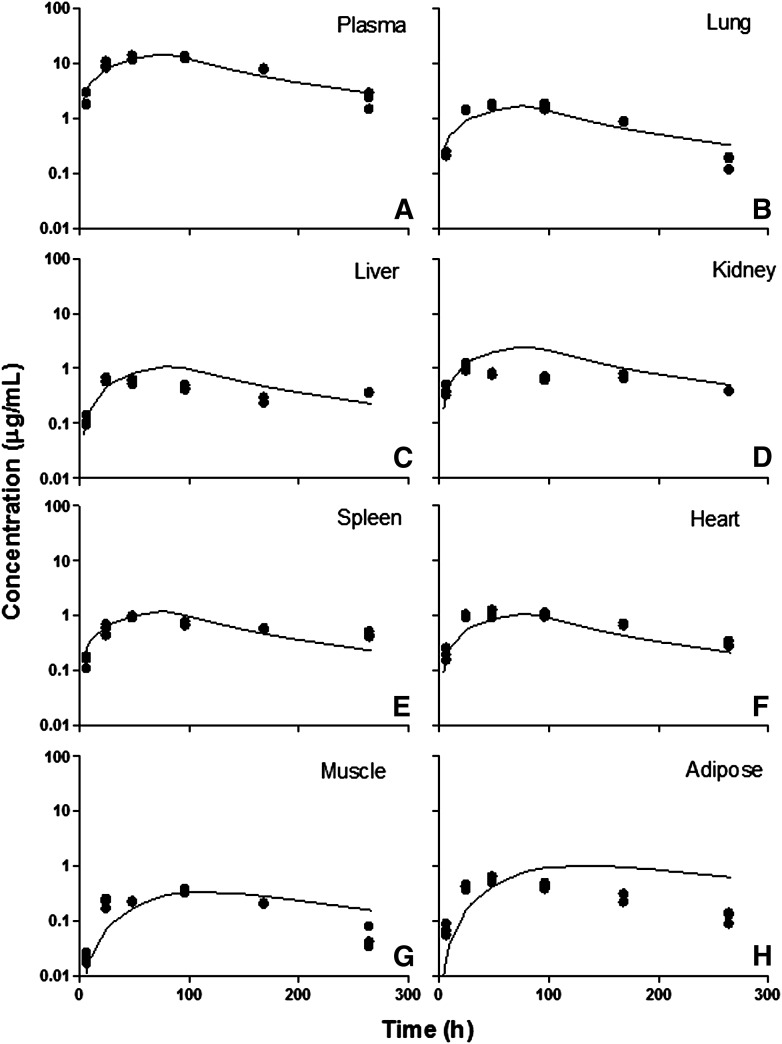
The full PBPK model was finally applied to describe the tissue distribution of I-E conjugates in healthy and CIA rats. Total tissue concentrations were used for model fitting, which is represented in the model output as the drug amount in the residual plasma and interstitial spaces divided by the total tissue volume. Residual plasma volumes were assigned using values within the literature-reported range (Table 3). Model-fitted profiles are presented in Fig. 9 for CIA rats and Fig. 10 for healthy controls. Parameter estimates are listed in Table 3.
TABLE 3.
Summary of mPBPK and PBPK model parameter estimates
| Parameter | Definition | Estimate | CV% |
|---|---|---|---|
| Step 1 | |||
| ka (1/h) | First-order absorption rate constant | 0.0380 | 40.0 |
| F | Bioavailability of s.c. administration | 0.42 | Fixed |
| Fr | Fraction of dose undergoing k1 process | 0.237 | 14.5 |
| CLhea (ml/h) | Linear clearance in healthy rats | 0.243 | 8.06 |
| CLdis (ml/h) | Linear clearance in CIA rats | 0.125 | 12.0 |
| Vmax (μg/h) | Michaelis-Menten capacity constant | 1.36 | 53.3 |
| Km (μg/ml) | Michaelis-Menten affinity constant | 5.62 | 75.3 |
| σ1 | Vascular reflection coefficient of tight tissue | 0.998 | 0.00432 |
| σ2 | Vascular reflection coefficient of leaky tissue | 0.766 | 3.38 |
| τ (h) | Time period for k0 process | 72 | Fixed |
| Step 2 | |||
| σski_dis | Skin vascular reflection coefficient in CIA rats | 0.6151 | 7.28 |
| σski_hea | Skin vascular reflection coefficient in healthy rats | 0.6649 | 6.35 |
| Vbf (ml) | Average volume of blister fluid formed in 2-hour suction | 0.05 | Fixed |
| Step 3 | |||
| σlun | Lung vascular reflection coefficient | 0.7640 | 6.68 |
| σliv | Liver vascular reflection coefficient | 0.8971 | 4.41 |
| σkid | Kidney vascular reflection coefficient | 0.8000 | Fixed |
| σspl | Spleen vascular reflection coefficient | 0.8860 | 3.88 |
| σhea | Heart vascular reflection coefficient | 0.7796 | 6.36 |
| σmus | Muscle vascular reflection coefficient | 0.9900 | 4.33 |
| σadi | Adipose vascular reflection coefficient | 0.8973 | 4.87 |
| σpaw dis | Paw vascular reflection coefficient in CIA rats | 0.3571 | 23.5 |
| σpaw hea | Paw vascular reflection coefficient in healthy rats | 0.7105 | 7.60 |
| σcar | Vascular reflection coefficient in carcass | 0.6259 | 18.6 |
| Lpaw | Lymphatic flow rate in healthy rats | 0.01425 | 71.5 |
| faCIA | Fraction increase of paw interstitial fluid | 0.5 | Fixed |
Fig. 9.
Tissue etanercept concentration versus time profiles in CIA rats. (A) Plasma, (B) lung, (C) liver, (D) kidney, (E) spleen, (F) heart, (G) muscle, and (H) adipose. Symbols are tissue concentration measurements, and curves depict PBPK model fittings.
Fig. 10.
Tissue etanercept concentration versus time profiles in healthy rats. (A) Plasma, (B) lung, (C) liver, (D) kidney, (E) spleen, (F) heart, (G) muscle, and (H) adipose. Symbols are tissue concentration measurements, and curves depict PBPK model fittings.
There were no significant differences in tissue exposures in liver, lung, heart, kidney, and spleen in healthy and diseased animals. The AUC values showed slightly increased tissue distribution in CIA rats in muscle and adipose tissue. However, the model was not able to differentiate the change in permeability in these tissues in CIA rats. In general, etanercept shows modest tissue distribution consistent with mAbs. In tissues such as lung, liver, kidney, spleen, and heart, the distribution of etanercept was more extensive (σ values are in the range of 0.7–0.9) compared with muscle and adipose (σ values are greater than 0.9). The kidney σkid value could not be estimated and was fixed to 0.8 due to the poor quality of the kidney data.
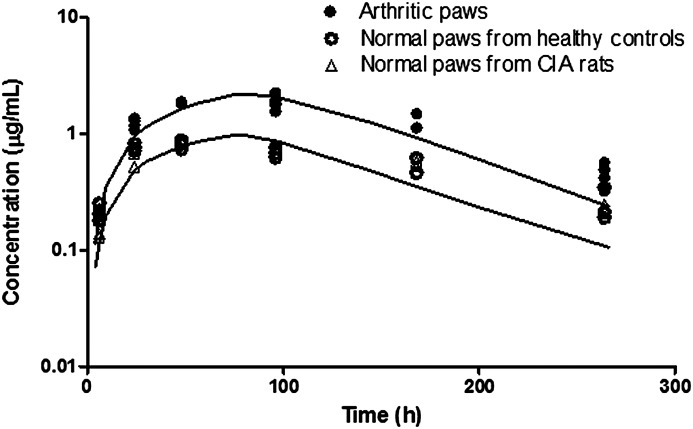
With inflammation, arthritic paws are subject to increased extravascular protein infiltration and edema. Increased extravascular protein infiltration is caused by increased vascular permeability. This is reflected as a change in vascular reflection coefficient σ in the model. Paw edema is due to the buildup and retention of fluid in the extravascular space caused by inflammatory responses. Arthritic paws exhibited edema and showed on average a 1.5-fold increase in volume as indicated by measured paw sizes. The model assumed a 1.5-fold increase in paw ISF in arthritic paws with the increase reflecting the free fluid phase (the volume of the gel phase does not expand in edema) (Wiederhielm, 1979). Therefore, the interstitial volume for etanercept distribution is (Kp • ISFnormal + 0.5 • ISFnormal). Also, the lymph flow rates, considered as the clearance of ISF, are correlated with interstitial volumes at equilibrium. Therefore, in arthritic paws the lymph flow rate is also increased by 0.5-fold. Figure 11 shows the fitted concentration curves in arthritic and normal paws.
Fig. 11.
Etanercept concentration versus time profiles in healthy and arthritic paws. Symbols are tissue concentration measurements, and curves depict model fittings.
Similar etanercept distribution profiles have been observed in paws from healthy controls and nonaffected paws from CIA rats. Arthritic paws showed increased etanercept exposure compared with normal paws. The estimated values of σpaw_dis and σpaw_hea indicate a 2-fold increase in vascular permeability in arthritic paws. This corresponds to a simulation study conducted previously, which suggested that a 4-fold change of vascular permeability will cause a 3-fold increase in ISF volume (Wiederhielm, 1979). The lymph flow rate in normal paws is estimated to be 0.01425 ml/h, which is 10-fold faster compared with the same mass amount of muscle. This may be due to either insufficient data at the early time points or the frequency of muscle movement in the paw.
Discussion
Overall, etanercept exhibits modest tissue distribution as suggested using both mPBPK and PBPK models. The observed tissue/plasma AUC ratios in all major organs correspond well with the reported values of typical mAbs (Shah and Betts, 2013). Also, traditional compartment models have indicated limited tissue distribution of etanercept (Korth-Bradley et al., 2000; Lon et al., 2011). However, more extensive distribution of etanercept was observed in arthritic paws (tissue/plasma AUC is 0.23). The estimated σpaw_dis suggests that etanercept could penetrate well into arthritic paws, which is in agreement with the sparse data of etanercept concentrations reported in synovial fluid in RA patients (Zhou, 2005).
Although nonlinear clearance was observed in the plasma pharmacokinetics of etanercept in CIA rats, the plasma concentration profile of etanercept in CIA rats was not altered significantly in comparison with healthy controls. However, a significant increase in the tissue distribution of etanercept in arthritic paws was observed in CIA rats (tissue/plasma AUC ratios 0.23 versus 0.07 in healthy animals), suggesting that inflammation profoundly altered the tissue distribution of etanercept without causing significant differences in the plasma pharmacokinetics. This is likely to be attributed to increased vascular permeability and fluid retention in interstitial space caused by inflammation in arthritic paws. It has been previously reported that during high-permeability edema in skin caused by bradykinin, lymph flow was increased, and the hydration of matrix and the degree of protein exclusion in the interstitial space changed. All these physiologic alterations led to increased protein concentrations in tissue interstitial space (Bell et al., 1983).
In other tissues, only modest increases of etanercept exposure were observed in the muscle and adipose tissue in CIA rats, and no significant differences were found in the liver, lung, kidney, heart, and spleen between CIA rats and healthy controls. This implies that inflammation may have a minimal impact on these tissues. However, because etanercept concentrations in these tissues were measured as whole tissue concentrations, which are subject to residual blood contamination, the impact of inflammation on tissue exposure of etanercept might be confounded by this factor. We then directly approached collection of ISF from skin using the blister suction technique to avoid blood contamination. Our results indicate that without the confounding effect from residual blood, a 1.5-fold increase in skin interstitial distribution was observed in CIA rats (tissue/plasma AUC ratios 0.43 versus 0.70).
The blister suction technique was previously applied in examining the pharmacokinetics and tissue penetration of small molecule drugs in skin interstitial space (Bernard et al., 1994; Chosidow et al., 1996; Mazzei et al., 2000). For the first time we used this technique to study tissue interstitial distribution of a protein drug. Unlike small molecule drugs, the rate and extent of etanercept distribution in blister fluid is governed by both fluid flow rates during suction and vascular permeability. These contributing factors are well considered with the PBPK modeling approaches.
We first applied a simplified PBPK model to characterize the tissue distribution kinetics of etanercept. The rationale is that 1) convection and lymphatic drainage are assumed to be the dominant pathways for mAb tissue uptake and elimination, and 2) tissue ISF is assumed to be the major extravascular space for mAb tissue distribution (Cao et al., 2013). The simplified PBPK model offers the advantage of assessing the distribution of etanercept in tissue sites of interest, and it yields physiologically relevant parameter estimates in comparison with compartmental models. Also, with reasonable assumptions, the tissue compartment structure is simplified from a full PBPK model. The model can describe the tissue concentrations and can yield reasonable parameter estimates. However, the estimated values of tissue vascular reflection coefficients are highly dependent on the set of values of residual plasma volume used in modeling, which are somewhat variable in the literature. Therefore, to obtain a more precise estimation of tissue permeability, residual blood contamination should be minimized, and if feasible the drug concentrations in tissue interstitial space should be directly sought.
For the quantification of etanercept, the IRDye800CW-labeling approach was applied. Although radiolabeling is traditionally used for mAb quantification in tissues, it requires stringent laboratory regulations. In contrast, IRDye800CW is a near-infrared fluorescent probe providing enhanced signal recovery and high signal-to-noise contrast (Adams et al., 2007). The ease of use, in addition to being cost-effective and requiring no special laboratory restrictions, makes this approach fairly attractive.
Previous studies have assessed the utility of IRDye800 as a quantitative tracer for mAb quantification in plasma and tissues, but controversial observations and conclusions were made. Comparable plasma concentration profiles for up to 24 hours measured by fluorescence and ELISA have been observed for bevacizumab with a high dye/protein labeling ratio (3.5) (Wu et al., 2012). Another study concluded that IRDye800 in a low dye/protein labeling ratio does not significantly alter the pharmacokinetics of cetuximab, which has a relatively short half-life (2.5 days) (Zinn et al., 2015). In contrast, altered mAb pharmacokinetics in plasma and tissues were observed for bevacizumab, cetuximab, and mouse monoclonal IgG1 (8C2), featuring increased plasma elimination and liver uptake (Cohen et al., 2011; Conner et al., 2014). We also observed the apparent increased plasma elimination as well as enhanced liver and kidney uptake of etanercept measured by fluorescence. However, after correction with a decay function as suggested by the in vitro stability study, the plasma concentration profile corresponds well to that measured by ELISA. This indicates that the IRDye800CW-labeling does not significantly alter etanercept plasma pharmacokinetics. The SDS-PAGE of tissue protein extracts showed the presence of increased IRDye800CW-etanercept conjugate fragments in the liver and kidney, which is likely due to the long residual time of IRDye800CW in tissue cells after endocytosis. This is likely to account for the observed enhanced liver and kidney uptake.
In conclusion, along with our previous studies of the plasma pharmacokinetics of etanercept, we have characterized the tissue distribution kinetics of etanercept in arthritic rats. We have shown that etanercept penetrates well into the arthritic paws in CIA rats. For macromolecular drugs, the exposure of drug at the target tissue site is a major determinant of the pharmacodynamic effects. The obtained information for etanercept distribution in joints will help in better understanding its dose–response relationship. The impact of inflammation in the tissue distribution of etanercept was featured. Altered tissue distribution kinetics of etanercept was observed in CIA rats, which we attribute to the increased vascular permeability and fluid retention in the interstitial spaces in the proposed PBPK model. Rodents and humans are considered similar anatomically. The knowledge obtained from the rat will aid in the translation to humans and the prediction of etanercept exposure in the inflamed tissues in RA patients.
Abbreviations
- A
UV absorbances
- AUC
area under the concentration curve
- CIA
collagen-induced arthritic
- D/P ratio
dye/etanercept ratio
- εetanercept
molar extinction coefficient of etanercept
- ELISA
enzyme-linked immunosorbent assay
- I-E
IRDye800CW-etanercept
- ISF
interstitial fluid
- mAbs
monoclonal antibodies
- mPBPK
minimal PBPK
- PBPK
physiologically based pharmacokinetics
- PBS
phosphate-buffered saline
- RA
rheumatoid arthritis
- σ
reflection coefficient
- TNF-α
tumor necrosis factor α
Authorship Contributions
Participated in research design: Chen, DuBois, Almon, Jusko.
Conducted experiments: Chen, DuBois.
Performed data analysis: Chen, Jusko.
Wrote or contributed to the writing of the manuscript: Chen, DuBois, Almon, Jusko.
Footnotes
This work was supported by the National Institutes of Health National Institute of General Medical Sciences [Grant GM24211] and by the UB Center for Protein Therapeutics.
References
- Adams KE, Ke S, Kwon S, Liang F, Fan Z, Lu Y, Hirschi K, Mawad ME, Barry MA, Sevick-Muraca EM. (2007) Comparison of visible and near-infrared wavelength-excitable fluorescent dyes for molecular imaging of cancer. J Biomed Opt 12:024017. [DOI] [PubMed] [Google Scholar]
- Baxter LT, Zhu H, Mackensen DG, Jain RK. (1994) Physiologically based pharmacokinetic model for specific and nonspecific monoclonal antibodies and fragments in normal tissues and human tumor xenografts in nude mice. Cancer Res 54:1517–1528. [PubMed] [Google Scholar]
- Bell DR, Mullins RJ, Powers MR. (1983) Extravascular distribution of albumin and IgG during high-permeability edema in skin. Am J Physiol 244:H599–H606. [DOI] [PubMed] [Google Scholar]
- Bernard E, Bensoussan M, Bensoussan F, Etienne S, Cazenave I, Carsenti-Etesse E, Le Roux Y, Montay G, Dellamonica P. (1994) Pharmacokinetics and suction blister fluid penetration of a semisynthetic injectable streptogramin RP 59500 (RP 57669/ RP 54476). Eur J Clin Microbiol Infect Dis 13:768–771. [DOI] [PubMed] [Google Scholar]
- Bernareggi A, Rowland M. (1991) Physiologic modeling of cyclosporin kinetics in rat and man. J Pharmacokinet Biopharm 19:21–50. [DOI] [PubMed] [Google Scholar]
- Brennan FM, Maini RN, Feldmann M. (1992) TNF alpha—a pivotal role in rheumatoid arthritis? Br J Rheumatol 31:293–298. [DOI] [PubMed] [Google Scholar]
- Cao Y, Balthasar JP, Jusko WJ. (2013) Second-generation minimal physiologically-based pharmacokinetic model for monoclonal antibodies. J Pharmacokinet Pharmacodyn 40:597–607. [DOI] [PMC free article] [PubMed] [Google Scholar]
- Chosidow O, Dubruc C, Danjou P, Fuseau E, Espagne E, Bianchetti G, Thenot JP, Herson S, Rosenzweig P, Revuz J. (1996) Plasma and skin suction-blister-fluid pharmacokinetics and time course of the effects of oral mizolastine. Eur J Clin Pharmacol 50:327–333. [DOI] [PubMed] [Google Scholar]
- Choy EH, Panayi GS. (2001) Cytokine pathways and joint inflammation in rheumatoid arthritis. N Engl J Med 344:907–916. [DOI] [PubMed] [Google Scholar]
- Cohen R, Stammes MA, de Roos IH, Stigter-van Walsum M, Visser GW, van Dongen GA. (2011) Inert coupling of IRDye800CW to monoclonal antibodies for clinical optical imaging of tumor targets. EJNMMI Res 1:31. [DOI] [PMC free article] [PubMed] [Google Scholar]
- Conner KP, Rock BM, Kwon GK, Balthasar JP, Abuqayyas L, Wienkers LC, Rock DA. (2014) Evaluation of near infrared fluorescent labeling of monoclonal antibodies as a tool for tissue distribution. Drug Metab Dispos 42:1906–1913. [DOI] [PMC free article] [PubMed] [Google Scholar]
- Culy CR, Keating GM. (2002) Etanercept: an updated review of its use in rheumatoid arthritis, psoriatic arthritis and juvenile rheumatoid arthritis. Drugs 62:2493–2537. [DOI] [PubMed] [Google Scholar]
- D’Argenio D, Schumitzky A, Wang X. (2009) Adapt 5 User’s Guide: Pharmacokinetic/Pharmacodynamic Systems Analysis Software. Biomedical Simulations Resource (BMSR), University of Southern California, Los Angeles: https://bmsr.usc.edu/files/2013/02/ADAPT5-User-Guide.pdf. [Google Scholar]
- Earp JC, DuBois DC, Molano DS, Pyszczynski NA, Keller CE, Almon RR, Jusko WJ. (2008) Modeling corticosteroid effects in a rat model of rheumatoid arthritis I: mechanistic disease progression model for the time course of collagen-induced arthritis in Lewis rats. J Pharmacol Exp Ther 326:532–545. [DOI] [PMC free article] [PubMed] [Google Scholar]
- Edrees AF, Misra SN, Abdou NI. (2005) Anti-tumor necrosis factor (TNF) therapy in rheumatoid arthritis: correlation of TNF-alpha serum level with clinical response and benefit from changing dose or frequency of infliximab infusions. Clin Exp Rheumatol 23:469–474. [PubMed] [Google Scholar]
- Garg A. (2007) Investigation of the Role of Fcrn in the Absorption, Distribution, and Elimination of Monoclonal Antibodies, p 334, State University of New York at Buffalo, Ann Arbor. [Google Scholar]
- Herfst MJ, van Rees H. (1978) Suction blister fluid as a model for interstitial fluid in rats. Arch Dermatol Res 263:325–334. [DOI] [PubMed] [Google Scholar]
- Holder DJ. (2001) Comments on Nedelman and Jia’s extension of Satterthwaite’s approximation applied to pharmacokinetics. J Biopharm Stat 11:75–79. [DOI] [PubMed] [Google Scholar]
- Hopkins SJ, Meager A. (1988) Cytokines in synovial fluid: II. The presence of tumour necrosis factor and interferon. Clin Exp Immunol 73:88–92. [PMC free article] [PubMed] [Google Scholar]
- Kiistala U. (1968) Suction blister device for separation of viable epidermis from dermis. J Invest Dermatol 50:129–137. [DOI] [PubMed] [Google Scholar]
- Korth-Bradley JM, Rubin AS, Hanna RK, Simcoe DK, Lebsack ME. (2000) The pharmacokinetics of etanercept in healthy volunteers. Ann Pharmacother 34:161–164. [DOI] [PubMed] [Google Scholar]
- Lon HK, Liu D, Zhang Q, DuBois DC, Almon RR, Jusko WJ. (2011) Pharmacokinetic-pharmacodynamic disease progression model for effect of etanercept in Lewis rats with collagen-induced arthritis. Pharm Res 28:1622–1630. [DOI] [PMC free article] [PubMed] [Google Scholar]
- National Research Council (NRC) (1996) Guide for the Care and Use of Laboratory Animals. 7th ed. National Academies Press, Washington, DC. [Google Scholar]
- Mazzei T, Novelli A, Esposito S, Periti P. (2000) New insight into the clinical pharmacokinetics of cefaclor: tissue penetration. J Chemother 12:53–62. [DOI] [PubMed] [Google Scholar]
- Nedelman JR, Jia X. (1998) An extension of Satterthwaite’s approximation applied to pharmacokinetics. J Biopharm Stat 8:317–328. [DOI] [PubMed] [Google Scholar]
- Scott LJ. (2014) Etanercept: a review of its use in autoimmune inflammatory diseases. Drugs 74:1379–1410. [DOI] [PubMed] [Google Scholar]
- Shah DK, Betts AM. (2012) Towards a platform PBPK model to characterize the plasma and tissue disposition of monoclonal antibodies in preclinical species and human. J Pharmacokinet Pharmacodyn 39:67–86. [DOI] [PubMed] [Google Scholar]
- Shah DK, Betts AM. (2013) Antibody biodistribution coefficients: inferring tissue concentrations of monoclonal antibodies based on the plasma concentrations in several preclinical species and human. MAbs 5:297–305. [DOI] [PMC free article] [PubMed] [Google Scholar]
- Tabrizi M, Bornstein GG, Suria H. (2010) Biodistribution mechanisms of therapeutic monoclonal antibodies in health and disease. AAPS J 12:33–43. [DOI] [PMC free article] [PubMed] [Google Scholar]
- Wiederhielm CA. (1979) Dynamics of capillary fluid exchange: a nonlinear computer simulation. Microvasc Res 18:48–82. [DOI] [PubMed] [Google Scholar]
- Wu F, Tamhane M, Morris ME. (2012) Pharmacokinetics, lymph node uptake, and mechanistic PK model of near-infrared dye-labeled bevacizumab after IV and SC administration in mice. AAPS J 14:252–261. [DOI] [PMC free article] [PubMed] [Google Scholar]
- Zhou H. (2005) Clinical pharmacokinetics of etanercept: a fully humanized soluble recombinant tumor necrosis factor receptor fusion protein. J Clin Pharmacol 45:490–497. [DOI] [PubMed] [Google Scholar]
- Zhou SY, Shu C, Korth-Bradley J, Raible D, Palmisano M, Wadjula J, Fatenejad S, Bjornsson T. (2011) Integrated population pharmacokinetics of etanercept in healthy subjects and in patients with rheumatoid arthritis and ankylosing spondylitis. J Clin Pharmacol 51:864–875. [DOI] [PubMed] [Google Scholar]
- Zinn KR, Korb M, Samuel S, Warram JM, Dion D, Killingsworth C, Fan J, Schoeb T, Strong TV, Rosenthal EL. (2015) IND-directed safety and biodistribution study of intravenously injected cetuximab-IRDye800 in cynomolgus macaques. Mol Imaging Biol 17:49–57. [DOI] [PMC free article] [PubMed] [Google Scholar]


