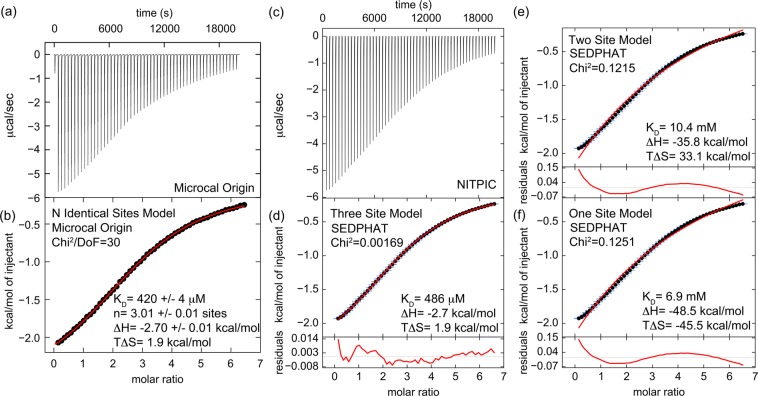
Figure 1.
ITC indicates that the clathrin N-terminal domain (TD) binds three clathrin-box AP2 peptides with low affinity. (a) Heat evolution as a function of adding increasing amounts of AP2 peptide to TD. The heats of dilution were measured separately and found to be <1% of the signal at the start of titration so were not considered further in the analysis. (b) Fitting the ITC data with Microcal-modified Origin 7 software to an N-identical site model indicates that each TD binds three AP2 peptides with a KD of 420 ± 4 μM. The fit (red) is overlaid on the data (black). Values shown on the figure are from the fit of the displayed data set. The average and standard deviations of three independent experiments gave the following values: KD = 474 ± 140 μM, N = 3.0 ± 0.2 sites, ΔH = −2.8 ± 0.2 kcal/mol, and TΔS = 1.8 ± 0.4 kcal/mol. (c) The same data set shown in panel a was processed with NITPIC to produce the displayed thermogram. (d) The thermogram shown in panel c was integrated with NITPIC to produce the displayed isotherm. The error bars (blue) come from examining the noise in the interinjection periods. The data were then fit in SEDPHAT to a three-site model. The fit (red) is overlaid on the data (black), with the residual displayed below each isotherm (red). (e) The isotherm shown in panel c was fit in SEDPHAT to a two-site model. (f) The isotherm shown in panel d was fit to a one-site model. Notice the poor quality of the fits to the one- and two-site models, compared to the fit to the three-site models.

