

Abstract
Schizophrenia (SZ) is a severe neuropsychiatric disorder. A leading hypothesis is that SZ is a brain dysconnection syndrome, involving abnormal interactions between wide-spread brain networks. Resting state functional magnetic resonance imaging (R-fMRI) is a powerful tool to explore the dysconnectivity of brain networks in SZ and other disorders. Seed-based functional connectivity analysis, spatial independent component analysis (ICA), and graph theory-based analysis are popular methods to quantify brain network connectivity in R-fMRI data. Wide-spread network dysconnectivity in SZ has been observed using both seed-based analysis and ICA, although most seed-based studies report decreased connectivity while ICA studies report both increases and decreases. Importantly, most of the findings from both techniques are also associated with typical symptoms of the illness. Disrupted topological properties and altered modular community structure of brain system in SZ have been shown using graph theory-based analysis. On the whole, the resting-state findings regarding brain networks deficits have advanced our understanding of the underlying pathology of SZ. In this article, we review aberrant brain connectivity networks in SZ measured in R-fMRI by the above approaches, and discuss future challenges.
Keywords: Schizophrenia, Resting state-fMRI, Dysconnectivity, Brain network, Seed-based, ICA, Graph
1. Introduction
Schizophrenia (SZ) is a severe mental illness characterized by symptoms including delusions, hallucinations, apathy, social withdrawal, and deficits in cognitive functions such as attention and working memory [1]. This disorder affects about 1% of the population worldwide [2, 3]. Although SZ is one of the most complex mental disorders, decades of research which report altered brain structure and function have provided us with some understanding of the neurobiological mechanisms underlying its symptoms [4-7]. For example, structural brain studies which involved subjects with high risk for psychosis or first-episode psychosis suggest neuroanatomical alterations may underlie the clinical onset of psychotic symptoms [8-13]. In addition, a large number of findings from functional brain imaging studies support a leading hypothesis that SZ stems from dysconnectivity, that is, abnormal interactions between wide-spread brain networks [14-18]. Recently, resting state functional magnetic resonance imaging (R-fMRI) has become a powerful tool to examine the aberrant connectivity of brain networks in SZ, helping to understand the underlying pathology of this brain disorder.
During resting state experiments, participants are instructed to relax, stay awake and not to think of anything in particular while their patterns of spontaneous brain activation are measured [19]. Functional connectivity, which can be defined as the coordination of activity across brain regions [20-22], is often estimated as the temporal correlations of low frequency (0.01-0.10 HZ) oscillations in the blood oxygen level dependent (BOLD) signal between anatomically distinct brain areas [19]. In the resting state, brain regions are functionally connected with somewhat prototypical patterns, revealing the intrinsic organization of so-called resting state networks (RSNs). Researches demonstrate that RSNs are largely present in both rest and task, though they do change during tasks [23, 24] and between eyes open and closed conditions [25, 26]. Using R-fMRI, the motor network [27], default mode network [28, 29], and several other RSNs are readily identified [30-32].
There are a number of advantages of studying the functional organization of brain networks during the resting state, as opposed to during a task [33]. First, spontaneous activity accounts for the large majority of the brain's activity [34], whereas task-related increases in neuronal metabolism are usually small (<5%) [35]. It is important to assess the spontaneous activity of brain during resting state to fully understand brain function [36]. Secondly, in practice, it is difficult to attain equivalent level of performance in a task for healthy controls and patients whereas R-fMRI is largely free from this potentially confounding effect [33, 37]. In addition, R-fMRI experiments are less prone to multi-site variability stemming from differences in experimental design or implementation, allowing for a wider range of patients to be included and considered in analyses [38]. Finally, R-fMRI leads to less movement than task fMRI studies requiring subjects to respond with motor activity [32].
R-fMRI data have typically been investigated using seed-based functional connectivity analysis or spatial independent component analysis (ICA). In addition, graph theory-based complex network analysis methods have been applied to further characterize the underling networks in both seed-based/ROI-based and ICA (or network-based) analyses. In this paper, we review recent advances in the study of brain dysconnectivity in SZ discovered by these approaches in R-fMRI data and also discuss potential future challenges. The following sections of this article are organized into: dysconnectivity of SZ indentified by seed-based analysis; dysconnectivity of SZ indentified by ICA; dysconnectivity of SZ indentified by graph theory-based analysis; and summary and challenges of future works.
2. Dysconnectivity of SZ indentified by seed-based analysis
In seed-based or region-of-interest (ROI)-based approaches to functional connectivity [32], BOLD time series are first extracted from an ROI (or seed). Then the temporal correlation between this extracted signal and the time series from all other brain voxels is determined after some preprocessing (e.g. band-pass filtering, autocorrelation correction, covarying for white matter variance or other confounding variables). For a schematic pipeline of this approach see Figure 1. Although this method has some disadvantages, such as dependence on a priori defined seed region, a limited ability to study multiple systems simultaneously and the extracted waveform may not be a true independent variable when assessing statistical significance [36], this approach is widely used owing to its inherent simplicity, sensitivity and ease of interpretation [20, 32, 36, 37]. It also gives results largely consistent with ICA measures [39].
Figure 1.
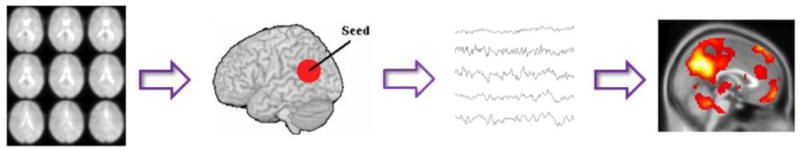
Pipeline for seed-based functional connectivity analysis in R-fMRI studies. The first step is to select a brain region of interest as a seed. Next, time courses are extracted from the seed and all other brain voxels. After preprocessing (e.g. band-pass filtering, autocorrelation correction, covarying for white matter variance or other confounding variables), a functional connectivity brain map showing the temporal correlation between the given seed and all other brain voxels is produced.
Seed-based comparisons in functional connectivity have revealed widespread dysconnectivity in SZ when using a number of different ROIs as seeds. In most studies, patients with SZ show decreased connectivity. For example, when using the anterior hippocampus as a seed, functional connectivity between the bilateral hippocampi and some brain regions including postierior cingulate cortex, extrastriate cortex, medial prefrontal cortex, and parahippocampus gyrus is reduced in patients with paranoid SZ [40]. In Bluhm et al. [41], lower correlations in SZ between the retrosplenial cortex and both the temporal lobe and regions of the default network are observed. Bluhm et al. [42] find that Schizophrenic patients have significantly less correlation between posterior cingulate and lateral parietal, medial prefrontal, and cerebellar regions. When comparing the correlation of each pair of 116 ROIs of the whole brain, decreased connectivity is widely distributed throughout the entire brain in SZ [43]. In Zhou et al. [44], bilateral dorsolateral prefrontral cortex show reduced functional connectivity to the parietal lobe, posterior cingulated cortex, thalamus and striatum, whereas functional connectivity between the left dorsolateral prefrontal cortex and the left mid-posterior temporal lobe and the paralimbic regions is enhanced in patients with first-episode SZ. Most interestingly, some findings of dysconnectivity are associated with symptoms. For example, SZ patients with a history of auditory hallucinations have significantly reduced interhemispheric connectivity in primary and secondary auditory cortices when compared with SZ patients without auditory hallucinations and healthy controls [45]. When using a bilateral amygdala seed, Hoptman et al. [46] reveal reductions in connectivity between amygdala and ventral prefrontal cortex regions in patients with SZ or schizoaffective disorder. Furthermore, the lower connectivity in patients is associated with higher levels of self-rated aggression. When using bilateral temporo-parietal junction as seed regions, Vercammen et al. [47] reveal reduced connectivity between left temporo-parietal junction and the right homotope of Broca in SZ patients with auditory-verbal hallucinations. More severe auditory-verbal hallucinations are associated with reduced correlation between left temporo-parietal junction and bilateral anterior cingulate as well as the bilateral amygdale.
In terms of connectivity in RSNs, Whitfield-Gabrieli et al. [48] find abnormal high functional connectivity within the default mode network in SZ, consistent with Garrity et al. [49]. Woodward et al. [50] investigate the functional connectivity in several RSNs including default mode, dorsal attention, executive control, and salience networks using seed-based method. A number of differences between patients with SZ and controls are revealed in default mode, dorsal attention, and executive control networks. Specifically, patients demonstrate greater connectivity between the posterior cingulated cortex and the left inferior gyrus, left middle frontal gyrus, and left middle temporal gyrus. These regions are more strongly connected to the executive control network in healthy controls. And less connectivity in the executive control and dorsal attention networks in SZ are discovered by calculating the correlation among clusters within each network. The findings suggest the process of functional specialization is altered in SZ. In another study, after identification of ROIs in “task-positive” network which is identified by using the right dorsolateral prefrontal cortex as seed and ROIs in “task-negative” network which is identified by using posterior cingulated cortex/precuneus as seed, connectivity between each pair of these brain regions is evaluated. Results reveal abnormal connectivity with the bilateral dorsal medial prefrontal cortex, the lateral parietal region, the inferior temporal gyrus, the right dorsolateral prefrontal cortex, and the right dorsal premotor cortex in patients with paranoid SZ [51].
3. Dysconnectivity of SZ indentified by ICA
Spatial ICA is a technique to decompose the spatio-temporal BOLD signal into spatial brain components and their associated time courses [52-55]. Each component provides a grouping of brain activity into regions that share the same response pattern thus providing a natural measure of functional connectivity [56]. Although the results are dependent on the number of components and the user must determine which components reflect noise and which components resemble neuro-anatomical systems [36], it is a data driven approach which does not require a priori definition of seed regions to analyze the functional connectivity networks in human brain. Spatial ICA has became a popular technique to identify temporally coherent networks and detect biomarkers in SZ by processing R-fMRI data [23].
In line with studies using seed-based analysis, multiple dysconnected brain networks in SZ have been observed using ICA approaches. In Ongur et al. [57], SZ subjects show greater recruitment (spatial extent) of the frontopolar cortex/basal ganglia and decreased recruitment in the dorsal anterior cingulate cortex, as well as reduced DMN connectivity in the medial prefrontal cortex. A number of findings have also been associated with symptoms. For example, Camchong et al. [58] find lower functional connectivity in medial frontal gyrus and anterior cingulate gyrus in patients with chronic SZ. Frontal connectivity in patients is positively associated with symptoms as well as with general cognitive ability measures. Wolf et al. [59] evaluate the functional connectivity of some RSNs in patients with SZ who have auditory verbal hallucinations (AVHs). Within a speech-related network, patients show increased connectivity in bilateral temporal regions and decreased connectivity in the cingulate cortex. Within two additional RSNs associated with attention and executive control, respectively, patients exhibit less connectivity in the left precuneus and increased connectivity in the right lateral prefrontal areas. They also find correlations between measures of AVH severity and functional connectivity of the left anterior cingulate, left superior temporal gyrus and right lateral prefrontal cortex. Sorg et al. [60] investigate the intrinsic activity of striatum underlining different disorder states using ICA. During psychosis, coherent intrinsic activity of the striatum is increased in the dorsal part and correlated with positive symptoms. In psychotic remission of the same patients, activity of the ventral striatum is increased and correlated with negative symptoms. Rotarska-Jagiela et al. [61] report that, SZ patients show decreased connectivity in posterior cingulate and hippocampus, which correlated with severity of hallucinations and delusions, and decreased hemispheric separation of fronto-parietal activity, which correlated with disorganization symptoms.
Other interesting findings based on ICA include altered functional network connectivity (FNC) in SZ. FNC is the functional connectivity of ICA components by evaluating the temporal relationships among ICA time courses across different components, rather than within components [62]. Jafri et al. [63] is the first study to evaluate the differences in FNC of resting state brain components in SZ patients versus healthy controls. They find higher correlation among most of the dominant resting state networks in SZ (Figure 2). Subsequent studies report both increased and decreased FNC in SZ. For example, Lui et al. [64] report increased connectivity within the frontoparietal-temporal network and decreased connectivity within the temporal-ventromedial frontal network, DMN, and medial frontal areas in drug naive first episode SZ patients. Meda et al. [65] find lower connectivity between Fronto/Occipital network and Anterior Default Mode/Prefrontal network, also between Meso/Paralimbic network and Sensory/Motor network in SZ patients.
Figure 2.
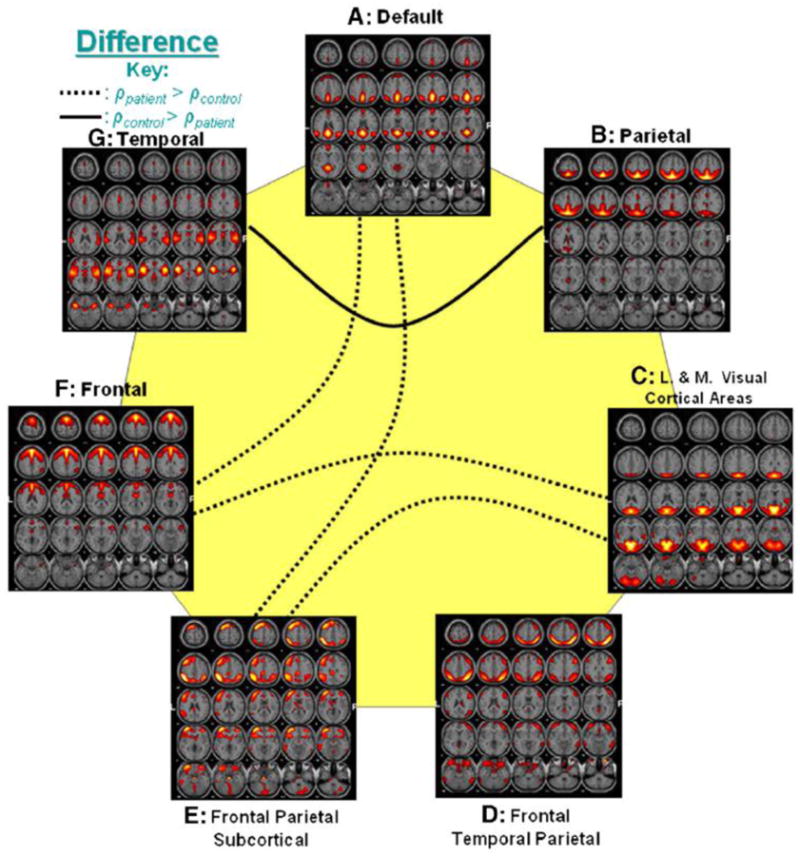
Group differences of FNC (from Jafri et al. [63]). Out of 21 possible correlation combinations between 7 components, only 5 combinations passed the two sample t-test (p < 0.01). The solid line represents the significant connectivity where controls have higher mean correlation than patients, while dotted line represents connectivity where patients have higher mean correlation. Presence of dotted lines rejects the hypothesis that controls should have more correlation between two components than patients.
4. Dysconnectivity of SZ indentified by graph theory-based analysis
Graph theory-based network analysis is another widely-used method to describe R-fMRI data in order to study mind-brain mechanisms [66]. Topological properties of brain networks described by nodes and edges can be investigated by graph theory-based analysis. In practice, graph measures such as clustering coefficient, degree, betweenness, path length, local efficiency, global efficiency and modularity (for the definition of these metrics see Rubinov and Sporns [67]) are often used to characterize system properties [68]. See Figure 3 for a flow chart of the graph theory-based analysis implementing in R-fMRI studies. Applications of this approach demonstrated that the intrinsic activity of human brain tends to be organized as small-world, with significant modularity and highly connected hub regions which indicate high efficiency of brain systems [69, 70]. Recent studies implemented the graph-based analysis in brain disorders found altered network metrics in patients with SZ during resting state [71].
Figure 3.
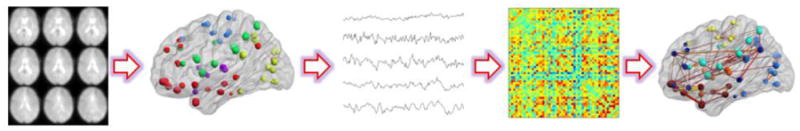
A schematic flow chart for implementing graph theory-based analysis into R-fMRI data. The first step is defining nodes based on ROIs of brain atlas, voxels or brain components. Secondly, the time courses of all nodes are extracted followed by preprocessing (e.g. band-pass filtering, autocorrelation correction, covarying for white matter variance or other confounding variables). Subsequently, a correlation matrix represents the temporal correlation between any pair nodes is computed. Next, a brain graph with nodes and edges could be built based on the correlation matrix. Then, some properties of the graph such as clustering, efficiencies, path length could be evaluated. (The brain maps with nodes/edges were from the manual of the BrainNet Viewer http://www.nitrc.org/projects/bnv/).
Most of the topological metrics of small-world brain networks have been found to be altered in SZ. For example, when using atlas-based ROIs as brain network nodes, Lui et al. [72] observe lower degree, lower connectivity strength, decreased clustering coefficient and longer characteristic path length in patients with SZ. The properties of particular brain regions in the prefrontal, parietal and temporal lobes are also altered. Lynall et al. [73] consistently find decreased connectivity strength, reduced clustering and small-worldness. In addition, reduced degree and clustering are locally significant in medial parietal, premotor and cingulated, and right orbitofrontal areas. Alexander-Bloch et al. [74] also reveal reduced connectivity strength, decreased clustering and local efficiency, but increased global efficiency and robustness in patients with childhood-onset SZ. Cortical regions with abnormally reduced local connectivity include the left and right superior temporal gyrus, left ventral occipital cortex, right cingulate, right insula, and right frontal operculum; subcortical decreases of clustering bilaterally in the thalamus, caudate, and accumbens; increased efficiency in the right inferior parietal lobule, left ventral temporal cortex, bilateral frontal operculum, and right planum polare. When using brain components as network nodes, Yu et al. [75] discover higher clustering coefficient, higher local efficiency, higher characteristic path length, and lower global efficiency. The topological measures were locally altered in brain components involving frontal, parietal, occipital and cerebellar areas in SZ. Importantly, characteristic path length and global efficiency were correlated with negative scale of PANSS in patients.
Multi-level analysis can also be performed by combining graph theory-based analysis and other techniques. For example, Bassett et al. [76] quantitatively characterize the univariate wavelet entropy of regional activity, the bivariate pairwise functional connectivity between regions, and the multivariate network organization of connectivity patterns. The results indicated that univariate measures are less sensitive to disease state than higher level bivariate and multivariate measures. In addition, by considering the network structure as a function of correlation strength, network organization specifically of weak connections is strongly correlated with attention, memory, and negative symptom scores of patients with SZ and displays potential as a clinical biomarker. This study provides a new framework in which to explore the neuro-mechanism of SZ.
Modular community structure is repeatedly demonstrated in resting state functional brain connectivity networks [77-79]. Modular organization of brain networks may play a critical role in its evolution and neurodevelopment [80-82]. Since it has been hypothesized that brain disorders such as SZ are associated with developmental factors [83], the examination of modular organization in SZ may provide biomarkers of altered brain development in this psychosis [74]. Indeed, reduced modularity which implies proportionally less intra-modular edges and more inter-modular edges in patients with childhood-onset SZ is detected [74]. When using brain components as network nodes to build weighted networks, Yu et al. [84] find more and smaller modules with different hubs in SZ (see Figure 4). Alexander-Bloch et al. [85] also report altered modular community structure in patients with childhood-onset SZ. The difference in the modular partition is most striking for a module that consistently includes brain regions around the right anterior insula in healthy controls. In contrast, these regions are distributed over a number of other modules in patient group.
Figure 4.
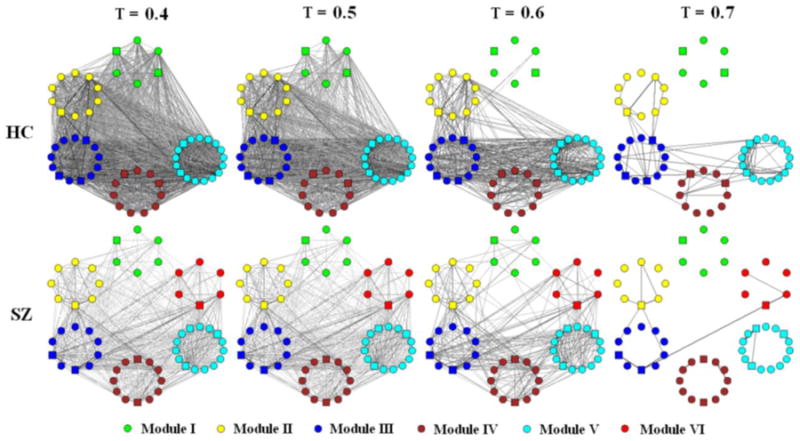
Schematic modular architecture of FNC for healthy controls (HC) and patients with SZ (from Yu et al. [84]). Nodes in a given module are placed in a small circle. To show how edges disappear with threshold (T) change, graphs (each consisted of 57 brain components) built by T at 0.4, 0.5, 0.6, and 0.7 are shown respectively. An edge (either- or intra-module edge) is shown in the graph if its weight bigger than T. the thicker and the darker an edge, the higher its weight. Hubs are indicated by square nodes.
5. Summary and challenges of future works
In summary, widespread dysconnectivity across the whole brain in SZ is identified by both seed-based analysis and ICA studies. The majority of seed-based studies show decreased connectivity, while ICA studies report both increased and decreased connectivity in SZ (in different networks). Medial frontal cortex is often identified to be involved in aberrant connectivity in SZ by both approaches (see Table 1 and Table 2). Findings revealed by graph theory-based analysis which can examine the properties (such as efficiency and modular organization) of the whole system are good supplements to seed-based and ICA studies. For a summary of the findings by graph theory-based analysis see Table 3. All of the studies support a dysconnectivity hypothesis of SZ. Some studies also show relationships between dysconnectivity and typical symptoms of the disorder. The findings are improving our understanding of the underlying deficits of brain networks in SZ. However, there are some limitations. For example, in most studies, medication effects are not distinguished from those related purely to the disease; because there are very few studies of unmedicated subjects. One approach to clarifying this is to examine unaffected first-degree relatives of schizophrenia patients see if abnormal connectivity is inherited as a marker of illness predisposition (i.e. an endophenotype) as opposed to a biological illness marker (e.g. Meda et al. [65]).
Table 1. Summary of the methods and main findings in R-fMRI studies of brain connectivity network in schizophrenia by seed-based analysis.
| Study | Sample | Seed(s)/ROIs | Main findings |
|---|---|---|---|
| Zhou et al. [44] | 17 patients with first-episode SZ 17 matched controls |
Bilateral Brodmann's area 46 (DLPFC) | Bilateral DLPFC show reduced functional connectivity to the parietal lobe, posterior cingulate cortex, thalamus and striatum in patients. Functional connectivity between the left DLPFC and the left mid-posterior temporal lobe and the paralimbic regions is enhanced in patients. |
| Zhou et al. [51] | 18 patients with paranoid SZ 18 healthy controls |
The right DLPFC as seed to identify ROIs in “Task-positive” network; PCC/precuneus as seed to identify ROIs in “Task-negative” network; Connectivity between each pair of these ROIs is evaluated. |
Abnormal connectivity associated with the bilateral dorsal medial prefrontal cortex, the lateral parietal regions, the inferior temporal gyrus, the right dorsolateral prefrontal cortex, and the right dorsal premotor cortex in patients. |
| Bluhm et al. [42] | 17 schizophrenic patients 17 healthy controls |
PCC | Less correlation between posterior cingulate and lateral parietal, medial prefrontal, and cerebellar regions. |
| Zhou et al. [40] | 17 patients with paranoid SZ 14 healthy controls |
Anterior hippocampus | Functional connectivity between the bilateral hippocampi and some brain regions including postierior cingulate cortex, extrastriate cortex, medial prefrontal cortex, and parahippocampus gyrus is reduced in patients. |
| Bluhm et al. [41] | 17 patients with SZ (15 paranoid SZ, 2 undifferentiated SZ) 17 healthy controls |
Retrosplenial cortex | Lower correlations between the retrosplenial cortex and the right precuneus, right medial frontal gyrus, bilateral superior temporal gyrus, and cerebellum in patients. |
| Whitfield-Gabrieli et al. [48] | 13 SZ patients 13 healthy controls |
Medial prefrontal cortex PCC/precuneus Bilateral parietal cortices |
Greater connectivity between the default network and medial prefrontal cortex; greater connectivity between the default network and posterior cingulate cortex in patients. |
| Hoptman et al. [46] | 21 SZ (1 disorganized SZ; 7 paranoid SZ; 3 residual SZ; 10 undifferentiated SZ) 4 schizoaffective disorder 21 healthy controls |
Amygdala | Significant reductions in functional connectivity between amygdala and ventral prefrontal cortex regions in patients. |
| Vercammen et al. [47] | 27 SZ patients with auditory-verbal hallucinations 27 matched healthy controls |
Left temporo-parietal junction and right temporo-parietal junction | Reduced connectivity between left temporo-parietal junction and the Right homotope of Broca in patients. |
| Gavrilescu et al. [45] | 13 SZ patients with a current history of auditory hallucinations 13 SZ patients with no history of auditory hallucinations 16 healthy controls |
Bilateral primary and secondary auditory cortices | SZ patients with auditory hallucinations have significantly reduced interhemispheric connectivity in both primary and secondary auditory cortices when compared with SZ patients with no auditory hallucinations and healthy controls. |
| Woodward et al. [50] | 28 patients with schizophrenia 14 schizoaffective disorder 61 healthy controls |
Using PCC, left and right IPS/SPL, left and right DLPFC, left and right fronto-insular cortx to identify the default mode, dorsal attention, executive control, and salience networks separately. | A number of differences between patients and controls are revealed in default mode, dorsal attention, and executive control networks. |
| Liang et al. [43] | 15 patients with SZ 15 healthy controls |
116 brain regions of AAL | Decreased connectivity in SZ is widely distributed throughout the entire brain. |
| He et al. [16] |
115 first-episode, treatment-naïve patients with SZ 113 healthy controls |
PCC | Increased anticorrelated functional connectivity in the left insula and bilateral DLPFC. |
DLPFC: dorsolateral prefrontal cortex; PCC: posterior cingulate cortex; IPS: intraparietal sulcus; SPL: superior parietal lobule; AAL: automated anatomical labeling [89].
Table 2. Summary of the R-fMRI studies about brain connectivity in schizophrenia by ICA.
| Study | Sample | Main findings |
|---|---|---|
| Jafri et al. [63] | 29 patients with SZ 25 healthy controls |
Higher correlation among most of the dominant resting state networks in SZ. |
| Lui et al. [64] | 34 drug-naïve patients with first-episode SZ 34 healthy controls |
Increased connectivity within the frontoparietal-temporal network and decreased connectivity within the temporal-ventromedial frontal network, DMN, and medial frontal areas in drug naive first episode SZ patients. |
| Ongur et al. [57] | 14 SZ patients 15 healthy controls |
SZ subjects show greater recruitment (spatial extent) of the frontopolar cortex/basal ganglia and decreased recruitment (spatial extent) in the dorsal anterior cingulate cortex, as well as reduced DMN connectivity in the medial prefrontal cortex. |
| Rotarska-Jagiela et al. [61] | 16 patients with paranoid SZ 16 healthy controls |
SZ patients show decreased connectivity in posterior cingulated and hippocampus, and decreased hemispheric separation of fronto-parietal activity. |
| Camchong et al. [58] | 29 chronic SZ patients 29 healthy controls |
Lower functional connectivity in medial frontal gyrus and anterior cingulate gyrus in patients. |
| Wolf et al. [59] | 10 patients with SZ who have auditory verbal hallucinations 14 healthy controls |
Increased connectivity in bilateral temporal regions, decreased connectivity in the cingulate cortex, and less connectivity in the left precuneus and increased connectivity in the right lateral prefrontal areas in patients. |
| Sorg et al. [60] | 21 patients with SZ 21 healthy controls |
During psychosis, coherent intrinsic activity of the striatum is increased in the dorsal part. In psychotic remission of the same patients, activity of the ventral striatum is increased. |
| Meda et al. [65] | 70 SZ patients 118 normal controls |
Lower connectivity between Fronto/Occipital network and Anterior Default Mode/Prefrontal network, also between Meso/Paralimbic network and Sensory/Motor network in SZ patients. |
Table 3. Summary of the methods and main findings in R-fMRI studies investigating dysconnectivity in schizophrenia by graph theory-based method.
AAL: automated anatomical labeling.
| Study | Sample | Nodal definition | Nodal number | Edge definition | Main findings |
|---|---|---|---|---|---|
| Liu et al. [72] | 31 patients with SZ 31 healthy controls |
AAL | 90 | Partial correlation | Lower degree, lower connectivity strength, decreased clustering coefficient and longer characteristic path length in patients with SZ. |
| Lynall et al. [73] | 12 patients with chronic SZ 15 healthy controls |
AAL | 72 | Wavelet correlation | Decreased connectivity strength, reduced clustering and small-worldness. |
| Alexander-Bloch et al. [74] | 13 patients with childhood-onset SZ 19 healthy controls |
Harvard-Oxford Probabilistic Atlas [90] | 100 | Wavelet correlation | Reduced connectivity strength, decreased clustering and local efficiency, but increased global efficiency and robustness in patients with childhood-onset SZ. |
| Yu et al. [75] | 19 patients with SZ 19 healthy controls |
Brain components | 57 | Partial correlation | Higher clustering coefficient, higher local efficiency, higher characteristic path length, and lower global efficiency. |
| Yu et al. [84] | 24 patients with SZ 24 healthy controls |
Brain components | 57 | Pearson correlation | More and smaller modules with different hubs in SZ. |
| Bassett et al. [76] | 29 patients with chronic SZ 29 healthy controls |
AAL | 90 | Pearson correlation | Univariate measures are less sensitive to disease state than higher level bivariate and multivariate measures. |
| Alexander-Bloch et al. [85] | 23 patients with childhood-onset SZ 23 healthy controls |
Gray matter of Harvard-Oxford Probabilistic Atlas | 278 | Wavelet correlation | Altered modular community structure in patients with childhood-onset SZ. The difference in the modular partition is most striking for a module that consistently includes brain regions around the right anterior insula in healthy controls. In contrast, these regions are distributed over a number of other modules in patient group. |
Specificity is another unresolved problem, i.e. whether abnormal connectivity detected in schizophrenia patients is unique to that disorder or shared with other psychotic illnesses such as psychotic bipolar disorder. Again, relatively few studies have attempted to clarify this distinction (see Meda et al. [65]).
Regarding the direction of alteration in connectivity, both decreased and increased connectivity in SZ have been reported, although most seed-based studies reveal reduced connectivity in SZ. Bi-directed topological metrics are also revealed by graph theory-based analysis. The explanation of these inconsistencies in direction is not clear, though methodological differences among studies (such as seeds definition in seed-based analysis, number of components in FNC analysis, nodes definition in graph theory-based analysis) may play a role.
In addition, all studies focused on dysconnectivity in SZ at a group level, and it is difficult to identify dysconnectivity at single subject level to be used in clinic. However, classification may be a potential approach to do discrimination on a case-by-case basis, because classification provides information for each individual subject [86]. Although it is not easy to design an accurate, robust classifier for classifying SZ patients based on small number of training samples and high dimensional data, a few studies have tried to design objective prognostic/diagnostic tools using R-fMRI data. For example, based on functional connectivity between pairs of 116 ROIs, Shen et al. [87] classify SZ patients from controls with a high accuracy (94% for patients and 75% for healthy controls). Arbabshirani et al. [88] also classify patients from healthy controls with high accuracy using FNC. These results suggest machine learning applied to resting fMRI may be a useful tool for improving the current diagnosis of SZ.
There are also some specific challenges for each technique. In studies using seed-based analysis, different seeds (or ROIs) are selected in different studies (for a summary see Table 1). A criterion for determining seed(s) should be developed. In studies doing ICA-based FNC analysis, different numbers of brain components involving different areas were selected. How many brain components and involving which areas should be uniformed when doing FNC analysis. In graph theory-based analysis studies, nodes and edges are defined differently (see Table 3 for a summary). Nodes are usually defined by atlas-based ROIs or ICA components. Edges are usually defined by partial correlation or Pearson correlation. The best method of building brain graphs to explore brain networks is also not clear. The above challenges should be considered in future studies.
Acknowledgments
This work was supported by the National Institutes of Health (NIH) grants (R01EB000840 and 5P20RR021938 PI: Calhoun; R37MH43775 PI: Pearlson;).
References
- 1.Marin O. Interneuron dysfunction in psychiatric disorders. Nat Rev Neurosci. 2012;13(2):107–120. doi: 10.1038/nrn3155. [DOI] [PubMed] [Google Scholar]
- 2.Bhugra D. The global prevalence of schizophrenia. PLoS Med. 2005;2(5):e151. doi: 10.1371/journal.pmed.0020151. quiz e175. [DOI] [PMC free article] [PubMed] [Google Scholar]
- 3.Wyatt RJ, Henter I, Leary MC, Taylor E. An economic evaluation of schizophrenia--1991. Soc Psychiatry Psychiatr Epidemiol. 1995;30(5):196–205. doi: 10.1007/BF00789054. [DOI] [PMC free article] [PubMed] [Google Scholar]
- 4.van Os J, Kapur S. Schizophrenia. Lancet. 2009;374(9690):635–645. doi: 10.1016/S0140-6736(09)60995-8. [DOI] [PubMed] [Google Scholar]
- 5.Cabral J, Hugues E, Kringelbach ML, Deco G. Modeling the outcome of structural disconnection on resting-state functional connectivity. Neuroimage. 2012;62(3):1342–1353. doi: 10.1016/j.neuroimage.2012.06.007. [DOI] [PubMed] [Google Scholar]
- 6.Borgwardt SJ, Picchioni MM, Ettinger U, Toulopoulou T, Murray R, McGuire PK. Regional gray matter volume in monozygotic twins concordant and discordant for schizophrenia. Biol Psychiat. 2010;67(10):956–964. doi: 10.1016/j.biopsych.2009.10.026. [DOI] [PubMed] [Google Scholar]
- 7.Borgwardt S, McGuire P, Fusar-Poli P. Gray matters!--mapping the transition to psychosis. Schizophrenia research. 2011;133(1-3):63–67. doi: 10.1016/j.schres.2011.08.021. [DOI] [PubMed] [Google Scholar]
- 8.Fusar-Poli P, Radua J, McGuire P, Borgwardt S. Neuroanatomical Maps of Psychosis Onset: Voxel-wise Meta-Analysis of Antipsychotic-Naive VBM Studies. Schizophrenia Bull. 2011 doi: 10.1093/schbul/sbr134. 10.1093/schbul/sbr1134. [DOI] [PMC free article] [PubMed] [Google Scholar]
- 9.Fusar-Poli P, Smieskova R, Serafini G, Politi P, Borgwardt S. Neuroanatomical markers of genetic liability to psychosis and first episode psychosis: A voxelwise meta-analytical comparison. World J Biol Psychiatry. 2012 doi: 10.3109/15622975.2011.630408. 10.3109/15622975.15622011.15630408. [DOI] [PubMed] [Google Scholar]
- 10.Colombo RR, Schaufelberger MS, Santos LC, Duran FL, Menezes PR, Scazufca M, Busatto GF, Zanetti MV. Voxelwise evaluation of white matter volumes in first-episode psychosis. Psychiat Res. 2012;202(3):198–205. doi: 10.1016/j.pscychresns.2011.09.005. [DOI] [PubMed] [Google Scholar]
- 11.Olabi B, Ellison-Wright I, Bullmore E, Lawrie SM. Structural brain changes in first episode Schizophrenia compared with Fronto-Temporal Lobar Degeneration: a meta-analysis. BMC Psychiatry. 2012;12(1):104. doi: 10.1186/1471-244X-12-104. [DOI] [PMC free article] [PubMed] [Google Scholar]
- 12.Ruef A, Curtis L, Moy G, Bessero S, Badan Ba M, Lazeyras F, Lovblad KO, Haller S, Malafosse A, Giannakopoulos P, Merlo M. Magnetic resonance imaging correlates of first-episode psychosis in young adult male patients: combined analysis of grey and white matter. J Psychiatry Neurosci. 2012;37(4):110057. doi: 10.1503/jpn.110057. [DOI] [PMC free article] [PubMed] [Google Scholar]
- 13.Smieskova R, Fusar-Poli P, Aston J, Simon A, Bendfeldt K, Lenz C, Stieglitz RD, McGuire P, Riecher-Rossler A, Borgwardt SJ. Insular volume abnormalities associated with different transition probabilities to psychosis. Psychological medicine. 2012;42(8):1613–1625. doi: 10.1017/S0033291711002716. [DOI] [PMC free article] [PubMed] [Google Scholar]
- 14.Stephan KE, Baldeweg T, Friston KJ. Synaptic plasticity and dysconnection in schizophrenia. Biol Psychiatry. 2006;59(10):929–939. doi: 10.1016/j.biopsych.2005.10.005. [DOI] [PubMed] [Google Scholar]
- 15.Friston KJ, Frith CD. Schizophrenia: a disconnection syndrome? Clin Neurosci. 1995;3(2):89–97. [PubMed] [Google Scholar]
- 16.He Z, Deng W, Li M, Chen Z, Jiang L, Wang Q, Huang C, Collier DA, Gong Q, Ma X, Zhang N, Li T. Aberrant intrinsic brain activity and cognitive deficit in first-episode treatment-naive patients with schizophrenia. Psychological medicine. 2012:1–12. doi: 10.1017/S0033291712001638. [DOI] [PubMed] [Google Scholar]
- 17.Smieskova R, Allen P, Simon A, Aston J, Bendfeldt K, Drewe J, Gruber K, Gschwandtner U, Klarhoefer M, Lenz C, Scheffler K, Stieglitz RD, Radue EW, McGuire P, Riecher-Rossler A, Borgwardt SJ. Different duration of at-risk mental state associated with neurofunctional abnormalities. A multimodal imaging study. Human brain mapping. 2011 doi: 10.1002/hbm.21360. 10.1002/hbm.21360. [DOI] [PMC free article] [PubMed] [Google Scholar]
- 18.Williamson PC, Allman JM. A framework for interpreting functional networks in schizophrenia. Frontiers in human neuroscience. 2012;6:184. doi: 10.3389/fnhum.2012.00184. [DOI] [PMC free article] [PubMed] [Google Scholar]
- 19.van den Heuvel MP, Hulshoff Pol HE. Exploring the brain network: a review on resting-state fMRI functional connectivity. Eur Neuropsychopharmacol. 2010;20(8):519–534. doi: 10.1016/j.euroneuro.2010.03.008. [DOI] [PubMed] [Google Scholar]
- 20.Rosazza C, Minati L, Ghielmetti F, Mandelli ML, Bruzzone MG. Functional connectivity during resting-state functional MR imaging: study of the correspondence between independent component analysis and region-of-interest-based methods. AJNR American journal of neuroradiology. 2012;33(1):180–187. doi: 10.3174/ajnr.A2733. [DOI] [PMC free article] [PubMed] [Google Scholar]
- 21.Friston KJ, Frith CD, Liddle PF, Frackowiak RS. Functional connectivity: the principal-component analysis of large (PET) data sets. J Cereb Blood Flow Metab. 1993;13(1):5–14. doi: 10.1038/jcbfm.1993.4. [DOI] [PubMed] [Google Scholar]
- 22.Friston KJ, Frith CD, Fletcher P, Liddle PF, Frackowiak RS. Functional topography: multidimensional scaling and functional connectivity in the brain. Cerebral Cortex. 1996;6(2):156–164. doi: 10.1093/cercor/6.2.156. [DOI] [PubMed] [Google Scholar]
- 23.Calhoun VD, Kiehl KA, Pearlson GD. Modulation of temporally coherent brain networks estimated using ICA at rest and during cognitive tasks. Hum Brain Mapp. 2008;29(7):828–838. doi: 10.1002/hbm.20581. [DOI] [PMC free article] [PubMed] [Google Scholar]
- 24.Calhoun VD, Sui J, Kiehl K, Turner J, Allen E, Pearlson G. Exploring the psychosis functional connectome: aberrant intrinsic networks in schizophrenia and bipolar disorder. Front Psychiatry. 2011;2:75. doi: 10.3389/fpsyt.2011.00075. [DOI] [PMC free article] [PubMed] [Google Scholar]
- 25.Wu L, Eichele T, Calhoun VD. Reactivity of hemodynamic responses and functional connectivity to different states of alpha synchrony: a concurrent EEG-fMRI study. Neuroimage. 2010;52(4):1252–1260. doi: 10.1016/j.neuroimage.2010.05.053. [DOI] [PMC free article] [PubMed] [Google Scholar]
- 26.Zou Q, Long X, Zuo X, Yan C, Zhu C, Yang Y, Liu D, He Y, Zang Y. Functional connectivity between the thalamus and visual cortex under eyes closed and eyes open conditions: a resting-state fMRI study. Human brain mapping. 2009;30(9):3066–3078. doi: 10.1002/hbm.20728. [DOI] [PMC free article] [PubMed] [Google Scholar]
- 27.Biswal B, Yetkin FZ, Haughton VM, Hyde JS. Functional connectivity in the motor cortex of resting human brain using echo-planar MRI. Magn Reson Med. 1995;34(4):537–541. doi: 10.1002/mrm.1910340409. [DOI] [PubMed] [Google Scholar]
- 28.Raichle ME, MacLeod AM, Snyder AZ, Powers WJ, Gusnard DA, Shulman GL. A default mode of brain function. P Natl Acad Sci USA. 2001;98(2):676–682. doi: 10.1073/pnas.98.2.676. [DOI] [PMC free article] [PubMed] [Google Scholar]
- 29.Raichle ME, Snyder AZ. A default mode of brain function: a brief history of an evolving idea. Neuroimage. 2007;37(4):1083–1090. doi: 10.1016/j.neuroimage.2007.02.041. discussion 1097-1089. [DOI] [PubMed] [Google Scholar]
- 30.Deco G, Jirsa VK, McIntosh AR. Emerging concepts for the dynamical organization of resting-state activity in the brain. Nature reviews Neuroscience. 2011;12(1):43–56. doi: 10.1038/nrn2961. [DOI] [PubMed] [Google Scholar]
- 31.Deco G, Corbetta M. The dynamical balance of the brain at rest. The Neuroscientist : a review journal bringing neurobiology, neurology and psychiatry. 2011;17(1):107–123. doi: 10.1177/1073858409354384. [DOI] [PMC free article] [PubMed] [Google Scholar]
- 32.Rosazza C, Minati L. Resting-state brain networks: literature review and clinical applications. Neurol Sci. 2011;32(5):773–785. doi: 10.1007/s10072-011-0636-y. [DOI] [PubMed] [Google Scholar]
- 33.Pearlson GD, Calhoun VD. Convergent approaches for defining functional imaging endophenotypes in schizophrenia. Front Hum Neurosci. 2009;3:37. doi: 10.3389/neuro.09.037.2009. [DOI] [PMC free article] [PubMed] [Google Scholar]
- 34.Raichle ME, Mintun MA. Brain work and brain imaging. Annual review of neuroscience. 2006;29:449–476. doi: 10.1146/annurev.neuro.29.051605.112819. [DOI] [PubMed] [Google Scholar]
- 35.Raichle ME. Two views of brain function. Trends in cognitive sciences. 2010;14(4):180–190. doi: 10.1016/j.tics.2010.01.008. [DOI] [PubMed] [Google Scholar]
- 36.Fox MD, Raichle ME. Spontaneous fluctuations in brain activity observed with functional magnetic resonance imaging. Nature reviews Neuroscience. 2007;8(9):700–711. doi: 10.1038/nrn2201. [DOI] [PubMed] [Google Scholar]
- 37.Greicius M. Resting-state functional connectivity in neuropsychiatric disorders. Current opinion in neurology. 2008;21(4):424–430. doi: 10.1097/WCO.0b013e328306f2c5. [DOI] [PubMed] [Google Scholar]
- 38.Fox MD, Greicius M. Clinical applications of resting state functional connectivity. Frontiers in systems neuroscience. 2010;4:19. doi: 10.3389/fnsys.2010.00019. [DOI] [PMC free article] [PubMed] [Google Scholar]
- 39.Erhardt EB, Allen EA, Damaraju E, Calhoun VD. On network derivation, classification, and visualization: a response to Habeck and Moeller. Brain Connect. 2011;1(2):1–19. doi: 10.1089/brain.2011.0022. [DOI] [PMC free article] [PubMed] [Google Scholar]
- 40.Zhou Y, Shu N, Liu Y, Song M, Hao Y, Liu H, Yu C, Liu Z, Jiang T. Altered resting-state functional connectivity and anatomical connectivity of hippocampus in schizophrenia. Schizophrenia research. 2008;100(1-3):120–132. doi: 10.1016/j.schres.2007.11.039. [DOI] [PubMed] [Google Scholar]
- 41.Bluhm RL, Miller J, Lanius RA, Osuch EA, Boksman K, Neufeld RW, Theberge J, Schaefer B, Williamson PC. Retrosplenial cortex connectivity in schizophrenia. Psychiat Res. 2009;174(1):17–23. doi: 10.1016/j.pscychresns.2009.03.010. [DOI] [PubMed] [Google Scholar]
- 42.Bluhm RL, Miller J, Lanius RA, Osuch EA, Boksman K, Neufeld RW, Theberge J, Schaefer B, Williamson P. Spontaneous low-frequency fluctuations in the BOLD signal in schizophrenic patients: anomalies in the default network. Schizophr Bull. 2007;33(4):1004–1012. doi: 10.1093/schbul/sbm052. [DOI] [PMC free article] [PubMed] [Google Scholar]
- 43.Liang M, Zhou Y, Jiang T, Liu Z, Tian L, Liu H, Hao Y. Widespread functional disconnectivity in schizophrenia with resting-state functional magnetic resonance imaging. Neuroreport. 2006;17(2):209–213. doi: 10.1097/01.wnr.0000198434.06518.b8. [DOI] [PubMed] [Google Scholar]
- 44.Zhou Y, Liang M, Jiang T, Tian L, Liu Y, Liu Z, Liu H, Kuang F. Functional dysconnectivity of the dorsolateral prefrontal cortex in first-episode schizophrenia using resting-state fMRI. Neuroscience letters. 2007;417(3):297–302. doi: 10.1016/j.neulet.2007.02.081. [DOI] [PubMed] [Google Scholar]
- 45.Gavrilescu M, Rossell S, Stuart GW, Shea TL, Innes-Brown H, Henshall K, McKay C, Sergejew AA, Copolov D, Egan GF. Reduced connectivity of the auditory cortex in patients with auditory hallucinations:a resting state functional magnetic resonance imaging study. Psychological medicine. 2010;40(7):1149–1158. doi: 10.1017/S0033291709991632. [DOI] [PubMed] [Google Scholar]
- 46.Hoptman MJ, D'Angelo D, Catalano D, Mauro CJ, Shehzad ZE, Kelly AM, Castellanos FX, Javitt DC, Milham MP. Amygdalofrontal functional disconnectivity and aggression in schizophrenia. Schizophrenia Bull. 2010;36(5):1020–1028. doi: 10.1093/schbul/sbp012. [DOI] [PMC free article] [PubMed] [Google Scholar]
- 47.Vercammen A, Knegtering H, den Boer JA, Liemburg EJ, Aleman A. Auditory hallucinations in schizophrenia are associated with reduced functional connectivity of the temporo-parietal area. Biol Psychiat. 2010;67(10):912–918. doi: 10.1016/j.biopsych.2009.11.017. [DOI] [PubMed] [Google Scholar]
- 48.Whitfield-Gabrieli S, Thermenos HW, Milanovic S, Tsuang MT, Faraone SV, McCarley RW, Shenton ME, Green AI, Nieto-Castanon A, LaViolette P, Wojcik J, Gabrieli JD, Seidman LJ. Hyperactivity and hyperconnectivity of the default network in schizophrenia and in first-degree relatives of persons with schizophrenia. P Natl Acad Sci USA. 2009;106(4):1279–1284. doi: 10.1073/pnas.0809141106. [DOI] [PMC free article] [PubMed] [Google Scholar]
- 49.Garrity AG, Pearlson GD, McKiernan K, Lloyd D, Kiehl KA, Calhoun VD. Aberrant “default mode” functional connectivity in schizophrenia. Am J Psychiatry. 2007;164(3):450–457. doi: 10.1176/ajp.2007.164.3.450. [DOI] [PubMed] [Google Scholar]
- 50.Woodward ND, Rogers B, Heckers S. Functional resting-state networks are differentially affected in schizophrenia. Schizophrenia research. 2011;130(1-3):86–93. doi: 10.1016/j.schres.2011.03.010. [DOI] [PMC free article] [PubMed] [Google Scholar]
- 51.Zhou Y, Liang M, Tian L, Wang K, Hao Y, Liu H, Liu Z, Jiang T. Functional disintegration in paranoid schizophrenia using resting-state fMRI. Schizophr Res. 2007;97(1-3):194–205. doi: 10.1016/j.schres.2007.05.029. [DOI] [PubMed] [Google Scholar]
- 52.Lagioia A, Van De Ville D, Debbane M, Lazeyras F, Eliez S. Adolescent resting state networks and their associations with schizotypal trait expression. Frontiers in systems neuroscience. 2010;4 doi: 10.3389/fnsys.2010.00035. [DOI] [PMC free article] [PubMed] [Google Scholar]
- 53.McKeown MJ, Makeig S, Brown GG, Jung TP, Kindermann SS, Bell AJ, Sejnowski TJ. Analysis of fMRI data by blind separation into independent spatial components. Hum Brain Mapp. 1998;6(3):160–188. doi: 10.1002/(SICI)1097-0193(1998)6:3<160::AID-HBM5>3.0.CO;2-1. [DOI] [PMC free article] [PubMed] [Google Scholar]
- 54.Calhoun VD, Adali T, Pearlson GD, Pekar JJ. A method for making group inferences from functional MRI data using independent component analysis. Hum Brain Mapp. 2001;14(3):140–151. doi: 10.1002/hbm.1048. [DOI] [PMC free article] [PubMed] [Google Scholar]
- 55.Beckmann CF, DeLuca M, Devlin JT, Smith SM. Investigations into resting-state connectivity using independent component analysis. Philos Trans R Soc Lond B Biol Sci. 2005;360(1457):1001–1013. doi: 10.1098/rstb.2005.1634. [DOI] [PMC free article] [PubMed] [Google Scholar]
- 56.Calhoun VD, Liu J, Adali T. A review of group ICA for fMRI data and ICA for joint inference of imaging, genetic, and ERP data. Neuroimage. 2009;45(1 Suppl):S163–172. doi: 10.1016/j.neuroimage.2008.10.057. [DOI] [PMC free article] [PubMed] [Google Scholar]
- 57.Ongur D, Lundy M, Greenhouse I, Shinn AK, Menon V, Cohen BM, Renshaw PF. Default mode network abnormalities in bipolar disorder and schizophrenia. Psychiatry Res. 2010;183(1):59–68. doi: 10.1016/j.pscychresns.2010.04.008. [DOI] [PMC free article] [PubMed] [Google Scholar]
- 58.Camchong J, Mac Donald AW, 3rd, Bell C, Mueller BA, Lim KO. Altered functional and anatomical connectivity in schizophrenia. Schizophrenia Bull. 2011;37(3):640–650. doi: 10.1093/schbul/sbp131. [DOI] [PMC free article] [PubMed] [Google Scholar]
- 59.Wolf ND, Sambataro F, Vasic N, Frasch K, Schmid M, Schonfeldt-Lecuona C, Thomann PA, Wolf RC. Dysconnectivity of multiple resting-state networks in patients with schizophrenia who have persistent auditory verbal hallucinations. J Psychiatry Neurosci. 2011;36(6):366–374. doi: 10.1503/jpn.110008. [DOI] [PMC free article] [PubMed] [Google Scholar]
- 60.Sorg C, Manoliu A, Neufang S, Myers N, Peters H, Schwerthoffer D, Scherr M, Muhlau M, Zimmer C, Drzezga A, Forstl H, Bauml J, Eichele T, Wohlschlager AM, Riedl V. Increased Intrinsic Brain Activity in the Striatum Reflects Symptom Dimensions in Schizophrenia. Schizophrenia Bull. 2012 doi: 10.1093/schbul/sbr184. 10.1093/schbul/sbr1184. [DOI] [PMC free article] [PubMed] [Google Scholar]
- 61.Rotarska-Jagiela A, van de Ven V, Oertel-Knochel V, Uhlhaas PJ, Vogeley K, Linden DE. Resting-state functional network correlates of psychotic symptoms in schizophrenia. Schizophr Res. 2010;117(1):21–30. doi: 10.1016/j.schres.2010.01.001. [DOI] [PubMed] [Google Scholar]
- 62.Calhoun VD, Eichele T, Pearlson G. Functional brain networks in schizophrenia: a review. Front Hum Neurosci. 2009;3:17. doi: 10.3389/neuro.09.017.2009. [DOI] [PMC free article] [PubMed] [Google Scholar]
- 63.Jafri MJ, Pearlson GD, Stevens M, Calhoun VD. A method for functional network connectivity among spatially independent resting-state components in schizophrenia. Neuroimage. 2008;39(4):1666–1681. doi: 10.1016/j.neuroimage.2007.11.001. [DOI] [PMC free article] [PubMed] [Google Scholar]
- 64.Lui S, Li T, Deng W, Jiang L, Wu Q, Tang H, Yue Q, Huang X, Chan RC, Collier DA, Meda SA, Pearlson G, Mechelli A, Sweeney JA, Gong Q. Short-term effects of antipsychotic treatment on cerebral function in drug-naive first-episode schizophrenia revealed by “resting state” functional magnetic resonance imaging. Arch Gen Psychiatry. 2010;67(8):783–792. doi: 10.1001/archgenpsychiatry.2010.84. [DOI] [PubMed] [Google Scholar]
- 65.Meda SA, Gill A, Stevens MC, Lorenzoni RP, Glahn DC, Calhoun VD, Sweeney JA, Tamminga CA, Keshavan MS, Thaker G, Pearlson GD. Differences in resting-state functional magnetic resonance imaging functional network connectivity between schizophrenia and psychotic bipolar probands and their unaffected first-degree relatives. Biol Psychiat. 2012;71(10):881–889. doi: 10.1016/j.biopsych.2012.01.025. [DOI] [PMC free article] [PubMed] [Google Scholar]
- 66.Bassett DS, Gazzaniga MS. Understanding complexity in the human brain. Trends in cognitive sciences. 2011;15(5):200–209. doi: 10.1016/j.tics.2011.03.006. [DOI] [PMC free article] [PubMed] [Google Scholar]
- 67.Rubinov M, Sporns O. Complex network measures of brain connectivity: uses and interpretations. Neuroimage. 2010;52(3):1059–1069. doi: 10.1016/j.neuroimage.2009.10.003. [DOI] [PubMed] [Google Scholar]
- 68.Telesford QK, Simpson SL, Burdette JH, Hayasaka S, Laurienti PJ. The brain as a complex system: using network science as a tool for understanding the brain. Brain Connect. 2011;1(4):295–308. doi: 10.1089/brain.2011.0055. [DOI] [PMC free article] [PubMed] [Google Scholar]
- 69.Wang J, Zuo X, He Y. Graph-based network analysis of resting-state functional MRI. Front Syst Neurosci. 2010;4:16. doi: 10.3389/fnsys.2010.00016. [DOI] [PMC free article] [PubMed] [Google Scholar]
- 70.Bullmore E, Sporns O. Complex brain networks: graph theoretical analysis of structural and functional systems. Nat Rev Neurosci. 2009;10(3):186–198. doi: 10.1038/nrn2575. [DOI] [PubMed] [Google Scholar]
- 71.Fornito A, Zalesky A, Pantelis C, Bullmore ET. Schizophrenia, neuroimaging and connectomics. Neuroimage. 2012;62(4):2296–2314. doi: 10.1016/j.neuroimage.2011.12.090. [DOI] [PubMed] [Google Scholar]
- 72.Liu Y, Liang M, Zhou Y, He Y, Hao Y, Song M, Yu C, Liu H, Liu Z, Jiang T. Disrupted small-world networks in schizophrenia. Brain. 2008;131(Pt 4):945–961. doi: 10.1093/brain/awn018. [DOI] [PubMed] [Google Scholar]
- 73.Lynall ME, Bassett DS, Kerwin R, McKenna PJ, Kitzbichler M, Muller U, Bullmore E. Functional connectivity and brain networks in schizophrenia. J Neurosci. 2010;30(28):9477–9487. doi: 10.1523/JNEUROSCI.0333-10.2010. [DOI] [PMC free article] [PubMed] [Google Scholar]
- 74.Alexander-Bloch AF, Gogtay N, Meunier D, Birn R, Clasen L, Lalonde F, Lenroot R, Giedd J, Bullmore ET. Disrupted modularity and local connectivity of brain functional networks in childhood-onset schizophrenia. Front Syst Neurosci. 2010;4:147. doi: 10.3389/fnsys.2010.00147. [DOI] [PMC free article] [PubMed] [Google Scholar]
- 75.Yu Q, Sui J, Rachakonda S, He H, Gruner W, Pearlson G, Kiehl KA, Calhoun VD. Altered topological properties of functional network connectivity in schizophrenia during resting state: a small-world brain network study. PLoS One. 2011;6(9):e25423. doi: 10.1371/journal.pone.0025423. [DOI] [PMC free article] [PubMed] [Google Scholar]
- 76.Bassett DS, Nelson BG, Mueller BA, Camchong J, Lim KO. Altered resting state complexity in schizophrenia. Neuroimage. 2012;59(3):2196–2207. doi: 10.1016/j.neuroimage.2011.10.002. [DOI] [PMC free article] [PubMed] [Google Scholar]
- 77.Salvador R, Suckling J, Coleman MR, Pickard JD, Menon D, Bullmore E. Neurophysiological architecture of functional magnetic resonance images of human brain. Cereb Cortex. 2005;15(9):1332–1342. doi: 10.1093/cercor/bhi016. [DOI] [PubMed] [Google Scholar]
- 78.He Y, Wang J, Wang L, Chen ZJ, Yan C, Yang H, Tang H, Zhu C, Gong Q, Zang Y, Evans AC. Uncovering intrinsic modular organization of spontaneous brain activity in humans. PLoS One. 2009;4(4):e5226. doi: 10.1371/journal.pone.0005226. [DOI] [PMC free article] [PubMed] [Google Scholar]
- 79.Meunier D, Lambiotte R, Fornito A, Ersche KD, Bullmore ET. Hierarchical modularity in human brain functional networks. Front Neuroinform. 2009;3:37. doi: 10.3389/neuro.11.037.2009. [DOI] [PMC free article] [PubMed] [Google Scholar]
- 80.Kashtan N, Alon U. Spontaneous evolution of modularity and network motifs. Proc Natl Acad Sci U S A. 2005;102(39):13773–13778. doi: 10.1073/pnas.0503610102. [DOI] [PMC free article] [PubMed] [Google Scholar]
- 81.Meunier D, Lambiotte R, Bullmore ET. Modular and hierarchically modular organization of brain networks. Front Neurosci. 2010;4:200. doi: 10.3389/fnins.2010.00200. [DOI] [PMC free article] [PubMed] [Google Scholar]
- 82.Bassett DS, Wymbs NF, Porter MA, Mucha PJ, Carlson JM, Grafton ST. Dynamic reconfiguration of human brain networks during learning. Proc Natl Acad Sci U S A. 2011;108(18):7641–7646. doi: 10.1073/pnas.1018985108. [DOI] [PMC free article] [PubMed] [Google Scholar]
- 83.van Os J, Kenis G, Rutten BP. The environment and schizophrenia. Nature. 2010;468(7321):203–212. doi: 10.1038/nature09563. [DOI] [PubMed] [Google Scholar]
- 84.Yu Q, Plis SM, Erhardt EB, Allen EA, Sui J, Kiehl KA, Pearlson G, Calhoun VD. Modular Organization of Functional Network Connectivity in Healthy Controls and Patients with Schizophrenia during the Resting State. Front Syst Neurosci. 2012;5:103. doi: 10.3389/fnsys.2011.00103. [DOI] [PMC free article] [PubMed] [Google Scholar]
- 85.Alexander-Bloch A, Lambiotte R, Roberts B, Giedd J, Gogtay N, Bullmore E. The discovery of population differences in network community structure: new methods and applications to brain functional networks in schizophrenia. Neuroimage. 2012;59(4):3889–3900. doi: 10.1016/j.neuroimage.2011.11.035. [DOI] [PMC free article] [PubMed] [Google Scholar]
- 86.Du W, Calhoun VD, Li H, Ma S, Eichele T, Kiehl KA, Pearlson GD, Adali T. High classification accuracy for schizophrenia with rest and task FMRI data. Frontiers in human neuroscience. 2012;6:145. doi: 10.3389/fnhum.2012.00145. [DOI] [PMC free article] [PubMed] [Google Scholar]
- 87.Shen H, Wang LB, Liu YD, Hu DW. Discriminative analysis of resting-state functional connectivity patterns of schizophrenia using low dimensional embedding of fMRI. Neuroimage. 2010;49(4):3110–3121. doi: 10.1016/j.neuroimage.2009.11.011. [DOI] [PubMed] [Google Scholar]
- 88.Arbabshirani MR, Calhoun VD. Functional network connectivity during rest and task: comparison of healthy controls and schizophrenic patients. Conf Proc IEEE Eng Med Biol Soc. 2011;2011:4418–4421. doi: 10.1109/IEMBS.2011.6091096. [DOI] [PubMed] [Google Scholar]
- 89.Tzourio-Mazoyer N, Landeau B, Papathanassiou D, Crivello F, Etard O, Delcroix N, Mazoyer B, Joliot M. Automated anatomical labeling of activations in SPM using a macroscopic anatomical parcellation of the MNI MRI single-subject brain. Neuroimage. 2002;15(1):273–289. doi: 10.1006/nimg.2001.0978. [DOI] [PubMed] [Google Scholar]
- 90.Smith SM, Jenkinson M, Woolrich MW, Beckmann CF, Behrens TE, Johansen-Berg H, Bannister PR, De Luca M, Drobnjak I, Flitney DE, Niazy RK, Saunders J, Vickers J, Zhang Y, De Stefano N, Brady JM, Matthews PM. Advances in functional and structural MR image analysis and implementation as FSL. Neuroimage. 2004;23 Suppl 1:S208–219. doi: 10.1016/j.neuroimage.2004.07.051. [DOI] [PubMed] [Google Scholar]